
Pakistan March 2026: Market up 39.9%, Sazgar Haval H6 up to #2
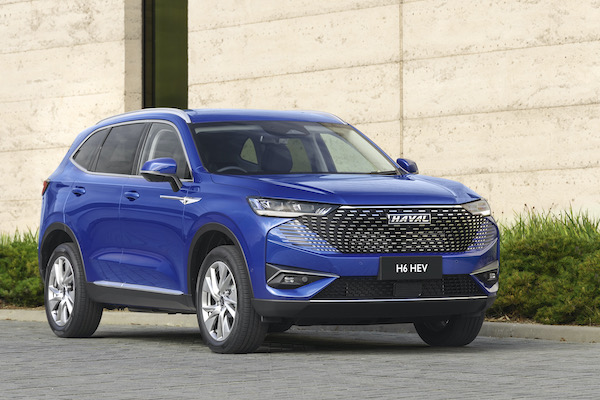
The Sazgar Haval H6 is up to #2 in Pakistan in March.
Data by local association PAMA shows sales of new locally produced light vehicles in Pakistan surging +39.9% year-on-year in March to 15,531. This leads to a Q1 volume up 38.6% to 55,707. Note not all manufacturers present in Pakistan are members of PAMA such as Kia, Changan and MG notably and therefore don’t appear in these statistics. Suzuki (+37.7%) matches the market to stay on top of the brands charts but at 40.2% share it is well below the 45.5% it commands over Q1. Below Toyota (+23.7%), Sazgar Haval (+84.4%) and Honda (+62.7%) stun while JAC surges 278.9%. Model-wise, the Suzuki Alto (+47.9%) remains ultra dominant at 29.4$% share just as the Sazgar Haval H6 (+84.4%) climbs to 2nd place. The Honda Civic is estimated to grow 71.5% at #4 and the Suzuki Swift is up 66.4% to #6.
Previous month: Pakistan February 2026: Suzuki Swift (+151%), Every (+390.9%) shoot up, registrations up 41.7%
One year ago: Pakistan March 2025: Toyota up 83.6% in market up 18.3%
Full March 2026 Top 10 All brands and Top 23 All models below.
Pakistan March 2026 – brands:
PosBrandMar-26%/25Feb2026%/25PosFY251Suzuki6,25040.2%+ 37.7%125,32645.5%+ 39.8%112Toyota3,87324.9%+ 23.7%212,75022.9%+ 40.5%223Honda2,32415.0%+ 62.7%38,05814.5%+ 41.6%334Sazgar Haval1,73311.2%+ 84.4%45,3639.6%+ 40.7%445Hyundai9286.0%– 2.5%52,9665.3%– 2.7%556JAC2881.9%+ 278.9%66741.2%+ 105.5%667Isuzu810.5%n/a73370.6%n/a788Dewan Honri530.3%n/a81240.2%+ 342.9%899BAIC10.0%– 66.7%9570.1%+ 137.5%91010Dewan Kia00.0%– 100.0%10520.1%– 20.0%107
Pakistan March 2026 – models:
PosModelMar-26%/25Feb2026%/25PosFY251Suzuki Alto4,57129.4%+ 47.9%117,16430.8%+ 46.8%112Sazgar Haval H61,73311.2%+ 84.4%35,3639.6%+ 40.7%233Toyota Corolla (est)1,4479.3%+ 32.3%44,7508.5%+ 62.7%324Honda Civic (est)1,1687.5%+ 71.5%64,1467.4%+ 43.9%565Toyota Yaris (est)1,1647.5%+ 32.3%53,8216.9%+ 62.7%656Suzuki Swift9926.4%+ 66.4%24,6038.3%+ 99.5%447Honda City (est)8815.7%+ 71.4%73,1285.6%+ 43.8%778Toyota Corolla Cross (est)5343.4%+ 32.2%91,7543.1%+ 62.6%9109Toyota Hilux (est)4012.6%– 3.4%111,3362.4%– 11.2%101110Suzuki Every3902.5%+ 10.5%82,1653.9%+ 135.6%8911Toyota Fortuner (est)3272.1%– 3.3%141,0892.0%– 11.2%121412Hyundai Tucson3212.1%– 5.0%131,0451.9%– 3.0%131213Hyundai Porter3062.0%+ 112.5%129361.7%+ 88.3%141514Suzuki Cultus2941.9%+ 203.1%101,2492.2%+ 46.3%111315JAC X200 Ghandhara2881.9%+ 278.9%166741.2%+ 105.5%171816Honda BR-V & HR-V2751.8%+ 18.0%157841.4%+ 23.3%151617Hyundai Elantra2181.4%+ 2.8%177151.3%+ 24.6%161718Isuzu D-Max810.5%n/a183370.6%n/a182319Dewan Honri-Ve530.3%n/a221240.2%+ 342.9%222420Hyundai Sonata430.3%– 58.7%201260.2%– 69.9%212021Hyundai Santa Fe400.3%– 74.0%211440.3%– 70.1%201922Suzuki Ravi30.0%– 99.0%241450.3%– 91.2%19823BAIC BJ40L10.0%– 66.7%19570.1%+ 137.5%2326
Source: PAMA
More Stories
Hong Kong (China) Full Year 2025: BYD and Sealion 7 take charge
This content is for members only. Visit the site and log in/register to read.
2027 Toyota Tundra Trailhunter Brings Factory Off-Road Upgrades to the SR5
Toyota is giving the 2027 Tundra a tougher personality with the addition of a new Trailhunter package, bringing factory-backed off-road...
Trump Adds 50 Percent Tariffs on Canadian Goods as Auto Trade Fight Escalates
The trade fight between the United States and Canada is escalating again, and the auto industry is right in the...
U.S. Automakers Race to Remove Chinese Connected-Car Hardware as New Federal Rules Loom
The U.S. auto industry is entering another major supply-chain shift, and this one reaches deep into the electronics that make...
Portugal June 2026: Sales up 13.6%, Dacia and Tesla break volume records
Dacia posts its first 2,000+ sales month in Portugal. Another solid result for new car sales in Portugal, up 13.6%...
Cadillac CT5-V Blackwing Successor Reportedly Planned as Next-Gen Super Sedan Takes Shape
Cadillac’s CT5-V Blackwing may not be heading quietly into history after all. While the current-generation CT5-V Blackwing is set to...