
South Africa March 2026: Record market, BYD and Tata now share figures
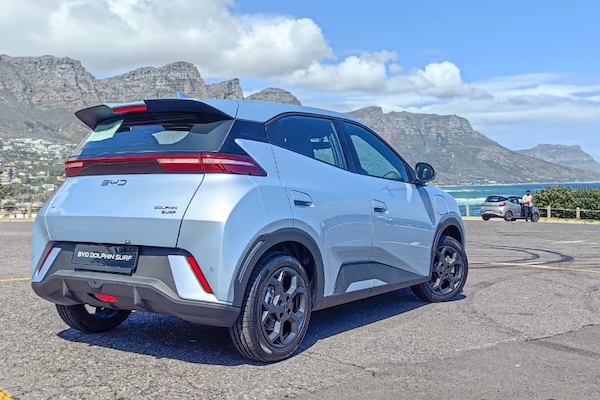
The Dolphin Surf is BYD’s best-seller in South Africa in March.
18th straight month of year-on-year gains for the South African new vehicle market, with March volumes up a splendid 17.3% to 58,060. For the second consecutive month, this is a new record, eclipsing the previous March best of 56,110 hit in March 2012. The year-to-date tally is now up 12.4% to 161,978 units. In contrast exports drop -5.3% to 37,388 and are down -11.6% over Q1 to 86,281.
Toyota (+14.3%) scores a 22.9% share, similar to the 23.1% it holds year-to-date. The VW Group (+13.5%) is back above Suzuki (-4.5%) for the first time this year. Isuzu (+27.3%) surges three spots on February to #4, overtaking Hyundai (+5%), Ford (-2.7%) and GWM (+34.4%). Chery (+25.7%) is also in excellent shape at #8 while Jetour (+238%) manages a second ever Top 10 finish after last December and breaks its volume record at 1,768. BYD (#21) and Tata Passenger Cars (#22) now report sales. BYD’s best-sellers are the Dolphin Surf (239 sales) and Shark (94).
Model-wise, the Toyota Hilux (+40.9%) surges ahead to 7.1% share, its highest since December 2024, and cements its YTD dominance at 6.1% of the market, the only nameplate above 4%. The Isuzu D-Max (+33.7%) climbs up three ranks on February to #2, its best ranking since exactly a year ago in March 2025 when it was also #2. The VW Polo Vivo (+32.6%) is another great performer at #3 whereas the Ford Ranger (-4.8%) is in trouble at #4. The Chery Tiggo 4 Pro (+71.3%) remains the best-selling Chinese vehicle in the country.
Previous month: South Africa February 2026: Chinese shine in record market
One year ago: South Africa March 2025: Sales up 12.5%, Mahindra breaks records
Full March 2026 Top 46 All manufacturers and Top 50 models below.
South Africa March 2026 – manufacturers:
PosManufacturerMar-26%/25Feb2026%/25PosFY251Toyota13,32322.9%+ 14.3%137,38123.1%+ 5.1%112Volkswagen Group5,5749.6%+ 13.5%315,2439.4%– 3.8%333Suzuki5,0478.7%– 4.5%218,01911.1%+ 1.6%224Isuzu3,5136.1%+ 27.3%77,4904.6%+ 10.3%775Hyundai3,2585.6%+ 5.0%49,4425.8%+ 5.7%446Ford2,8284.9%– 2.7%58,4345.2%+ 4.8%557GWM (incl. Haval)2,7774.8%+ 34.4%67,9124.9%+ 42.9%668Chery2,3904.1%+ 25.7%86,9604.3%+ 21.3%889Mahindra2,2803.9%+ 1.2%95,9473.7%+ 11.7%91010Jetour1,7683.0%+ 238.0%114,9913.1%+ 249.0%111511Kia1,6462.8%+ 17.4%105,2803.3%+ 22.2%10912BMW Group1,5882.7%+ 18.8%143,9192.4%+ 3.8%141313Nissan1,4872.6%– 35.4%153,8242.4%– 22.9%151214Omoda and Jaecoo1,4332.5%+ 77.8%134,1432.6%+ 78.5%131415Renault1,4072.4%+ 0.4%124,2462.6%– 0.7%121116Stellantis7141.2%+ 36.0%161,9111.2%+ 35.5%161617MG6891.2%new171,7901.1%new172418FAW Trucks6211.1%+ 43.4%191,4730.9%+ 24.7%201819Foton6041.0%+ 107.6%201,5290.9%+ 183.7%191920Mercedes5951.0%+ 5.7%181,6141.0%+ 10.9%181721BYD5891.0%new –5890.4%new26 –22Tata PC5150.9%new –5150.3%new30 –23Honda3480.6%+ 92.3%239300.6%+ 46.2%212524Jaguar Land Rover3190.5%+ 3.2%248020.5%– 0.4%242125JAC3140.5%+ 24.1%219000.6%+ 35.5%222226Daimler Trucks2730.5%– 22.9%228050.5%– 4.8%232027Volvo Group2510.4%+ 70.7%314390.3%+ 7.9%312928Mitsubishi2410.4%+ 22.3%275280.3%– 5.0%293029UD Trucks2270.4%+ 9.1%265430.3%+ 9.0%282830Mazda2090.4%– 9.1%256660.4%– 8.8%252331BAIC1770.3%+ 2.9%285510.3%– 17.3%272632Scania1550.3%– 7.7%293870.2%– 16.1%322733Man1310.2%– 10.9%343170.2%– 17.0%343134Changan1180.2%new303210.2%new334135Volvo Cars1010.2%– 33.1%362500.2%– 18.3%373436Porsche920.2%– 8.9%322870.2%+ 2.5%353337Sinotruk920.2%+ 46.0%332710.2%+ 64.2%363638Powerstar850.1%– 11.5%352480.2%– 14.5%383239Babcock640.1%+ 77.8%401070.1%+ 50.7%424240Subaru480.1%+ 26.3%42870.1%– 37.9%433741VECV South Africa460.1%+ 84.0%381390.1%+ 124.2%394042Tata410.1%– 39.7%391340.1%– 36.5%403543Shacman400.1%n/a41720.0%n/a444344Iveco260.0%– 42.2%371210.1%– 5.5%413945Proton100.0%– 85.9%43200.0%– 87.5%453846Ferrari (Scuderia)60.0%+ 500.0%44110.0%+ 10.0%4644
South Africa March 2026 – models:
PosModelMar-26%/25Feb2026%/25PosFY251Toyota Hilux4,1187.1%+ 40.9%19,9556.1%+ 22.0%112Isuzu D-Max3,0085.2%+ 33.7%56,2903.9%+ 12.6%363VW Polo Vivo2,2583.9%+ 32.6%46,3443.9%– 1.5%224Ford Ranger2,0743.6%– 4.8%36,2363.8%+ 0.5%435Chery Tiggo 4 Pro1,8883.3%+ 71.3%65,3223.3%+ 57.9%686Toyota Corolla Cross1,5362.6%– 2.2%123,4312.1%– 18.9%1257Hyundai Grand i101,4102.4%– 6.3%74,1522.6%+ 1.3%778Suzuki Swift1,4002.4%– 12.9%25,9373.7%– 9.9%549GWM Haval Jolion1,2622.2%+ 14.5%113,5422.2%+ 11.2%101110Suzuki Fronx1,1792.0%+ 12.1%103,4922.2%+ 18.4%111011Toyota Starlet1,1742.0%+ 9.2%83,7872.3%– 16.5%8912Nissan Magnite1,0781.9%– 25.3%182,7101.7%– 16.4%161513Mahindra XUV3X01,0631.8%+ 37.2%192,5811.6%+ 33.6%172314Mahindra Scorpio Pik Up1,0371.8%– 14.7%132,7641.7%– 0.5%151815Toyota Fortuner1,0001.7%+ 26.1%222,1321.3%+ 2.5%222016Kia Sonet9751.7%+ 18.5%142,8861.8%+ 14.0%131217Toyota Vitz9311.6%+ 189.1%93,6442.2%+ 114.6%91618Omoda C58451.5%+ 51.2%172,5761.6%+ 58.2%182119VW Polo8371.4%– 10.2%202,3531.5%– 6.6%191720Toyota Urban Cruiser8161.4%+ 15.6%212,1311.3%– 13.8%231421GWM P-Series7851.4%+ 95.3%271,8051.1%+ 116.4%262922Toyota Starlet Cross7791.3%– 18.6%152,8051.7%– 6.8%141323Toyota Hiace7711.3%+ 25.0%242,0201.2%+ 4.7%242224Jetour T26461.1%n/a251,9301.2%n/a25n/a25Renault Kiger5090.9%+ 40.2%341,2890.8%+ 11.1%333326Toyota Rumion5020.9%+ 25.8%232,2251.4%+ 85.3%202727Hyundai i204940.9%+ 59.9%291,5511.0%+ 61.2%283828VW Amarok4660.8%+ 69.5%361,1880.7%+ 46.7%373629Toyota Prado4580.8%– 7.5%281,4070.9%+ 19.1%29n/a30Suzuki S-Presso4570.8%+ 111.6%411,1390.7%+ 47.2%384031VW T-Cross4530.8%– 3.2%431,3250.8%– 10.8%322432Renault Triber4390.8%+ 25.1%261,6411.0%+ 51.4%273733Jetour T14370.8%n/a321,3260.8%n/a31n/a34Hyundai Exter4370.8%+ 3.8%301,2200.8%+ 3.6%353235GWM Haval H64340.7%+ 43.2%381,2320.8%+ 37.2%343136Tata Tiago4260.7%new –4260.3%newn/a –37Jetour Dashing4140.7%+ 36.2%371,0930.7%+ 29.2%403438Renault Kwid4110.7%– 28.1%421,1320.7%– 37.1%392539Toyota Land Cruiser 704060.7%– 19.9%331,3750.8%– 17.1%302640VW Polo Sedan4050.7%– 4.3%50n/an/an/an/an/a41Citroen C33890.7%n/an/an/an/an/an/an/a42BMW X33880.7%+ 38.1%n/an/an/an/an/an/a43Nissan Navara3800.7%– 54.5%391,0680.7%– 30.9%423044Suzuki Baleno3630.6%– 28.0%351,2150.8%– 4.3%362845Suzuki Ertiga3510.6%– 52.9%162,1451.3%+ 6.7%211946Ford Territory3420.6%+ 50.7%311,0850.7%+ 32.0%413947Jaecoo J53190.5%n/an/an/an/an/an/an/a48Ford Everest3000.5%– 12.5%44n/an/an/an/an/a49VW Tiguan2930.5%n/an/an/an/an/an/an/a50Chery Tiggo 7 Pro2900.5%– 31.0%401,0500.6%– 13.7%4335
Source: NAAMSA
More Stories
2027 Toyota Tundra Trailhunter Brings Factory Off-Road Upgrades to the SR5
Toyota is giving the 2027 Tundra a tougher personality with the addition of a new Trailhunter package, bringing factory-backed off-road...
Trump Adds 50 Percent Tariffs on Canadian Goods as Auto Trade Fight Escalates
The trade fight between the United States and Canada is escalating again, and the auto industry is right in the...
U.S. Automakers Race to Remove Chinese Connected-Car Hardware as New Federal Rules Loom
The U.S. auto industry is entering another major supply-chain shift, and this one reaches deep into the electronics that make...
Portugal June 2026: Sales up 13.6%, Dacia and Tesla break volume records
Dacia posts its first 2,000+ sales month in Portugal. Another solid result for new car sales in Portugal, up 13.6%...
Cadillac CT5-V Blackwing Successor Reportedly Planned as Next-Gen Super Sedan Takes Shape
Cadillac’s CT5-V Blackwing may not be heading quietly into history after all. While the current-generation CT5-V Blackwing is set to...
What to Do if You Bought a Defective Vehicle
Buying a new car can be life-changing to some, but a major liability to others who unknowingly bought a lemon....