
Singapore April 2026: BYD breaks share record at 30.7%, GAC in Top 5
BYD crosses the 30% share milestone for the first time.
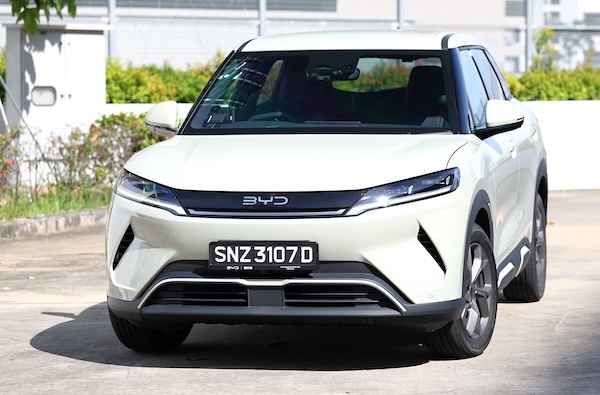
It’s another excellent month for new car sales in Singapore at +15.3% year-on-year in April to 4,553 units. This way, the year-to-date volume is now up 20.3% to 17,875. BYD (+70.9%) continues to fly high, even breaking its market share record at 30.7% (previous best 28.2% last January). 96% of BYD’s April sales are BEVs. Toyota (-35%) is in great difficulty and sells less than a third of BYD’s volume… Mercedes (-6.1%) and BMW (-22.2%) follow, both unable to capitalise on the positive market. GAC (+105.8%) breaks into the Top 5 for the first time with 97% of its volume being BEVs. Zeekr (+1014.3%), Chery (+566.7%) and MG (+219.6%) all post surreal gains, with Tesla (+37.7%) also dynamic YoY but down to #8.
Previous month: Singapore March 2026: Chery, MG, Tesla shine in market up 16.5%
One year ago: Singapore April 2024: BYD at 20.7% share, GAC inside Top 10
Full April 2026 Top 47 All brands ranking below.
Singapore April 2026 – brands:
PosBrandApr-26%/25Mar2026%/25PosFY251BYD1,40030.7%+ 70.9%14,63926.0%+ 54.5%112Toyota (incl Lexus)4279.4%– 35.0%22,35913.2%+ 15.1%223Mercedes2916.4%– 6.1%51,1476.4%– 31.9%444BMW2876.3%– 22.2%41,1196.3%– 33.9%535GAC2144.7%+ 105.8%76053.4%+ 130.0%8116Honda2024.4%– 53.3%68844.9%– 40.9%657Chery2004.4%+ 566.7%88004.5%+ 566.7%7168Tesla1683.7%+ 37.7%31,6839.4%+ 214.6%369MG1633.6%+ 219.6%105383.0%+ 244.9%91310Zeekr1563.4%+ 1014.3%134252.4%+ 451.9%101411Xpeng1523.3%+ 117.1%123992.2%+ 53.5%121212Hyundai982.2%– 25.2%222651.5%– 45.9%14713Kia821.8%– 12.8%113562.0%– 17.2%13914Nissan811.8%– 21.4%94222.4%+ 19.9%111015Volvo661.4%+ 13.8%192021.1%+ 1.0%161816Audi601.3%+ 17.6%182141.2%+ 23.7%151517Dongfeng541.2%+ 58.8%142001.1%+ 69.5%172218Maxus511.1%+ 537.5%251100.6%+ 139.1%232619AvatR451.0%new211230.7%new213120Leapmotor420.9%new27920.5%new243521Subaru420.9%+ 10.5%241180.7%– 31.0%221922Mazda400.9%– 71.0%151680.9%– 54.2%20823Porsche320.7%– 41.8%171781.0%– 20.2%191724Geely290.6%new23880.5%new253725Volkswagen280.6%– 69.6%30730.4%– 68.9%272026Mini200.4%+ 5.3%26740.4%– 25.3%262427Skoda200.4%– 42.9%35420.2%– 66.1%312328Citroen160.4%+ 700.0%44200.1%+ 66.7%333829Deepal150.3%– 6.3%31460.3%+ 130.0%302830Polestar120.3%– 14.3%29360.2%– 41.0%322731Land Rover90.2%+ 0.0%28610.3%+ 24.5%282532Opel80.2%+ 100.0%20590.3%+ 742.9%293233Suzuki80.2%– 65.2%161881.1%+ 43.5%182134Smart70.2%+ 16.7%40150.1%– 37.5%363335Cupra40.1%+ 33.3%34130.1%+ 62.5%373436Great Wall40.1%– 66.7%33160.1%– 65.2%352937Alfa Romeo30.1%+ 200.0% –30.0%+ 0.0%474738Ferrari30.1%n/a4180.0%+ 0.0%414039Bentley20.0%+ 100.0%4840.0%– 55.6%443940Maserati20.0%+ 0.0%32100.1%– 50.0%403641NIO20.0%new36180.1%new345942Rolls Royce20.0%+ 100.0%4560.0%+ 100.0%424643Aston Martin10.0%+ 0.0%4730.0%+ 200.0%485344Jaguar10.0%+ 0.0%38100.1%+ 400.0%394345Jeep10.0%n/a4240.0%– 50.0%454846Lamborghini10.0%+ 0.0%4640.0%– 33.3%464447Peugeot10.0%– 92.9%5030.0%– 94.7%5030
Source: LTA


More Stories
Portugal June 2026: Sales up 13.6%, Dacia and Tesla break volume records
Dacia posts its first 2,000+ sales month in Portugal. Another solid result for new car sales in Portugal, up 13.6%...
Cadillac CT5-V Blackwing Successor Reportedly Planned as Next-Gen Super Sedan Takes Shape
Cadillac’s CT5-V Blackwing may not be heading quietly into history after all. While the current-generation CT5-V Blackwing is set to...
What to Do if You Bought a Defective Vehicle
Buying a new car can be life-changing to some, but a major liability to others who unknowingly bought a lemon....
Greece June 2026: Toyota Yaris signs first win in 2 years, strongest market in 17 years
The Toyota Yaris is the best-seller in Greece for the first time since July 2024. New car sales in Greece...
14 Common Myths About Car Insurance Increases After An Accident
Ask around about what happens to your insurance after an accident, and you’ll hear a different answer from every person...
2027 Mercedes-Maybach GLS680 Brings 603 HP V8 Power and Over-the-Top Luxury SUV Presence
Mercedes-Maybach has never been about blending in, and the 2027 Mercedes-Maybach GLS680 makes that very clear from the first glance....