
Ireland April 2026: Toyota RAV4 surges to record 8.4% share
The Toyota RAV4 is by far the best-selling vehicle in Ireland in April.
Exceptional month for new car sales in Ireland at +17% year-on-year in April to 10,184 units. The year-to-date tally is now up 2.2% to 75,073. Toyota (+38.4%) and Skoda (+34.9%) end the month just 11 units apart, which means Toyota widens the gap with its followers and Skoda ascends to #3 year-to-date. Volkswagen (+2.4%) is weak YoY in comparison but holds 13.7% of the market vs. 10.6% so far this year. BYD (+83.1%) stays inside the Top 10 at #9 with Ford (+61.9%) also very dynamic at #6. Hyundai (+14.7%) and Audi (+11.2%), although managing double-digit YoY lifts, trail the market. Further down, notice Citroen (+161.8%), Opel (+72.7%), MG (+47%) and for once Seat (+38.8%) all in outstanding shape.
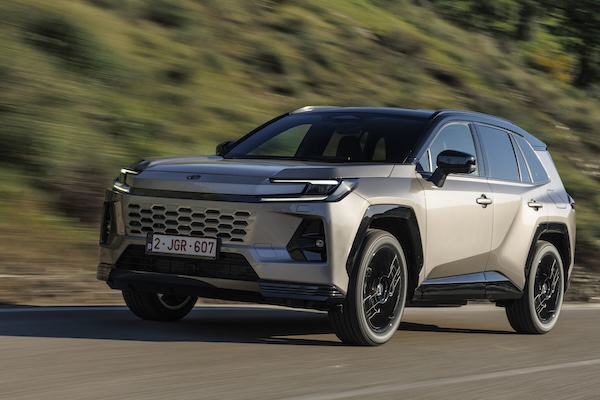
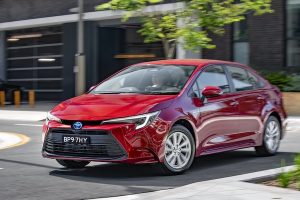
Model-wise, the Toyota RAV4 (+166.3%) surges from #119 in March to #1 in April with a stunning 8.4% share, by far the nameplate’s highest ever with a previous best at 4.6% in January 2022. This is also the RAV4’s first win in exactly a year, since April 2025. Due to a particularly slow start of the year the RAV4 stands at #19 year-to-date vs. #5 over the Full Year 2025. The Skoda Octavia (+46.2%) and Kodiaq (+45.4%) complete the podium ahead of surging VW Golf (+72.1%) and Toyota C-HR (+160.7%). The Skoda Enyaq (+262.3%) and VW ID.4 (+94.7%) also shoot up in the remainder of the Top 10 while the BYD Seal U (+176.4%) and Skoda Elroq (+107.1%) are in equally great shape below.
Previous month: Ireland March 2026: Toyota monopolises podium with Corolla, Yaris Cross and C-HR
One year ago: Ireland April 2025: VW Tayron breaks into Top 10
Full April 2026 Top XX All brands and Top XXX All models below.
Ireland April 2026 – brands:
PosBrandApr-26%/25Mar2026%/25PosFY251Toyota1,45614.3%+ 38.4%110,40213.9%– 3.8%112Skoda1,44514.2%+ 34.9%27,2059.6%+ 3.7%333Volkswagen1,39113.7%+ 2.4%37,93210.6%– 1.5%224Kia7407.3%+ 5.9%45,9177.9%+ 4.6%555Hyundai7187.1%+ 14.7%56,9409.2%+ 0.3%446Ford5315.2%+ 61.9%112,8683.8%+ 13.3%797BMW4964.9%– 4.6%72,7733.7%– 5.6%968Audi4864.8%+ 11.2%132,8773.8%+ 4.2%679BYD3683.6%+ 83.1%82,4013.2%+ 94.7%121510Renault3103.0%– 3.7%122,5843.4%– 8.8%101111Dacia2322.3%– 19.4%182,2913.1%+ 1.7%131012Peugeot1981.9%– 8.3%152,5503.4%– 9.0%11813Seat1861.8%+ 38.8%141,2471.7%– 14.4%171814Citroen1781.7%+ 161.8%211,2011.6%+ 104.9%192215MG1721.7%+ 47.0%221,1791.6%+ 36.6%212116Opel1711.7%+ 72.7%171,9512.6%+ 34.3%141717Volvo1331.3%– 8.9%191,2411.7%+ 10.8%182018Cupra1311.3%– 11.5%201,4171.9%+ 26.0%161919Mercedes1301.3%– 43.2%101,8052.4%+ 11.6%151320Suzuki1221.2%– 35.1%161,1801.6%– 23.6%201621Land Rover780.8%– 11.4%244500.6%– 17.1%252522Lexus730.7%– 25.5%266680.9%– 11.5%232323Mini630.6%+ 90.9%253630.5%– 12.7%262624Tesla600.6%+ 100.0%99311.2%+ 3.1%221425Nissan590.6%+ 9.3%62,7993.7%– 11.1%81226Leapmotor490.5%new302180.3%new293827Mazda340.3%+ 17.2%236460.9%– 35.5%242428Xpeng340.3%+ 466.7%273070.4%+ 358.2%273329Porsche280.3%+ 27.3%341630.2%– 35.6%312830Fiat240.2%– 45.5%31900.1%– 76.9%322731Honda200.2%– 23.1%292460.3%+ 4.2%282932KGM/SsangYong190.2%+ 137.5%33500.1%+ 100.0%343633Jeep170.2%+ 6.3%32750.1%– 13.8%333134Polestar150.1%+ 650.0%281780.2%+ 256.0%303235DS70.1%+ 0.0%35480.1%– 55.1%353436Alpine40.0%+ 100.0%37170.0%+ 325.0%373737Alfa Romeo20.0%+ 0.0%36200.0%– 23.1%363538Cadillac10.0%n/a –20.0%n/a39 –39Maxus10.0%n/a –10.0%n/a414540Aston Martin10.0%n/a –10.0%n/a42 –
Ireland April 2026 – models:
PosModelApr-26%/25Mar2026%/25PosFY251Toyota RAV48608.4%+ 166.3%1199011.2%– 60.9%1952Skoda Octavia3423.4%+ 46.2%91,7002.3%– 17.3%723Skoda Kodiaq3173.1%+ 45.4%71,8212.4%+ 5.7%474VW Golf3083.0%+ 72.1%191,2811.7%– 10.3%11105Toyota C-HR2192.2%+ 160.7%31,4521.9%+ 10.7%10126VW Tiguan2162.1%– 15.3%161,5132.0%+ 0.4%987Kia Sportage2102.1%– 25.5%42,2082.9%+ 4.8%338Skoda Enyaq1921.9%+ 262.3%266080.8%+ 68.0%35519VW ID.41831.8%+ 94.7%241,2321.6%+ 13.0%121310Skoda Karoq1711.7%+ 8.2%207771.0%– 6.7%232111Hyundai Kona1701.7%– 10.1%121,7042.3%+ 4.6%6912Hyundai Tucson1551.5%– 45.4%132,3783.2%– 23.8%2113BYD Seal U1521.5%+ 176.4%111,0621.4%+ 69.9%152614Ford Puma1521.5%+ 68.9%299981.3%+ 11.8%172415Skoda Elroq1451.4%+ 107.1%225960.8%+ 277.2%365316VW Polo1431.4%– 29.6%577911.1%– 9.4%222217VW Tayron1431.4%– 29.2%236950.9%+ 89.9%253118VW T-Roc1201.2%– 34.8%398461.1%– 26.3%201519Hyundai Inster1181.2%+ 1585.7%326620.9%+ 271.9%313220Opel Frontera1141.1%new189751.3%new1820121Hyundai i201121.1%+ 154.5%536730.9%– 8.2%272822Kia EV51071.1%new255210.7%new4426723Ford Kuga1061.0%+ 21.8%436370.8%+ 14.0%333424Toyota Corolla1041.0%– 21.2%11,8202.4%+ 4.7%5625Dacia Sandero960.9%+ 41.2%456720.9%– 30.2%281726Skoda Fabia950.9%– 11.2%595360.7%+ 2.5%434627VW ID.3940.9%+ 118.6%314240.6%+ 29.3%556228BMW 5-Series930.9%– 26.2%414950.7%– 16.7%463629Kia EV3930.9%+ 66.1%216690.9%– 1.9%302530Toyota Yaris Cross930.9%– 49.5%22,5193.4%+ 11.3%1431Ford Explorer920.9%+ 228.6%564240.6%+ 67.6%548432Renault Austral910.9%+ 4450.0%485380.7%+ 138.1%4210633BMW iX3890.9%+ 8800.0%801540.2%+ 710.5%12622734Seat Leon880.9%+ 700.0%463500.5%+ 138.1%659135Audi Q3860.8%+ 38.7%286710.9%+ 25.7%294136Audi A6790.8%+ 6.8%1173480.5%– 19.3%675537VW T-Cross790.8%– 16.0%474310.6%– 30.4%524438Dacia Duster760.7%– 49.7%507221.0%– 20.7%242039Audi A3740.7%– 17.8%922570.3%– 50.0%934040BMW X5730.7%+ 14.1%524270.6%– 32.4%533941Skoda Superb690.7%– 43.0%374910.7%– 15.9%473542Skoda Kamiq680.7%+ 36.0%544550.6%+ 6.3%505743BYD Sealion 7670.7%– 15.2%425380.7%+ 581.0%417544BMW X1660.6%+ 0.0%404100.5%+ 1.2%575045Ford Tourneo650.6%+ 35.4%842020.3%+ 96.1%1097646Kia Sorento640.6%– 23.8%674410.6%– 18.6%513047MGS5630.6%new813820.5%new6016348Audi A5610.6%+ 3.4%953720.5%– 6.1%615449Peugeot 208600.6%+ 500.0%1382130.3%– 35.3%10711350Citroen C3 Aircross590.6%n/a613330.4%+ 16550.0%6927551Toyota Yaris570.6%– 56.5%81,1381.5%– 12.2%141452Audi Q5550.5%+ 3.8%833120.4%+ 40.5%759253Renault Captur550.5%– 43.3%696090.8%– 19.9%346154Toyota bZ4X540.5%+ 38.5%275710.8%+ 101.8%387855Kia Stonic530.5%– 8.6%355570.7%+ 42.5%394756Hyundai Ioniq 5510.5%+ 75.9%624740.6%+ 116.4%486857Suzuki Swift500.5%– 43.2%176460.9%+ 43.2%325258Renault 5490.5%– 5.8%882950.4%+ 264.2%8010359Suzuki Vitara490.5%+ 28.9%793110.4%– 16.6%765960Tesla Model Y490.5%+ 88.5%145180.7%+ 113.2%452761Hyundai Ioniq 6480.5%+ 128.6%443390.5%+ 187.3%6816262Skoda Scala460.5%– 23.3%1002200.3%– 24.7%1059063BYD Seal450.4%+ 32.4%872680.4%– 3.9%908764Peugeot 3008450.4%– 50.0%308301.1%– 26.5%211665Toyota Corolla Cross450.4%– 62.8%151,6932.3%+ 31.5%81166VW Taigo450.4%– 19.6%362760.4%– 6.8%877467Audi Q6 e-tron440.4%+ 300.0%1601030.1%+ 12.0%14415068BYD Dolphin Surf440.4%new1012240.3%new10220669BMW X3430.4%– 20.4%732620.3%– 16.8%926070Ford Focus430.4%– 32.8%1183980.5%– 34.2%583771MG3420.4%+ 133.3%891540.2%+ 37.5%12813772Dacia Bigster410.4%+ 13.9%516840.9%+ 1800.0%268273Range Rover Sport400.4%+ 25.0%1121900.3%– 16.3%11310074Kia EV6390.4%– 25.0%783720.5%– 34.9%623375Ford Transit Custom380.4%n/a168530.1%+ 278.6%17324676Volvo XC60380.4%+ 171.4%553630.5%+ 2.3%635877Citroen C3370.4%n/a713200.4%+ 10566.7%7211878Kia EV2370.4%new –370.0%new192 –79BMW 2-Series340.3%– 12.8%1071790.2%+ 17.8%11812380MG ZS340.3%+ 41.7%1272730.4%+ 23.0%889881Peugeot 5008340.3%– 30.6%585730.8%– 18.0%372982Seat Altea340.3%+ 750.0% –340.0%+ 277.8%194 –83Xpeng G6340.3%+ 466.7%643070.4%+ 358.2%7714984Cupra Terramar330.3%+ 3.1%723160.4%+ 101.3%739585Renault Megane330.3%+ 725.0%1472320.3%+ 123.1%9912986BMW 3-Series320.3%+ 45.5%1091960.3%+ 14.6%1119987Cupra Tavascan320.3%+ 128.6%962760.4%+ 43.8%869688Seat Arona320.3%– 34.7%633860.5%– 26.6%594989Seat Ateca320.3%– 15.8%342630.4%– 22.9%916590Ford Capri300.3%+ 650.0%1281390.2%+ 139.7%13316891Mini Cooper300.3%+ 114.3%941570.2%– 44.1%1248692Kia Picanto290.3%+ 11.5%762290.3%– 13.6%1018593Citroen C5 Aircross280.3%+ 33.3%902800.4%+ 33.3%8510794Mini Countryman270.3%+ 350.0%1031370.2%+ 98.6%13413595Renault Clio270.3%+ 285.7%1731600.2%– 56.0%1234396VW ID.5270.3%+ 285.7%1341710.2%+ 147.8%12015197Citroen Berlingo260.3%+ 52.9%1251100.1%+ 11.1%14212198Leapmotor B10260.3%new131970.1%new14827399Audi Q2250.2%+ 31.6%1501670.2%+ 28.5%122125100Hyundai i10250.2%+ 400.0%1901540.2%– 27.0%12771101Lexus LBX250.2%+ 13.6%1261960.3%– 24.3%11288102Lexus NX250.2%– 28.6%912880.4%+ 4.0%8179103Peugeot 2008250.2%– 41.9%605560.7%+ 34.6%4038104Volvo EX30250.2%– 13.8%143950.1%– 65.3%152111105Kia Niro240.2%– 68.4%652840.4%– 50.3%8242106Kia PV5240.2%new152720.1%new164 –107Toyota Aygo X240.2%– 14.3%772810.4%+ 40.5%84105108BYD Sealion 5230.2%new197270.0%new200 –109Cupra Born230.2%+ 109.1%1442240.3%+ 39.1%103102110Cupra Formentor230.2%– 58.2%683540.5%– 7.1%6463111Fiat Panda230.2%+ 15.0%135480.1%– 76.5%177124112Suzuki SX4 S-Cross230.2%– 56.6%862230.3%– 64.9%10445113Audi Q4220.2%+ 46.7%1561310.2%+ 18.0%136115114BMW IX1220.2%– 60.7%1022510.3%+ 32.8%9497115Kia EV4220.2%new1302020.3%new110176116Renault Symbioz220.2%+ 175.0%334640.6%– 21.6%4948117Hyundai Santa Fe210.2%+ 0.0%1292330.3%– 39.3%9869118Audi Q7200.2%+ 17.6%154900.1%– 32.8%153128119Cupra Leon200.2%– 39.4%1511460.2%– 22.3%130117120Kia EV9200.2%– 23.1%115890.1%– 32.1%155130121Opel Grandland X200.2%– 23.1%1103160.4%+ 1.9%7472122VW ID.7200.2%+ 11.1%1061810.2%– 16.6%11593123BYD Dolphin190.2%+ 111.1%1581080.1%+ 58.8%143157124Dacia Jogger190.2%– 26.9%1231850.2%– 32.2%11481125Leapmotor C10190.2%new169980.1%new147253126Mercedes GLC190.2%– 52.5%752980.4%+ 8.8%7980127Nissan Micra190.2%new146720.1%new165 –128Kia K4180.2%new852340.3%new97 –129Mercedes CLA180.2%+ 28.6%137610.1%– 64.1%170108130Citroen C4170.2%– 19.0%1781250.2%– 24.2%138114131Mercedes GLA170.2%– 50.0%663020.4%+ 21.8%7894132Nissan Qashqai170.2%– 10.5%51,2311.6%– 0.6%1318133Renault 4170.2%new1421570.2%new125219134Mercedes GLE160.2%+ 77.8%1161450.2%+ 83.5%131142135Renault Scenic160.2%+ 45.5%1871210.2%– 20.4%139126136Ssangyong Torres160.2%+ 128.6%149460.1%+ 170.6%181200137Volvo C40/EC40160.2%+ 166.7%164840.1%+ 133.3%156179138Volvo XC40160.2%– 40.7%113970.1%+ 26.0%149154139BMW 1-Series150.1%– 60.5%165960.1%– 34.7%150122140Hyundai Bayon150.1%– 16.7%1051800.2%– 11.8%116101141Mazda CX-5150.1%+ 114.3% –150.0%– 91.3%219134142Mercedes E Class150.1%– 28.6%383490.5%+ 5.1%6673143Opel Astra150.1%– 6.3%182790.1%– 63.1%160104144Volvo XC90150.1%– 55.9%702830.4%+ 14.1%8389145Peugeot 308140.1%+ 100.0%1391800.2%+ 252.9%117178146Peugeot Rifter140.1%+ 55.6%176470.1%+ 0.0%179169147Volvo EX40140.1%– 44.0%1202720.4%+ 227.7%89110148Land Rover Defender130.1%+ 8.3%162450.1%– 36.6%182147149Lexus RX130.1%– 40.9%172760.1%– 6.2%161156150MG S6130.1%new –260.0%new202 –151Mercedes C Class120.1%– 71.4%1042080.3%+ 41.5%108112152Porsche Macan120.1%+ 50.0%200510.1%– 32.0%175156153Range Rover 120.1%– 45.5%140880.1%– 20.0%156146154Mazda2110.1%+ 266.7%1321030.1%+ 3.0%145144155MG4110.1%– 78.4%971740.2%– 51.7%11977156Tesla Model 3110.1%+ 175.0%104130.6%– 37.4%5619156Audi A1100.1%– 50.0%1881150.2%+ 13.9%140132157Opel Mokka100.1%– 73.7%1112170.3%– 42.4%10666158BYD Atto 390.1%– 62.5%161750.1%– 58.8%162120159BYD Seal 690.1%new74990.1%new146 –160Jeep Compass90.1%+ 125.0%157240.0%+ 166.7%205233161Mercedes CLE Coupe90.1%– 50.0%1411140.2%+ 4.6%141140162MG HS90.1%– 52.6%1211700.2%+ 38.2%121119163Nissan Ariya90.1%+ 28.6%982310.3%+ 38.3%100116164Nissan Juke90.1%– 55.0%61,0271.4%– 7.0%1623165Polestar 290.1%+ 800.0%170550.1%+ 57.1%172192166Honda HR-V80.1%+ 33.3%155890.1%+ 9.9%154152167BMW IX270.1%+ 75.0%166710.1%+ 343.8%166164168BMW XM70.1%+ 16.7%167310.0%– 11.4%197196169Opel Combo70.1%– 22.2%175340.0%– 12.8%193170170Range Rover Velar70.1%+ 600.0%184280.0%+ 64.7%199224171BMW i460.1%– 70.0%136960.1%+ 26.3%151136172Honda Civic60.1%+ 50.0%171460.1%– 4.2%180187173Jeep Avenger60.1%– 40.0%180480.1%– 21.3%178143174Peugeot 40860.1%– 14.3%2081500.2%+ 27.1%129148175Polestar 460.1%n/a159830.1%+ 538.5%157172176Porsche Taycan60.1%+ 200.0% –130.0%– 35.0%224217177BMW X750.0%+ 150.0%212150.0%+ 15.4%218228178Lexus RZ50.0%+ 66.7%174420.1%+ 200.0%187225179Lexus UX50.0%– 50.0%185530.1%– 1.9%174175180Mercedes GLB50.0%+ 0.0%82820.1%– 35.9%158141181Mini Aceman50.0%– 28.6%153450.1%+ 50.0%184208182Nissan X-Trail50.0%– 28.6%1222380.3%– 30.0%9683183Opel Corsa50.0%– 37.5%993280.4%– 25.5%7070184Porsche Cayenne50.0%– 44.4%183560.1%– 42.9%171138185Volvo EX9050.0%– 28.6% –140.0%– 53.3%221190186VW Touareg50.0%+ 66.7%177400.1%+ 17.6%190194187Audi Q840.0%– 69.2% –330.0%– 51.5%195166188Citroen C240.0%n/a21380.0%n/a234 –189Leapmotor T0340.0%new198230.0%new208264190Mazda340.0%+ 100.0%1083260.4%+ 307.5%71161191Mercedes A Class40.0%– 63.6%145680.1%– 34.6%167145192Mercedes AMG GT40.0%+ 0.0%191380.1%+ 40.7%191204193Mercedes EQA40.0%+ 300.0%181420.1%+ 40.0%188199194VW ID.Buzz40.0%+ 100.0% –160.0%+ 14.3%217189195Alpine A29030.0%new209160.0%new215237196Audi A6 e-tron30.0%new203500.1%new176188197Citroen C5 X30.0%– 62.5%22540.0%– 84.0%244214198DS 930.0%n/a179110.0%n/a227 –199Honda Jazz30.0%– 62.5%156750.1%+ 8.7%163160200KGM Actyon30.0%new –30.0%new249 –201Mazda CX-8030.0%– 50.0%1141300.2%+ 103.1%137165202Mercedes G Class30.0%– 25.0% –120.0%+ 20.0%226243203Porsche Panamera30.0%+ 50.0%201190.0%– 54.8%212183204Range Rover Evoque30.0%– 50.0%186440.1%– 10.2%185184205VW T730.0%– 81.3%202330.0%– 35.3%196174206Alfa Romeo Tonale20.0%+ 100.0% –20.0%– 71.4%253234207BMW 4-Series20.0%– 66.7%189220.0%– 48.8%210193208DS 420.0%n/a215120.0%– 66.7%225212209DS 720.0%– 66.7%192250.0%– 62.1%203180210Honda CR-V20.0%– 71.4%205250.0%+ 8.7%204198211Hyundai Ioniq 920.0%new194630.1%new169191212Jeep Grand Cherokee20.0%n/a –20.0%n/a259 –213Land Rover Discovery20.0%+ 0.0%227100.0%+ 66.7%232249214Mercedes V Class20.0%– 71.4%163260.0%– 16.1%201202215Porsche 911/Carrera20.0%+ 100.0%199240.0%+ 33.3%206223216Volvo ES9020.0%new217190.0%new213 –217Volvo V6020.0%– 50.0%232140.0%– 17.6%222220218Alpine A11010.0%– 50.0% –10.0%– 75.0%265258219Audi A810.0%+ 0.0% –40.0%– 33.3%242248220Audi e-Tron10.0%n/a –30.0%n/a247 –221Audi e-Tron GT10.0%+ 0.0%21030.0%+ 0.0%248251222BMW i510.0%– 80.0%221160.0%– 59.0%216186223BMW iX10.0%– 50.0%204230.0%+ 130.0%207215224Cadillac Lyriq10.0%new –20.0%new257 –225Citroen Ami10.0%n/a –20.0%– 89.5%258229226Citroen E-C4 X10.0%+ 0.0% –10.0%– 97.4%267197227Citroen Multispace10.0%n/a –10.0%n/a268 –228Citroen Spacetourer10.0%n/a21480.0%+ 166.7%235265229Fiat 60010.0%– 85.7% –420.1%– 31.1%186177230Honda ZR-V10.0%+ 0.0% –110.0%– 26.7%228231231Hyundai i3010.0%– 87.5%193810.1%– 35.2%159131232Land Rover Discovery Sport10.0%– 92.3%124450.1%– 28.6%183182233Maxus Converted Wheelchair10.0%new –10.0%new271 –234Mazda CX-6010.0%– 75.0%1481420.2%+ 67.1%132158235Mercedes Maybach10.0%n/a –20.0%+ 100.0%262277236Mercedes T class10.0%+ 0.0% –70.0%+ 40.0%237256237Mini Convertible10.0%– 50.0%21650.0%– 44.4%240230238VW Passat10.0%n/a –10.0%n/a281 –
Source: SIMI

More Stories
Ford F-150 Overland Capacity: What Actually Matters When You’re Packing for the Backcountry!
Overland Builds Live and Die by How Well You Use Your Roof Ask ten F-150 owners what “overland ready” means...
How Much Does It Cost to Rent an Exotic Car in Houston?
Exotic rentals in Houston run anywhere from $800 to $2,500 per day, and the spread comes down to what’s in...
In-Car Cameras Are Now Required in Europe as Driver Monitoring Debate Heads Toward the U.S.
New vehicles sold in the European Union are now required to include advanced driver-distraction warning technology, and for many models...
2026 Cadillac CT5 Pricing: The Last Luxury Sedan From a Legacy American Automaker
Edmunds said it plainly in their 2026 review: the CT5 is the last luxury sedan from a legacy American automaker,...
What Is BMW SmartView?
Your phone already does most of the heavy lifting when it comes to media, navigation, and apps. BMW SmartView is...
2026 Mazda CX-70 Invoice Pricing: Three Powertrains, a $3,000 Rebate, and 0.9% Financing
If you are shopping for a 2026 Mazda CX-70 and want to know what dealers are actually paying, what a...