
USA February 2025: Volvo (+40.1%), Genesis (+20.4%) excel in declining market
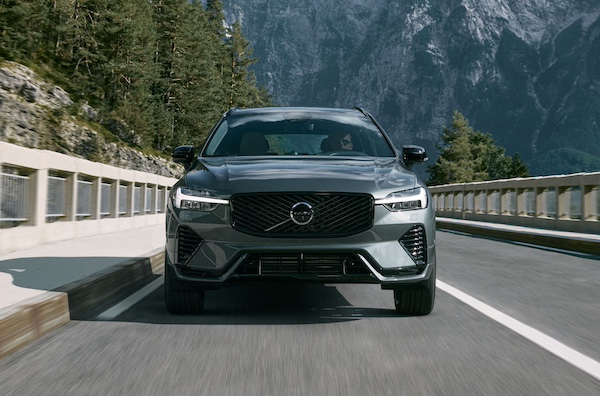
Volvo XC60 sales are up 62.2% in February.
New light vehicle sales in the USA endure their first year-on-year decline in 6 months in February at -2.3% to 1,221,863 units. The year-to-date cume is now up 0.5% to 2,334,300. The SAAR is estimated at 16.1 million units, up from 15.6 million in January. Light trucks are up 0.8% to 1,001,027 and passenger cars continue to fall at -14.1% to 220,836 units. According to J.D. Power, the average new vehicle retail transaction price is up $71 on last year to $44,619. Interestingly given their market domination, incentives on pickups, SUVs, crossovers and minivans grow year-on-year to $3,393 per vehicles, up $633 on a year ago. For cars, incentives are up $371 to $2,467.
Among OEMs still communicating monthly sales figures, Toyota Motor (-4.9%), Ford Motor (-8.8%) and American Honda (-2.8%) all lose ground whereas Hyundai-Kia improves 5.5%. Brand-wise, Ford (-8.2%) overtakes Toyota (-5.8%) but remains below year-to-date. Honda (-2.6%) follows the market. Volvo (+40.1%) is by far the best performer ahead of Genesis (+20.4%), with Kia (+7.2%), Subaru (+4.1%), Hyundai (+2.8%), Mazda (+2.5%) and Lexus (+0.6%) in tow.
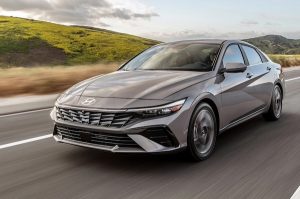
Model-wise, the Ford F-Series (+14.4%) excels but the Toyota RAV4 (-12.9%) and Honda CR-V (-4.9%) both struggle. It’s even worse for the Toyota Camry (-16.6%), just as the Honda Civic (-10.1%) is back above the Toyota Corolla (-17.1%). The Toyota Tacoma (+239.1%) continues to surge, with the Hyundai Elantra (+20.5%), Ford Bronco (+20.2%), Honda HR-V (+11.3%) and Subaru Outback (+11.4%) also strong.
Previous month: USA January 2025: Toyota Tacoma, Ford F-Series highlight market up 3.7%
One year ago: USA February 2024: Honda, Lincoln stand out in market up 6.3%
Full February 2025 figures for selected OEMs, brands and models below.
USA February 2025 – OEMs still communicating monthly data:
OEMFeb-25/242025/24Toyota Motor Corporation175,349– 4.9%338,934– 3.2%Ford Motor Co157,820– 8.8%299,796– 7.7%Hyundai-Kia130,881+ 5.5%247,243+ 9.0%American Honda107,011– 2.8%203,785+ 0.2%Subaru49,125+ 4.1%95,479+ 4.1%Mazda33,538+ 2.5%67,219+ 6.7%Volvo Cars11,097+ 40.1%19,233+ 9.9%
USA February 2025 – brands still communicating monthly sales:
BrandFeb-25/242025/24Ford151,066– 8.2%286,572– 7.4%Toyota150,019– 5.8%290,986– 3.8%Honda97,688– 2.6%185,771+ 0.5%Kia63,303+ 7.2%120,310+ 9.2%Hyundai62,032+ 2.8%116,535+ 8.0%Subaru49,125+ 4.1%95,479+ 4.1%Mazda33,538+ 2.5%67,219+ 6.7%Lexus25,330+ 0.6%47,948+ 0.5%Volvo11,097+ 40.1%19,233+ 9.9%Acura9,323– 4.6%18,014– 2.1%Lincoln6,754– 20.5%13,224– 14.6%Genesis5,546+ 20.4%10,398+ 17.2%
USA February 2025 – models (only from OEMs still communicating monthly data):
ModelFeb-25/242025/24Ford F-Series59,310+ 14.4%117,954+ 17.3%Toyota RAV437,643– 12.9%73,893– 7.0%Honda CR-V30,458– 4.9%57,738– 1.1%Toyota Camry21,640– 16.6%40,647– 15.3%Honda Civic18,178– 10.1%34,351– 6.3%Toyota Tacoma17,110+ 239.1%35,876+ 170.8%Toyota Corolla16,620– 17.1%33,961– 10.0%Hyundai Tucson16,317+ 2.0%31,342+ 15.6%Ford Explorer15,071– 23.2%28,576– 25.7%Subaru Forester14,347– 3.6%27,295– 0.7%Ford Escape13,958+ 5.5%23,860– 1.1%Ford Transit13,877+ 3.5%21,552– 21.9%Honda HR-V13,484+ 11.3%25,301+ 5.1%Kia Sportage13,072+ 8.2%24,429+ 10.7%Subaru Crosstrek12,818+ 2.1%25,443+ 6.6%Kia K4/Forte11,669+ 3.9%23,285+ 15.2%Subaru Outback11,601+ 11.4%22,395+ 3.1%Mazda CX-510,876+ 5.0%21,609+ 5.1%Toyota Tundra10,781– 4.1%21,145+ 1.3%Ford Maverick10,277– 22.5%19,007– 26.1%Honda Pilot10,204+ 5.4%19,053+ 9.7%Hyundai Elantra10,163+ 20.5%19,029+ 24.1%Ford Bronco Sport10,030– 6.3%19,402– 5.5%Ford Bronco9,837+ 20.2%18,893+ 21.0%Kia Telluride9,599+ 12.8%18,370+ 19.1%Hyundai Santa Fe9,562+ 3.5%17,858+ 17.0%Toyota Grand Highlander9,175+ 8.2%14,760– 2.0%Honda Accord 8,906– 36.9%18,571– 29.0%Toyota Sienna8,080+ 41.0%14,528+ 33.7%Hyundai Palisade7,806– 0.3%14,493– 6.3%Lexus RX7,743– 12.6%14,264– 10.1%Kia Sorento7,699+ 3.7%14,570+ 8.4%Mazda CX-507,280+ 32.8%13,615+ 21.4%Toyota Corolla Cross6,874+ 21.2%13,241+ 17.7%Honda Odyssey6,774+ 21.2%11,820+ 16.5%Mazda CX-305,709– 43.1%12,366– 30.5%Hyundai Kona5,629– 19.9%9,994– 26.5%Lexus NX5,342+ 0.5%10,915+ 5.0%Hyundai Sonata5,334+ 21.8%10,091+ 34.5%Kia K54,991+ 117.9%9,348+ 67.6%Mazda CX-904,769+ 43.6%10,114+ 52.5%Toyota Land Cruiser4,677n/a9,556n/aToyota Prius4,511– 0.4%9,395+ 1.7%Ford Ranger4,448n/a8,950+ 2853.8%Kia Carnival4,440+ 44.4%8,105+ 33.2%Ford Expedition4,389– 47.6%9,009– 34.9%Volvo XC604,123+ 62.2%7,150+ 30.0%Kia Soul4,006+ 2.8%7,560+ 5.5%Toyota Highlander3,822– 63.6%6,494– 68.3%Kia Seltos3,707– 22.2%6,547– 25.3%Lexus TX3,533+ 4.0%5,461– 13.4%Honda Passport3,497+ 34.7%6,140+ 28.1%Acura MDX3,463– 5.1%6,429– 4.9%Subaru Ascent3,382– 10.8%6,495– 13.5%Ford Mustang Mach-E3,312+ 13.0%6,841+ 61.9%Honda Ridgeline3,254– 18.2%6,120– 16.5%Ford E-Series2,968– 16.2%5,907– 10.8%Honda Prologue2,933new6,677newLexus ES2,905+ 13.5%5,178+ 10.8%Mazda32,838– 7.3%5,821– 2.1%Ford Mustang2,792– 32.2%5,191– 34.2%Volvo XC902,682+ 8.7%5,198– 4.5%Volvo XC402,564+ 57.6%3,765+ 1.1%Acura RDX2,561– 20.3%5,155– 14.0%Toyota Crown Signia2,537new5,102newLincoln Nautilus2,482– 26.9%4,907– 9.6%Hyundai Ioniq 52,442+ 22.3%4,692+ 35.6%Subaru Impreza2,429+ 3.7%4,858+ 5.4%Genesis GV702,289+ 20.1%4,310+ 23.5%Lexus GX2,136+ 58.3%5,317+ 62.4%Hyundai Santa Cruz1,938– 24.5%3,724– 26.3%Lincoln Corsair1,921– 3.2%3,604– 10.8%Genesis GV801,840+ 29.6%3,444+ 37.9%Toyota Sequoia1,830– 7.4%3,211– 13.3%Hyundai Venue1,829– 6.6%3,429+ 1.0%Subaru WRX1,715+ 22.9%3,288+ 28.1%Toyota bZ4X1,690+ 203.4%3,932+ 267.5%Subaru Legacy1,664+ 33.3%3,260+ 19.0%Acura ZDX1,494new2,878newKia Niro1,485– 40.9%2,687– 41.2%Acura Integra1,367– 34.2%2,760– 30.0%Lexus IS1,365– 10.7%2,640– 5.0%Kia EV91,360+ 3.2%2,592– 4.9%Lincoln Aviator1,357– 29.5%2,791– 26.3%Toyota 4Runner1,295– 88.2%1,455– 93.1%Kia EV61,275– 2.6%2,817+ 11.7%Mazda CX-701,223+ 7543.8%2,170+ 13462.5%Hyundai Ioniq 61,012+ 12.2%1,883+ 13.3%Lincoln Navigator994– 16.7%1,922– 13.8%Subaru Solterra925+ 187.3%1,977+ 182.0%Volvo S60/V60867– 18.0%1,232– 41.2%Mazda MX-5 Miata843+ 93.3%1,524+ 84.7%Toyota GR86843+ 315.3%1,631+ 140.9%Ford Edge797– 94.0%1,430– 93.1%Lexus UX784– 1.1%1,537+ 0.9%Genesis G70728+ 6.1%1,370– 18.1%Toyota Crown611– 76.0%1,250– 73.5%Lexus LX595+ 13.8%971– 14.7%Lexus RZ486+ 38.1%749+ 0.5%Acura TLX438– 46.9%792– 53.6%Genesis G80343– 0.9%620+ 3.7%Volvo EX90278new695newVolvo EX30269new657newSubaru BRZ244+ 0.4%468– 5.1%Genesis GV60224+ 52.4%413+ 31.9%Volvo S90/V90205+ 69.4%333+ 19.4%Lexus LC185+ 31.2%370+ 27.6%Lexus LS137– 38.8%280– 35.8%Toyota Supra132+ 9.1%242– 14.2%Toyota Venza131– 94.6%633– 86.3%Genesis G90122+ 22.0%241– 20.2%Lexus RC119– 19.6%266+ 0.4%Volvo C40109+ 3.8%203– 65.9%Toyota Mirai16– 71.9%33– 67.3%Toyota Avalon1– 75.0%1– 80.0%
Source: Manufacturers

More Stories
Ferrari Denies Claims That Buyers Must Order the Luce EV to Get Higher Models
Ferrari’s first fully electric vehicle, the Luce, has already become one of the most talked-about cars to come out of...
China new models May 2026: Audi E7X and Onvo L80 appear
Onvo L80 Now that May 2026 has been studied, let’s focus on the latest launches on the Chinese market. Once...
World Full Year 2025: Discover the Top 500 best-selling models (BSCB Exclusive)
This content is for members only. Visit the site and log in/register to read.
McLaren Marks a Historic Milestone with a Special Artura
McLaren Automotive has revealed a striking new limited-edition model: the McLaren Artura 1000GP by MSO. Created to celebrate McLaren Racing’s...
The ROI Equation, Fleet Longevity and Truck Parts Quality
The math of fleet management has changed. For years, deciding to replace an aging tractor was mainly about mileage, age,...
Electric Rides That Make Weekend Camping and Local Exploring Easier
Outdoor travel does not need to be far away When people think about outdoor travel, they often imagine long road...