
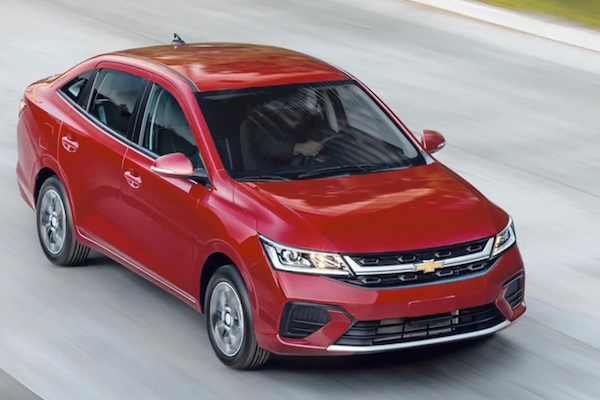
Mexico March 2026: Geely in Top 10, Chevrolet Aveo topples Nissan Versa
The Chevrolet Aveo is the best-selling vehicle in Mexico in March.
New vehicle sales in Mexico edge up 2.4% year-on-year in March (on revised year-ago volume) to 131,569 units. This is the 2nd biggest March volume below the 137,021 units of March 2017. Q1 results are up 3.7% to 381,653 which is a new record, eclipsing the previous best of 378,275 in Q1 2017. Nissan (-6.2%) keeps the lead despite a year-on-year fall, which Chevrolet (+0.5%) is stable at #2. Volkswagen (+3.8%) repeats at #3 ahead of Toyota (-7%) and Kia (+4.6%). The best scores are below: Geely is up 321.5% to break into the Mexican Top 10 for the first time at #9, Ram gains 35.2%, MG is up 28.4% and Hyundai up 10.6%. Further down, Cupra (+185.2%), Peugeot (+56.5%) and Changan (+51.3%) stand out.
Over in the models ranking, the Chevrolet Aveo (+9.2%) topples the traditional leader, the Nissan Versa (-20.8%) in great difficulty. This is the first time since February 2022 that the Aveo leads the Mexican charts and the first time since April 2023 that the Versa isn’t the best-seller. The Kia K3 (+3.8%) stays in third place above the Nissan NP300 (-20.6%) and a surging Hyundai Grand i10 (+89.8%). The Nissan Magnite (+749.8%) and Ram 1200 (+144.1%) post surreal gains with the MG 5 (+15.6%) also strong and the Nissan Kicks (+3.7%) down just one spot on a record 5th place reached last month.
Previous month: Mexico February 2026: Nissan Kicks and Ram 1200 hit record rankings
One year ago: Chevrolet Aveo (+40.2%), Nissan Pickup (+23.3%) shine in best March volume in 8 years
Full March 2026 Top 54 All brands and Top 384 All models below.
Mexico March 2026 – brands:
PosBrandMar-26%/25Feb2026%/25PosFY251Nissan22,17116.9%– 6.2%167,13017.6%+ 2.7%112Chevrolet16,86012.8%+ 0.5%247,13212.3%+ 3.0%223Volkswagen11,4208.7%+ 3.8%333,4778.8%– 1.5%334Toyota10,1297.7%– 7.0%629,9147.8%– 0.6%445Kia9,2037.0%+ 4.6%427,4377.2%+ 4.3%556Mazda7,5075.7%– 17.0%524,5326.4%– 6.3%667MG5,1413.9%+ 28.4%1214,4513.8%+ 30.1%798Hyundai 4,7303.6%+ 10.6%1012,2203.2%– 1.2%1079Geely4,2193.2%+ 321.5%1110,7822.8%+ 283.8%121610Ram4,2153.2%+ 35.2%713,2683.5%+ 55.9%81211Ford4,1303.1%+ 2.2%812,3903.2%+ 1.8%9812Honda3,6632.8%– 3.1%911,0922.9%+ 5.6%111013Mitsubishi3,6012.7%+ 37.4%148,2522.2%+ 22.4%141414Suzuki2,9212.2%– 14.5%139,1892.4%– 11.9%131115Renault2,5651.9%+ 5.9%157,6172.0%– 2.8%151316Peugeot2,0771.6%+ 56.5%165,0951.3%+ 14.4%181817JAC2,0351.5%+ 1.2%175,7601.5%– 5.0%161518Changan1,9191.5%+ 51.3%185,1041.3%+ 62.5%171719BMW1,1750.9%– 9.3%213,3480.9%– 8.6%212220GWM1,1580.9%– 13.5%203,4990.9%– 10.8%202121Jeep1,1080.8%– 6.7%223,0990.8%– 19.5%222022Seat1,0970.8%– 27.8%194,0351.1%– 14.9%191923Dodge1,0330.8%+ 31.8%232,6280.7%+ 1.0%232324Mercedes8220.6%– 39.1%262,1670.6%– 36.0%252425Audi8160.6%+ 0.4%242,1840.6%+ 5.7%242626Cupra7300.6%+ 185.2%271,7720.5%+ 137.2%272927GMC6640.5%– 4.3%252,0770.5%– 3.4%262528Fiat 4460.3%– 7.3%339920.3%– 38.2%312829Subaru4020.3%+ 16.2%301,0810.3%+ 18.8%293030Jetour3850.3%+ 466.2%281,2290.3%+ 369.1%283831Volvo3710.3%– 27.8%291,0410.3%– 34.1%302732Mini2980.2%– 14.6%328290.2%– 10.6%333133Porsche2920.2%+ 14.5%318370.2%+ 1.7%323434Isuzu2740.2%+ 110.8%376050.2%+ 43.4%363635Lexus2240.2%– 11.5%346860.2%+ 11.7%343536Foton2210.2%– 0.9%453190.1%– 58.1%433737Land Rover2030.2%+ 2.0%395470.1%– 0.2%374038Lynk & Co2030.2%new414580.1%new39 –39Buick1970.1%– 44.4%356550.2%– 26.2%353240Zeekr1730.1%new365100.1%new38 –41Lincoln1440.1%– 16.3%384500.1%– 8.9%403942Infiniti1330.1%+ 29.1%423540.1%+ 18.4%424343Cadillac1300.1%– 29.7%404070.1%– 23.9%414144Soueast800.1%new471460.0%new464845Deepal730.1%+ 143.3%432380.1%+ 201.3%444746Acura700.1%– 29.3%442040.1%– 12.4%454647JMC570.0%– 25.0%481220.0%– 44.8%474548Alfa Romeo470.0%+ 176.5%50840.0%+ 31.3%495049BAIC200.0%– 70.6%46870.0%– 28.7%484450IM110.0%new51530.0%new505151Bentley20.0%n/a5350.0%n/a545552DFSK20.0%– 95.0%49400.0%– 51.8%514953Auteco10.0%+ 0.0% –130.0%+ 85.7%525354Seres10.0%– 66.7%52100.0%+ 42.9%5354
Mexico March 2026 – models:
PosModelMar-26%/25Feb2026%/25PosFY251Chevrolet Aveo6,6435.0%+ 9.2%217,8514.7%+ 15.6%222Nissan Versa6,3294.8%– 20.8%121,2495.6%– 12.3%113Kia K34,7103.6%+ 3.8%313,9963.7%+ 6.6%344Nissan Pickup (NP300)4,5673.5%– 20.6%412,3533.2%– 18.2%435Hyundai Grand i103,3102.5%+ 89.8%166,7441.8%+ 30.3%8106Nissan Kicks2,6822.0%+ 3.7%56,7171.8%– 2.8%987MG 52,5531.9%+ 15.6%357,5482.0%+ 59.6%5148Nissan Magnite2,4391.9%+ 749.8%86,8981.8%+ 2303.5%7209Ram 12002,2651.7%+ 144.1%67,0881.9%+ 143.8%63710Mazda CX-302,2491.7%– 1.8%145,6281.5%– 14.8%14611Nissan March2,2281.7%– 26.7%176,5211.7%– 21.9%11512Chevrolet S101,9941.5%+ 30.5%135,2441.4%+ 25.6%161513Chevrolet Groove1,8621.4%+ 22.0%264,7981.3%+ 11.8%202314VW Virtus1,7701.3%– 1.0%105,9041.5%– 12.4%13915VW Tiguan1,6861.3%+ 3.1%184,8991.3%+ 19.8%181916VW Taos1,6631.3%– 3.9%204,9011.3%– 4.1%171317Mazda21,6351.2%– 31.2%76,1171.6%– 9.3%12718Mazda CX-51,5701.2%+ 67.7%244,4461.2%+ 42.0%243119Chevrolet Onix1,5621.2%+ 22.4%124,2801.1%+ 17.6%264120Renault Kwid1,5241.2%+ 24.0%294,4901.2%+ 13.9%222221Toyota Hilux1,4991.1%– 5.1%274,5691.2%– 6.2%211822Nissan X-Trail1,4751.1%+ 17.9%303,9851.0%+ 26.8%292623VW Jetta1,4401.1%– 31.1%254,0471.1%– 27.7%281624Ram 7001,3971.1%+ 4.6%154,8201.3%+ 29.8%192425VW Saveiro1,3581.0%+ 5.4%383,4360.9%– 7.5%362926Kia Seltos1,3401.0%+ 28.1%214,2841.1%+ 21.3%252727VW Tera1,3391.0%new283,7791.0%new329128Mitsubishi L2001,3241.0%+ 16.1%423,0800.8%+ 4.9%403829Nissan Sentra1,3111.0%– 25.3%116,6391.7%+ 33.2%101130Ford Territory1,3011.0%+ 45.5%233,8921.0%+ 31.7%313231Geely Emgrand1,2921.0%+ 239.1%224,4641.2%+ 339.8%233932Chevrolet Captiva1,2911.0%– 21.3%194,2601.1%– 9.6%272533Suzuki Swift1,2511.0%+ 27.4%373,7691.0%+ 26.0%333634Toyota Avanza1,2030.9%+ 59.5%413,7461.0%+ 42.8%344035Kia Sonet1,1220.9%+ 6.9%363,3020.9%+ 5.5%383436Geely EX51,1110.8%new772,1520.6%new5413337Chevrolet Tornado Van1,0780.8%– 29.8%343,4210.9%– 16.6%372138Kia K41,0500.8%– 24.5%313,2560.9%– 18.1%393039Nissan Urvan1,0280.8%+ 43.2%472,4900.7%+ 49.8%485040Honda City1,0240.8%+ 163.9%482,9620.8%+ 174.0%436841Honda CR-V1,0110.8%– 15.8%453,0430.8%– 0.7%414242Geely EX29870.8%new631,4840.4%new66 –43Ford F-Series/Lobo9360.7%– 4.6%323,0230.8%+ 3.8%423344Toyota Yaris9290.7%+ 39.7%393,9601.0%+ 56.8%303545Toyota Corolla9260.7%+ 6.2%492,6240.7%+ 5.6%454646VW Taigun9240.7%+ 26.4%402,8030.7%– 6.5%444447Mazda39220.7%– 57.6%95,3221.4%– 8.8%151748Dodge Nuevo Attitude8960.7%+ 87.8%572,2110.6%+ 42.8%515849MG 38830.7%+ 0.3%442,1010.6%– 31.1%554850Toyota Tacoma8760.7%– 12.4%462,6230.7%+ 18.6%464351Toyota Corolla Cross8620.7%+ 9.8%741,6520.4%– 3.4%636052MG ZS8360.6%+ 324.4%541,8600.5%+ 90.0%5911953Mitsubishi Outlander Sport8340.6%+ 30.3%641,8690.5%+ 23.6%585654Hyundai Creta8210.6%– 52.3%333,6150.9%– 19.1%351255JAC Frison7910.6%– 3.2%502,3440.6%– 0.9%494956Toyota Raize7600.6%+ 25.2%722,0430.5%+ 39.7%565257GWM Haval Jolion7380.6%+ 20.0%512,2410.6%+ 26.0%505958Honda HR-V7170.5%– 24.7%532,1550.6%– 23.7%534559Kia Sportage7150.5%+ 52.1%611,9980.5%+ 32.8%575760Toyota RAV47150.5%– 64.6%3207270.2%– 85.8%992861Toyota Sienna6900.5%– 20.5%522,1600.6%– 0.6%525462Ford Ranger6560.5%+ 12.3%601,7290.5%– 12.9%606163Mitsubishi Xpander6120.5%+ 24.9%591,6620.4%+ 41.2%627364Seat Ibiza5970.5%– 23.9%432,5450.7%+ 0.2%474765Peugeot Partner5380.4%+ 60.6%671,2250.3%+ 6.7%737766Peugeot Rifter5340.4%+ 98.5%1917900.2%+ 27.6%948367Mazda CX-35310.4%– 6.5%751,2570.3%– 25.0%725568Suzuki Jimny5270.4%– 27.3%551,7200.5%– 12.4%615369Chevrolet Silverado/Cheyenne5200.4%– 32.6%621,6130.4%– 46.8%645170Chevrolet Trax5100.4%+ 8.3%661,4580.4%+ 14.4%676371Mitsubishi Mirage G45080.4%+ 108.2%948430.2%+ 6.2%8912872Toyota Highlander4880.4%– 15.1%711,3540.4%– 31.1%696473Geely Coolray4840.4%+ 160.2%581,3430.4%+ 129.2%709474Peugeot Partner Rapid4530.3%+ 66.5%561,4060.4%+ 50.4%689275Chevrolet Spark EUV4420.3%new909290.2%new8117976Toyota Camry4420.3%+ 262.3%691,2210.3%+ 82.5%748277Ram 1500-40004400.3%+ 64.8%701,0850.3%– 3.6%777678VW Teramont4270.3%– 11.2%651,3260.3%– 14.3%717079Toyota Prius4090.3%– 44.4%681,5030.4%+ 29.8%657180Cupra Terramar4050.3%new998430.2%new8815181Fiat Pulse3670.3%+ 112.1%1416950.2%+ 13.2%10210282Changan CS55 Plus3480.3%+ 228.3%878610.2%+ 181.4%879883Honda BR-V3470.3%– 24.6%791,1710.3%– 18.8%756684MG HS/eHS3420.3%+ 15.2%1628300.2%+ 14.2%9014085Cupra Formentor3250.2%+ 27.0%819290.2%+ 24.4%829686Hyundai Tucson3170.2%– 22.5%761,0270.3%– 23.1%797287Changan Alsvin3150.2%– 26.6%898910.2%+ 4.7%858488Suzuki Ertiga3150.2%– 38.5%801,0820.3%– 19.3%786989Seat Leon3140.2%+ 6.8%829410.2%+ 3.3%808990Mitsubishi Outlander3130.2%+ 219.4%887660.2%+ 173.6%9520191Suzuki Fronx2870.2%+ 12.5%859260.2%+ 37.4%837892Changan CS35 Plus2840.2%+ 14.1%1016790.2%+ 14.3%1039993Jeep Compass2830.2%+ 32.2%987490.2%– 8.4%978694Isuzu Elf2740.2%+ 110.8%1106050.2%+ 43.4%11011795JAC Sunray2740.2%+ 8.3%1336310.2%+ 11.5%10713596Audi Q32730.2%+ 24.1%1115510.1%+ 7.2%11914197Renault Kardian2730.2%+ 66.5%926260.2%– 1.1%10812998Suzuki Baleno2710.2%+ 79.5%738870.2%+ 113.2%8613799Changan Eado Plus2680.2%new1027310.2%new98152100Suzuki Dzire2670.2%new847960.2%new93168101Ford Maverick2650.2%– 10.2%977080.2%– 26.9%101103102JAC 82590.2%+ 119.5%937630.2%+ 74.2%96104103Ford Edge2560.2%n/a1065810.2%n/a114277104GWM Poer2370.2%– 36.5%1196590.2%– 40.4%10480105BMW X32360.2%+ 129.1%1046310.2%+ 88.9%106115106Peugeot 20082290.2%– 6.9%1175900.2%– 37.1%11285107Honda Civic2220.2%– 50.1%788980.2%– 23.4%8481108Jeep Renegade2210.2%– 10.5%957260.2%– 7.6%10095109Jeep Wrangler2150.2%– 5.7%1165060.1%– 30.6%124100110Ford Transit2080.2%– 61.8%868000.2%– 23.7%9174111Changan New Star Truck2020.2%+ 31.2%1006140.2%+ 29.8%109127112Honda Pilot1990.2%+ 4.7%1564610.1%+ 8.5%135156113GMC Sierra1970.1%– 10.9%1205470.1%– 25.5%12093114Audi Q51920.1%+ 41.2%1435270.1%+ 50.6%122148115Ford Bronco Sport1860.1%– 15.8%1305000.1%– 26.0%125123116Hyundai HB201860.1%– 34.7%1324670.1%– 48.6%133108117Mazda BT-501840.1%+ 308.9%915630.1%+ 155.9%117180118GMC Terrain1820.1%+ 180.0%1075910.2%+ 163.8%111144119Renault Arkana1820.1%– 3.7%966470.2%+ 2.9%105120120Jetour T21800.1%+ 847.4%1055330.1%+ 2565.0%121177121Renault Oroch1720.1%– 27.1%1085570.1%– 12.4%118111122Mazda CX-501680.1%– 45.3%1444490.1%– 42.9%138106123Subaru Forester1670.1%+ 108.8%1634440.1%+ 58.6%140146124Chevrolet Montana1660.1%– 48.8%1095790.2%– 35.6%11587125Geely Cityray1660.1%+ 12.2%1135850.2%+ 47.0%113150126Mercedes Sprinter1660.1%– 33.1%1783690.1%– 41.8%157113127BMW X11640.1%– 50.5%1354450.1%– 51.7%139126128JAC 41630.1%– 29.4%1504770.1%– 39.2%128110129Jeep Grand Cherokee1580.1%– 1.3%1264540.1%– 16.7%136125130Subaru Crosstrek1570.1%– 21.5%1744200.1%– 8.5%146145131Volvo EX301560.1%– 39.5%1124630.1%– 40.4%13497132Mazda CX-901550.1%– 10.4%1374740.1%– 33.1%129101133Changan CS751540.1%new1423580.1%new159218134Renault Nueva Koleos1540.1%new1534040.1%new152172135Mercedes GLE1530.1%– 27.5%1294690.1%– 18.9%131153136Mercedes GLC1520.1%– 46.5%1344310.1%– 45.9%142131137Renault Kangoo1520.1%– 6.2%1274810.1%– 4.2%127147138Changan Hunter1470.1%+ 63.3%1554190.1%+ 75.3%147157139MG 3 HEV1470.1%+ 8.9%1823090.1%+ 5.8%170224140BMW X51430.1%+ 10.9%1603970.1%+ 15.7%154160141JAC 21420.1%– 41.6%1664090.1%– 47.5%150109142Chevrolet Colorado1410.1%– 9.6%1234940.1%+ 14.9%126136143Seat Arona1410.1%– 47.6%1184310.1%– 45.6%143118144VW Polo1410.1%– 68.4%1544690.1%– 74.6%13267145VW Nivus1400.1%– 66.5%1394210.1%– 53.3%145121146GWM Haval H61380.1%– 42.3%1594080.1%– 42.6%151105147Lynk & Co 081380.1%new1733460.1%new162 –148Chevrolet Tahoe1350.1%– 11.2%1155060.1%+ 1.2%123139149Chevrolet Tracker1350.1%– 81.7%1364230.1%– 73.3%14462150Audi A31340.1%– 21.6%1384140.1%– 8.2%149143151VW Crafter1330.1%+ 241.0%1463650.1%+ 78.0%158107152VW Transporter1280.1%+ 58.0%1284040.1%+ 51.9%153155153Dodge Durango1270.1%+ 74.0%1223520.1%+ 90.3%160265154Kia Niro1270.1%+ 64.9%2052050.1%– 16.7%202194155Toyota 4Runner1250.1%new837980.2%new92165156Chevrolet Suburban1240.1%– 53.6%1214690.1%– 40.0%130112157Jeep Gladiator1240.1%+ 4.2%1473360.1%+ 4.0%165162158Changan Honor S1210.1%– 19.9%1684530.1%– 8.1%137134159Foton Tunland1210.1%+ 13.1% –1490.0%– 51.6%215205160Kia Sorento1160.1%– 23.7%1613410.1%– 37.9%163154161Jetour T11150.1%new1753080.1%new171274162BMW 2 Series1140.1%+ 9.6%1583690.1%+ 38.7%156163163GMC Canyon1130.1%– 36.5%1494150.1%+ 8.6%148159164Ram ProMaster1090.1%+ 263.3%3461150.0%– 12.2%237296165Ford Explorer1060.1%– 56.4%1514410.1%– 21.9%14188166Porsche 9111050.1%+ 69.4%1483710.1%+ 118.2%155206167Mini Cooper1040.1%– 50.2%1872760.1%– 44.5%177122168MG RX91030.1%+ 123.9%2332200.1%+ 103.7%196291169Peugeot Expert1010.1%+ 1583.3%1313350.1%+ 520.4%166216170Chevrolet Traverse1000.1%– 40.1%1812770.1%– 34.0%176161171MG RX5990.1%+ 62.3%1031,1090.3%+ 190.3%7679172Zeekr 7X980.1%new1573190.1%new168 –173MG 7970.1%+ 273.1%2672090.1%+ 88.3%198279174Geely Monjaro950.1%new1653520.1%new161204175Volvo XC60950.1%– 7.8%1962570.1%– 20.9%184174176VW Golf/GTI950.1%+ 55.7%1722930.1%– 2.0%174166177BMW X2940.1%– 9.6%1802590.1%– 9.8%182181178JAC X350940.1%– 3.1%1882720.1%– 6.2%178176179Peugeot 3008940.1%+ 13.3%1523000.1%– 9.9%173171180Toyota Hiace940.1%– 50.5%1145640.1%– 14.5%116116181Porsche Macan930.1%+ 36.8%2152050.1%+ 24.2%203213182VW Caddy900.1%+ 3.4%1982070.1%– 28.6%200164183Honda Odyssey890.1%– 10.1%1402610.1%– 16.3%180167184Mini Countryman890.1%– 9.2%1712920.1%– 6.7%175185185Buick Envista850.1%– 44.1%1673220.1%– 24.6%167130186Ford Bronco850.1%– 13.3%1792680.1%+ 18.6%179188187JAC 6830.1%+ 260.9%1942590.1%+ 208.3%183235188Porsche Cayenne820.1%– 11.8%1902220.1%– 32.9%193191189Lexus NX810.1%+ 17.4%1702310.1%+ 6.9%190189190BMW 3 Series800.1%+ 77.8%1642600.1%+ 50.3%181207191Infiniti QX60790.1%+ 97.5%2001810.0%+ 44.8%209257192VW Amarok780.1%– 40.0%2012020.1%– 43.4%204138193Fiat Fastback770.1%– 20.6%1772450.1%– 12.8%186190194Jetour Dashing770.1%+ 102.6%1453370.1%+ 161.2%164280195MG 4760.1%+ 204.0%2761940.1%+ 177.1%207281196Lincoln Nautilus750.1%– 27.9%1952060.1%– 35.6%201187197Deepal S07730.1%+ 143.3%1842380.1%+ 201.3%188223198Peugeot Manager730.1%– 36.0%1253160.1%– 19.0%169173199Changan UNI-K720.1%– 19.1%2191830.0%– 0.5%208214200JAC Sunray City700.1%new1972300.1%new191306201Lexus RX690.1%+ 130.0%1991980.1%+ 67.8%206233202BMW X6680.1%– 25.3%1762560.1%– 16.1%185170203Ford Expedition680.1%+ 0.0%1852010.1%+ 10.4%205197204Audi A5660.1%+ 50.0%1692420.1%+ 106.8%187200205Range Rover Sport650.0%– 33.0%2571420.0%– 34.6%219212206Land Rover Defender630.0%+ 40.0%1892200.1%+ 54.9%195244207Mercedes CLA630.0%– 13.7%2321390.0%– 12.0%221250208Mercedes GLB630.0%– 22.2%2241370.0%– 2.1%223239209Chevrolet Express/Max620.0%+ 44.2%1243050.1%+ 228.0%172186210Mazda MX-5600.0%+ 66.7%2131760.0%– 4.9%210175211Soueast S06590.0%new277920.0%new255320212Nissan Pathfinder580.0%– 37.6%2021260.0%– 38.5%229221213Hyundai Elantra560.0%+ 80.6%2281300.0%+ 18.2%227238214Jeep Commander560.0%– 71.3%2102210.1%– 63.1%194124215Lincoln Navigator560.0%+ 211.1%2111380.0%+ 170.6%222256216GMC Acadia550.0%– 47.1%1862220.1%– 33.3%192184217Mini E550.0%+ 139.1%2201430.0%+ 138.3%217286218Toyota Tundra540.0%– 34.9%2071710.0%– 27.8%211211219Cadillac Escalade ESV530.0%– 29.3%1931520.0%– 28.0%214226220Volvo XC40520.0%– 35.8%2181290.0%– 46.9%228228221Peugeot 5008510.0%n/a2531050.0%n/a243322222Renault Duster510.0%– 73.0%1922090.1%– 41.3%199142223Mini Aceman500.0%+ 177.8%2291180.0%+ 110.7%234284224JMC Grand Avenue490.0%+ 40.0%328730.0%– 46.3%266271225BMW 1 Series480.0%– 44.2%2651000.0%– 50.2%245208226JAC Sei2480.0%+ 4.3%2361050.0%– 48.0%242258227Nissan Frontier480.0%– 63.6%2061370.0%– 69.8%224169228Subaru Outback480.0%+ 140.0%225950.0%+ 69.6%253351229Zeekr X470.0%new2211080.0%new241 –230Foton S3450.0%– 8.2%255730.0%+ 25.9%265298231Geely Starray450.0%– 74.0%2092370.1%– 47.9%189178232GMC Yukon450.0%– 11.8%2171340.0%– 37.1%225217233Renault Master450.0%+ 221.4%1831690.0%+ 134.7%212227234Seat Ateca450.0%– 73.7%2381180.0%– 76.2%235182235Acura ADX440.0%+ 37.5%244980.0%+ 206.3%248329236GMC Yukon XL440.0%– 27.9%2351230.0%– 40.3%230222237Buick Enclave430.0%– 40.3%2031410.0%+ 7.6%220229238Ford Mustang430.0%– 25.9%2042150.1%+ 20.1%197203239Buick Encore420.0%– 23.6%2341090.0%– 19.9%239253240Mercedes G-Class410.0%– 12.8%256950.0%– 26.4%252272241Audi Q2400.0%– 33.3%2221080.0%– 20.6%240232242Chevrolet Equinox EV400.0%+ 233.3%270770.0%+ 42.6%262311243BMW iX2390.0%+ 56.0%280780.0%+ 50.0%261294244BMW 4 Series380.0%– 34.5%2081420.0%– 26.4%218215245Mercedes GLA380.0%– 9.5%2521030.0%+ 0.0%244249246Volvo XC90380.0%+ 22.6%2301210.0%+ 19.8%232241247Alfa Romeo Junior360.0%new –360.0%new305 –248Mercedes A-Class360.0%– 57.6%262850.0%– 57.9%256240249Geely GX3 Pro350.0%– 60.7%2401450.0%– 51.3%216195250Range Rover Evoque350.0%+ 6.1%237830.0%– 24.5%259270251Cadillac Escalade340.0%– 53.4%2261180.0%– 47.1%233220252Audi A1330.0%– 44.1%2121210.0%– 9.7%231225253JAC X200330.0%– 10.8%250990.0%– 22.0%247243254Lynk & Co 02330.0%new378340.0%new310 –255Mazda CX-70330.0%– 76.3%2511000.0%– 64.8%246245256Foton Hi-Van320.0%n/a –320.0%– 59.5%313347257JAC E10X320.0%+ 18.5%294540.0%– 33.3%279242258Toyota Sequoia310.0%– 6.1%2631150.0%+ 69.1%238237259Audi Q8290.0%– 39.6%223970.0%– 25.4%249247260Volvo C40290.0%– 17.1%279700.0%– 44.9%267285261Honda Accord280.0%– 41.7%2311150.0%– 35.8%236209262Mercedes C-Class280.0%– 42.9%243950.0%– 39.1%251262263Zeekr 001280.0%new248830.0%new260 –264Buick Envision270.0%– 64.0%254830.0%– 57.0%258234265GWM Tank 300270.0%– 55.7%241950.0%– 48.9%250198266Honda Prelude260.0%new –260.0%new326 –267Jeep Cherokee260.0%new242560.0%new277 –268BMW iX250.0%+ 56.3%246690.0%+ 40.8%268326269Jeep Wagoneer250.0%+ 0.0%307510.0%+ 0.0%286316270Mercedes GLS250.0%– 59.0%275600.0%– 50.4%272289271Hyundai Santa Fe240.0%– 66.7%2161310.0%– 56.2%226210272Infiniti QX50230.0%+ 155.6%259690.0%+ 155.6%269293273Lexus UX230.0%– 58.9%247520.0%– 53.6%284259274Lynk & Co 01230.0%new299460.0%new292 –275BMW Z4220.0%+ 633.3%288410.0%+ 192.9%297348276JAC Traveler220.0%new287580.0%new276330277Chevrolet Blazer210.0%– 56.3%272580.0%– 54.7%274252278BMW iX1200.0%– 31.0%258510.0%+ 18.6%285292279Lexus GX200.0%– 52.4%261930.0%+ 121.4%254305280Audi Q7190.0%– 40.6%300490.0%– 63.2%289254281Foton TM 3190.0%– 70.3%375200.0%– 85.1%338230282GMC Hummer EV SUV180.0%+ 80.0%341280.0%+ 0.0%320355283Infiniti QX80180.0%– 61.7%286460.0%– 52.1%291295284Audi Q6 e-Tron170.0%– 22.7%291370.0%+ 68.2%303334285BMW i4170.0%– 10.5%324260.0%– 38.1%324342286BMW X4170.0%– 78.2%282730.0%– 68.5%264196287Range Rover170.0%+ 325.0%283410.0%+ 115.8%299332288Subaru Impreza/WRX170.0%+ 6.3%278680.0%+ 19.3%270297289BMW X7160.0%– 55.6%249590.0%– 41.0%273266290Lexus IS160.0%+ 300.0% –160.0%– 15.8%350397291Mercedes CLE160.0%– 54.3%309380.0%– 55.8%302304292Mercedes E-Class160.0%– 72.9%266630.0%– 53.7%271287293Range Rover Velar160.0%– 11.1%284430.0%– 15.7%295341294Acura MDX150.0%– 67.4%331380.0%– 60.4%301307295Chevrolet Cavalier150.0%– 40.0%305350.0%– 78.9%307301296GWM Tank 500140.0%– 12.5%264530.0%+ 1.9%281290297Kia Telluride140.0%– 74.1%308370.0%– 76.0%304275298Toyota GR Corolla140.0%new338340.0%new311 –299BAIC X35130.0%– 13.3%271350.0%+ 34.6%306267300BMW 5 Series130.0%+ 85.7%298410.0%+ 13.9%296331301Cadillac Optiq130.0%+ 550.0%289410.0%+ 1950.0%298357302Ford Mustang Mach-E130.0%+ 116.7%327220.0%+ 83.3%334338303Infiniti QX55130.0%+ 85.7%290580.0%+ 13.7%275302304Subaru BRZ130.0%– 56.7%268540.0%– 6.9%280309305Audi A6110.0%+ 10.0%297310.0%+ 0.0%316337306Chevrolet Corvette110.0%+ 266.7%301350.0%+ 66.7%308349307IM LS7110.0%new306530.0%new282299308Soueast S07110.0%new304310.0%new317313309BMW i5100.0%– 9.1%325210.0%+ 10.5%336354310Cadillac XT4100.0%– 54.5%311280.0%– 54.1%319319311Dodge Journey100.0%– 95.0%293540.0%– 92.7%27865312GMC Hummer EV Pickup100.0%+ 150.0%340170.0%– 43.3%348358313Jetour X70100.0%+ 25.0%333350.0%– 46.2%309317314Lincoln Corsair100.0%– 76.2%214840.0%– 5.6%257261315Mitsubishi Montero Sport100.0%+ 25.0%296240.0%– 41.5%329327316Soueast S09100.0%new351230.0%new331361317Hyundai Ioniq 590.0%+ 200.0%274290.0%+ 107.1%318393318JAC E Frison T890.0%new –90.0%new369 –319JAC E30X90.0%– 50.0%312280.0%– 56.9%321325320Kia EV690.0%+ 0.0%354180.0%– 30.8%344353321Lexus LX90.0%– 57.1%295510.0%+ 34.2%287308322Lynk & Co 0990.0%new318320.0%new315 –323Renault Megane E-Tech90.0%new350150.0%new357394324Cadillac Escalade IQL80.0%new315250.0%new327 –325Changan CS9580.0%new316250.0%new328346326JMC Vigus80.0%– 80.5%260470.0%– 43.4%290273327VW ID.480.0%new313210.0%new337364328Ford E-Transit70.0%+ 75.0%353100.0%+ 11.1%366264329Hyundai Palisade70.0%– 50.0%227770.0%+ 54.0%263282330Land Rover Discovery Sport70.0%+ 250.0%334180.0%+ 100.0%345371331Mercedes SL-Class70.0%+ 133.3%336190.0%+ 111.1%342378332Porsche Taycan70.0%n/a345160.0%+ 0.0%351377333Toyota Supra70.0%+ 133.3%347230.0%+ 228.6%332386334Cadillac Escalade IQ60.0%new326260.0%new325 –335Lexus TX60.0%– 62.5%281330.0%– 5.7%312303336Mercedes S-Class60.0%– 40.0%335200.0%+ 66.7%340385337Nissan Z60.0%– 33.3%329150.0%+ 25.0%356395338Acura RDX50.0%– 66.7%269430.0%– 35.8%293300339BMW XM50.0%+ 66.7%332190.0%+ 35.7%341369340Cadillac Lyriq50.0%– 28.6%357100.0%– 52.4%363374341Chevrolet Blazer EV50.0%– 37.5%317170.0%– 29.2%347359342Porsche Panamera50.0%+ 66.7%303230.0%+ 27.8%330372343Toyota GR Yaris50.0%+ 150.0%319270.0%– 82.9%323278344Acura Integra40.0%– 20.0%310220.0%– 31.3%333360345Alfa Romeo Giulia40.0%+ 0.0%314150.0%+ 50.0%352379346Alfa Romeo Stelvio40.0%+ 33.3%321180.0%+ 125.0%343368347BAIC U540.0%– 90.9%239390.0%– 39.1%300288348BMW 7 Series40.0%n/a34890.0%– 25.0%368384349Foton View40.0%+ 33.3%359110.0%– 93.0%360260350Geely Okavango40.0%– 83.3%339200.0%– 79.6%339315351GWM Ora 0340.0%– 88.2%285430.0%– 53.3%294276352MG Cyberster40.0%new349130.0%new358365353Peugeot E-Partner40.0%n/a344270.0%+ 1250.0%322268354Ram DS40.0%– 99.3%3691600.0%– 74.8%213149355Alfa Romeo Tonale30.0%– 70.0%322150.0%– 67.4%353314356Chevrolet Brightdrop30.0%n/a –30.0%+ 200.0%387421357JAC J730.0%– 95.7%36080.0%– 95.0%371283358Jetour X70 Plus30.0%+ 0.0% –160.0%– 67.3%349345359Lincoln Aviator30.0%– 62.5%343220.0%– 35.3%335318360Mercedes AMG GT30.0%+ 50.0%355120.0%+ 300.0%359396361Mercedes EQE SUV30.0%– 88.0%36570.0%– 82.5%376340362Renault Koleos30.0%– 91.9%330180.0%– 91.0%346248363Acura TLX20.0%+ 100.0% –30.0%– 50.0%384399364Audi A420.0%– 75.0%37050.0%– 82.1%381366365BAIC BJ4020.0%– 33.3%37230.0%– 25.0%385407366BMW iX320.0%– 75.0% –20.0%– 86.7%389387367DFSK E520.0%– 83.3%302150.0%– 44.4%355328368Fiat Argo20.0%– 98.0%273520.0%– 86.1%283192369JAC Sei4 Pro20.0%– 71.4%342110.0%– 80.4%361339370Mercedes EQB20.0%– 33.3%36450.0%– 16.7%382376371Mercedes EQS SUV20.0%– 83.3%36670.0%– 69.6%377381372Suzuki Ignis20.0%– 99.6%38260.0%– 99.7%38090373Auteco E-Van S1.0 T PRO10.0%+ 0.0% –10.0%– 66.7%394408374BAIC X5510.0%– 75.0%32390.0%– 50.0%367312375Bentley Continental GT10.0%n/a35630.0%n/a386416376Bentley Flying Spur10.0%n/a –10.0%n/a397437377Cadillac XT510.0%– 83.3%35270.0%– 58.8%375367378JAC Sei6 Pro10.0%– 75.0% –10.0%– 91.7%400398379Mercedes EQS10.0%– 85.7% –10.0%– 87.5%402404380Mercedes Vito10.0%– 85.7%36760.0%– 83.8%379344381MG RX810.0%– 95.5%368500.0%– 54.5%288263382Seres 5 Max10.0%– 50.0%33790.0%+ 50.0%370406383Suzuki S-Cross10.0%– 97.7% –10.0%– 99.6%408255384Volvo EX9010.0%– 83.3% –10.0%– 83.3%409363
Source: INEGI

More Stories
Hong Kong (China) Full Year 2025: BYD and Sealion 7 take charge
This content is for members only. Visit the site and log in/register to read.
2027 Toyota Tundra Trailhunter Brings Factory Off-Road Upgrades to the SR5
Toyota is giving the 2027 Tundra a tougher personality with the addition of a new Trailhunter package, bringing factory-backed off-road...
Trump Adds 50 Percent Tariffs on Canadian Goods as Auto Trade Fight Escalates
The trade fight between the United States and Canada is escalating again, and the auto industry is right in the...
U.S. Automakers Race to Remove Chinese Connected-Car Hardware as New Federal Rules Loom
The U.S. auto industry is entering another major supply-chain shift, and this one reaches deep into the electronics that make...
Portugal June 2026: Sales up 13.6%, Dacia and Tesla break volume records
Dacia posts its first 2,000+ sales month in Portugal. Another solid result for new car sales in Portugal, up 13.6%...
Cadillac CT5-V Blackwing Successor Reportedly Planned as Next-Gen Super Sedan Takes Shape
Cadillac’s CT5-V Blackwing may not be heading quietly into history after all. While the current-generation CT5-V Blackwing is set to...