
Finland March 2026: Tesla Model Y #1 for 4th straight month
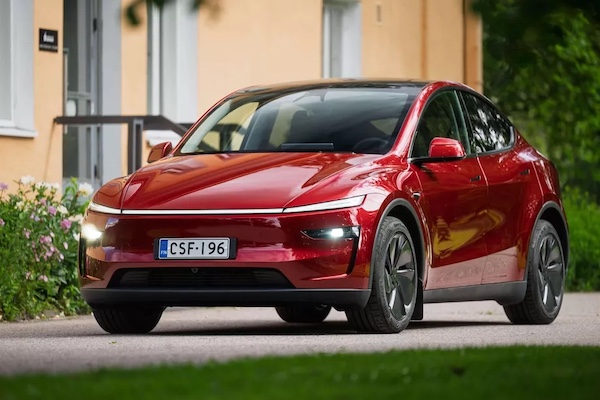
The Tesla Model Y resumes its dominance in Finland.
Finnish new car sales post an unusually strong month in March at +10% year-on-year to 6,692 units. This tilts the YTD tally into positive territory at +2.7% to 16,886. Toyota (-5.2%) remains the most popular brand in the country by far at 13.3% share despite a YoY fall and finding itself one percentage point below its YTD level. Volkswagen (+0.5%) is stable in 2nd place, a disappointing result in context. In contrast Volvo (+25%) and most impressively Tesla (+100.7%) stun below. BMW (+48.1%) also vastly outpaces the market at #7 while BYD (+194.3%), Renault (+124.3%) and Peugeot (+90.9%) stand out below.
Model-wise, the Tesla Model Y (+76.6%) ranks #1 for the 4th consecutive month with 5.4% share, as a reminder it was #5 over the Full Year 2025. The Toyota Yaris Cross (+112.9%) surges to 2nd spot, also held YTD vs. #1 over the Full Year 2025. The Nissan Qashqai (+63.2%) is back up to #3 while the Tesla Model 3 (+154.4%) surges to #4, the nameplate’s highest ranking in Finland since December 2024. Notice also the Mercedes CLA (+2366.7%) at #7, the Skoda Elroq (+258.5%) at #8 and the VW T-Roc (+306.5%) at #13.
Previous month: Finland February 2026: Tesla Model Y stays #1, Mercedes CLA up to #4
One year ago: Finland March 2025: Toyota RAV4 signs first ever win just above the Tesla Model Y
Full March 2026 Top 30 brands and models below.
Note these rankings feature the Top 30 YTD brands and models ordered based on their March 2026 sales and may therefore be slightly inaccurate.
Finland March 2026 – brands:
PosBrandMar-26%/25Feb2026%/25PosFY251Toyota89313.3%– 5.2%12,41314.3%– 5.4%112Volkswagen6589.8%+ 0.5%21,68110.0%– 2.2%223Volvo6009.0%+ 25.0%41,5549.2%+ 6.2%444Tesla5928.8%+ 100.7%61,1526.8%+ 142.5%5105Skoda5558.3%+ 14.9%31,6389.7%+ 13.3%336Kia3795.7%– 16.7%51,1296.7%– 6.8%657BMW3545.3%+ 48.1%88975.3%+ 5.5%868Mercedes3495.2%+ 1.5%79335.5%+ 13.4%779Nissan3054.6%+ 11.3%116113.6%– 26.8%111110Audi2664.0%+ 6.0%97394.4%+ 6.6%9811Ford2433.6%– 23.8%106493.8%– 6.9%10912Hyundai2083.1%– 8.8%123992.4%– 33.5%121213Polestar1742.6%– 4.4%192581.5%– 39.9%151314Renault1572.3%+ 124.3%143161.9%+ 55.7%131415BYD1031.5%+ 194.3%132731.6%+ 122.0%141816Mazda991.5%– 7.5%161921.1%– 14.7%161717Peugeot841.3%+ 90.9%181871.1%– 28.6%171618Mitsubishi751.1%+ 78.6%221550.9%+ 42.2%212019Cupra630.9%+ 57.5%241540.9%+ 16.7%222320Opel620.9%+ 19.2%151751.0%+ 42.3%182521Subaru610.9%+ 56.4%251430.8%+ 43.0%232822Suzuki600.9%– 6.3%201671.0%– 17.7%202123Citroen590.9%+ 20.4%231260.7%– 12.5%241924Dacia460.7%– 28.1%261260.7%– 49.6%251525MG430.6%– 43.4%271010.6%– 17.9%272226Land Rover420.6%+ 61.5%29880.5%– 11.1%282927Lexus420.6%+ 0.0%211160.7%– 7.9%262628Smart340.5%+ 17.2%171741.0%+ 194.9%192429Porsche290.4%– 44.2%28820.5%– 32.8%292730Mini130.2%– 27.8%30490.3%+ 19.5%31n/an/aSeat10.0%– 96.0%n/a560.3%+ 0.0%3030
Finland March 2026 – models:
PosModelMar-26%/25Feb2026%/25PosFY251Tesla Model Y3625.4%+ 76.6%19025.3%+ 210.0%152Toyota Yaris Cross2984.5%+ 112.9%56533.9%+ 30.3%213Nissan Qashqai2353.5%+ 63.2%144842.9%– 11.0%594Tesla Model 32293.4%+ 154.4%n/a2461.5%+ 36.7%16245Volvo XC602033.0%+ 63.7%34922.9%+ 25.5%476VW ID.41512.3%– 14.2%113892.3%+ 10.5%1087Mercedes CLA1482.2%+ 2366.7%44142.5%+ 1154.5%7n/a8Skoda Elroq1472.2%+ 258.5%74372.6%+ 439.5%6119Skoda Enyaq1462.2%– 5.8%84142.5%+ 0.7%8610Toyota bZ4x1422.1%+ 37.9%25073.0%+ 85.7%3n/a11Toyota C-HR1291.9%– 31.0%133171.9%– 17.7%141212Toyota Yaris1281.9%– 7.2%104032.4%– 8.2%9213VW T-Roc1261.9%+ 306.5%63492.1%+ 315.5%12n/a14Toyota Corolla1251.9%– 10.1%93492.1%+ 1.2%11315Volvo EX401211.8%+ 95.2%153271.9%+ 89.0%131616Polestar 41111.7%+ 20.7%n/a1621.0%– 26.7%242017VW ID.71001.5%– 3.8%202371.4%+ 5.3%171318Kia EV3821.2%– 36.9%212161.3%– 22.0%191419Skoda Octavia751.1%– 10.7%162211.3%– 11.2%181520Volvo V60731.1%+ 9.0%311560.9%– 38.3%261821BMW i4721.1%+ 44.0%281631.0%+ 19.9%232622VW Golf701.0%+ 4.5%191781.1%– 19.8%212123Ford Explorer641.0%+ 220.0%261520.9%+ 120.3%28n/a24Volvo XC40600.9%n/an/a1280.8%+ 0.8%32n/a25VW Tiguan600.9%– 25.0%221490.9%– 49.3%301726Volvo EX30580.9%– 22.7%301530.9%– 8.4%273027Audi Q4560.8%– 29.1%171931.1%– 9.8%201928Kia Stonic550.8%– 20.3%122871.7%+ 58.6%152329Kia Ceed540.8%– 38.6%181671.0%– 31.3%221030Volvo EC40450.7%+ 15.4%271570.9%+ 91.5%25n/an/aSkoda Kodiaq390.6%– 31.6%241350.8%– 25.4%3127n/aSmart #5330.5%new231510.9%new29n/a
Source: AUT


More Stories
Trump Adds 50 Percent Tariffs on Canadian Goods as Auto Trade Fight Escalates
The trade fight between the United States and Canada is escalating again, and the auto industry is right in the...
U.S. Automakers Race to Remove Chinese Connected-Car Hardware as New Federal Rules Loom
The U.S. auto industry is entering another major supply-chain shift, and this one reaches deep into the electronics that make...
Portugal June 2026: Sales up 13.6%, Dacia and Tesla break volume records
Dacia posts its first 2,000+ sales month in Portugal. Another solid result for new car sales in Portugal, up 13.6%...
Cadillac CT5-V Blackwing Successor Reportedly Planned as Next-Gen Super Sedan Takes Shape
Cadillac’s CT5-V Blackwing may not be heading quietly into history after all. While the current-generation CT5-V Blackwing is set to...
What to Do if You Bought a Defective Vehicle
Buying a new car can be life-changing to some, but a major liability to others who unknowingly bought a lemon....
Greece June 2026: Toyota Yaris signs first win in 2 years, strongest market in 17 years
The Toyota Yaris is the best-seller in Greece for the first time since July 2024. New car sales in Greece...