UK March 2024: Nissan Qashqai #1, Audi A3 and Mercedes A-Class impress
The Nissan Qashqai tops the UK charts in March.
March is a very important month for new car sales in the UK as it marks the biannual new license plate release and traditionally achieves the largest monthly volume of the year. The 2024 class posts a positive note at +10.4% to 317,786 units, marking a 20th consecutive month of gains. Yet this remains a damning -30.6% below pre-pandemic levels (458,054 units in March 2019) and -43.5% below the March record of 562,337 established in 2017, as per the chart below. The Q1 volume is also up 10.4% to 545,548. Private sales continue to disappoint in a weak confidence environment at -7.7% to 128,472 and 40.4% share vs. 48.4% a year ago in March 2023. In contrast fleet sales soar 29.6% to 181,399 and 57.1% share vs. 48.6% last year. Business sales (fleets under 25 vehicles) are off -8% to 7,915 and 2.5% share vs. 3%. Over Q1, private sales are down -9.2% to 207,346 and 38% share vs. 46.2% over the same period in 2023, fleet sales surge 28.9% to 326,454 and 59.8% share vs. 51.2% and business sales drop -7.7% to 11,748 and 2.2% share vs. 2.6%.
In terms of alimentation, for March diesel is down -2.7% to 23,312 and 7.3% share vs. 8.3% last year, petrol is up 9.2% to 177,019 and 55.7% vs. 56.3%, BEVs are weak at +3.8% to 48,388 and 15.2% share vs. 16.2%, PHEVs soar 36.7% to 24,517 and 7.7% vs. 6.2% and HEVs manage a 19.6% growth to 44,550 and 14% share vs. 12.9% a year ago. Over Q1, diesel is off -5.3% to 37,655 and 6.9% share vs. 8%, petrol up 9.4% to 306,925 and 56.3% share vs. 56.8%, BEVs match the market at +10.6% to 84,313 and 15.5% share vs. 15.4%, PHEVs gain 34% to 42,559 and 7.8% vs. 6.4% and HEVs advance 12.5% to 74,095 and 13.6% vs. 13.3%.
Volkswagen (+1.8%) stays #1 in the brands charts but is below its Q1 level at 7% share vs. 7.6%. The next three best-selling brands all vastly outrun the market: Nissan is up 21% to 6.5% share, BMW is up 38.7% to 6.3% and Mercedes up 20.4% to 6.2%. Reversely the next four manufacturers underperform with negative results: Ford (-16.6%) is the hardest hit, followed by Toyota (-12.3%), Kia (-6.2%) and Audi (-3.1%). Vauxhall (+28.6%) scores a very satisfying year-on-year gain but is down to #9 for the month. Other great performers below include Renault (+132.8%), Honda (+66.2%), Peugeot (+37.1%), Skoda (+33.2%) and Volvo (+32.9%). Tesla is down -33.3%.
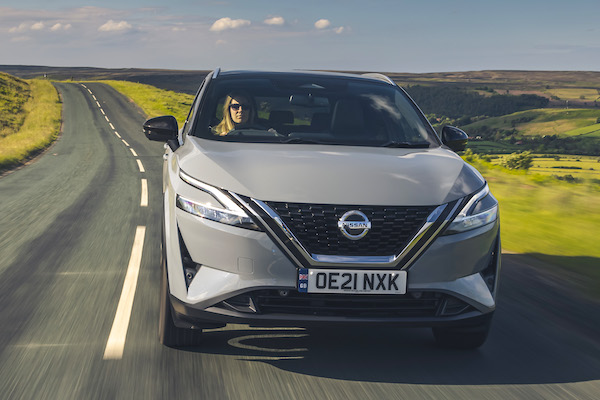
Model-wise, the entire podium outpaces the market. The locally-made Nissan Qashqai (+32.2%) scores its first win since last September and ascends to the 2nd spot year-to-date, the same ranking it held over the Full Year 2023. The Ford Puma (+47.2%) is relegated to 2nd place but remains #1 year-to-date for just 500 sales. The Kia Sportage (+26.4%) is back on the podium at #3, distancing the Nissan Juke (-2.5%) still managing an outstanding result even if dropping year-on-year. It also ranks #4 year-to-date. The Audi A3 (+53.9%) repeats at a record 5th place also reached in April 2014, October 2016, April 2023, May 2023 and February 2024. The Vauxhall Corsa (+6.5%) reappears inside the Top 10 at #6 but fails to make it among the YTD ten best-sellers. At #7, the Mercedes A-Class (+45.4%) snaps its first Top 10 finish since November 2021 (#8) and highest ranking since July 2021 (#7 also) The MG HS (+79.7%) delivers the largest year-on-year gain in the Top 10 whereas the Tesla Model Y (-31%), #1 a year ago, is down to #9 and endures the steepest decline and one of only two falls in the Top 10.
Previous month: UK February 2024: Strongest February result in 20 years, VW Golf up to #2
One year ago: UK March 2023: Tesla Model Y #1, Nissan (+66.7%) places Qashqai and Juke atop YTD charts, market up 18.2%
Full March 2024 Top 47 All brands and Top 10 models below.
UK March 2024 – brands:
PosBrandMar-24%/23Feb2024%/23PosFY231Volkswagen22,1477.0%+ 1.8%141,3317.6%+ 0.8%112Nissan 20,5596.5%+ 21.0%733,4036.1%+ 28.7%383BMW 20,0656.3%+ 38.7%236,7716.7%+ 42.3%244Mercedes 19,7946.2%+ 20.4%1228,5435.2%+ 20.5%895Kia18,4785.8%– 6.2%633,0846.1%+ 2.6%466Audi 18,4545.8%– 3.1%432,4626.0%– 0.7%637Ford 17,0265.4%– 16.6%332,5676.0%– 10.6%528Toyota16,8865.3%– 12.3%1326,1934.8%– 17.5%959Vauxhall 15,5534.9%+ 28.6%528,6645.3%+ 25.4%7710Hyundai13,5704.3%+ 0.3%823,4804.3%– 2.5%101011MG12,9344.1%+ 5.7%1023,1384.2%+ 11.9%111112Land Rover12,3763.9%+ 9.9%2118,5723.4%+ 17.5%131413Peugeot 11,9443.8%+ 37.1%1121,3063.9%+ 42.0%121314Skoda9,9823.1%+ 33.2%918,4513.4%+ 8.5%141215Renault8,7832.8%+ 132.8%1914,6642.7%+ 74.6%151816Honda7,9192.5%+ 66.2%2012,1822.2%+ 47.2%182517Volvo7,5262.4%+ 32.9%1713,6232.5%+ 14.3%161518Tesla6,9952.2%– 33.3%1411,7682.2%– 11.9%191619Mini6,4842.0%– 13.6%1612,5942.3%+ 4.5%171720Seat6,0411.9%+ 24.1%1511,1502.0%+ 14.0%201921Suzuki5,0491.6%+ 15.4%247,6761.4%+ 11.2%232322Dacia4,9931.6%+ 22.4%228,3251.5%+ 9.9%222223Citroen4,8701.5%– 8.6%189,3741.7%– 1.9%212024Jaguar4,6901.5%+ 141.8%276,7591.2%+ 106.2%262925Mazda4,6281.5%– 7.2%257,4671.4%– 14.2%242126Cupra3,9821.3%+ 34.9%236,9831.3%+ 32.6%252427Fiat3,3871.1%+ 0.5%265,2591.0%– 11.5%272728Porsche3,1281.0%– 15.2%284,8480.9%– 19.9%282629Lexus2,7580.9%+ 90.2%293,8630.7%+ 51.0%292830Jeep1,6090.5%+ 248.3%302,4890.5%+ 143.5%303131Polestar8030.3%– 50.4%321,2980.2%– 63.1%313032BYD7590.2%+ 2132.4%311,2780.2%+ 3658.8%323833Subaru6410.2%+ 44.0%368990.2%+ 54.7%333234KGM/SsangYong3850.1%+ 49.8%336030.1%+ 44.3%343435Ora3100.1%+ 64.9%394220.1%+ 97.2%363936Smart3060.1%+ 628.6%345310.1%+ 555.6%354337Alfa Romeo1960.1%– 12.1%373290.1%– 7.8%383538DS1840.1%– 45.4%353700.1%– 53.5%373339Abarth1530.0%+ 146.8%382820.1%+ 220.5%394140Bentley1470.0%– 41.2%422450.0%– 40.7%403741Genesis1410.0%– 19.9%432180.0%– 39.6%413642Maserati910.0%– 53.6%441560.0%– 50.8%434043Alpine900.0%+ 83.7%411500.0%+ 72.4%444444Ineos380.0%new45700.0%new454245Fisker100.0%new402070.0%new424546Maxus10.0%– 66.7% –10.0%– 66.7%464747Chevrolet10.0%n/a –10.0%n/a4746 –Other British5330.2%– 9.7% –8620.2%– 4.4% – – –Other Imports3870.1%+ 39.7% –6370.1%+ 50.2% – –
UK March 2024 – models:
PosModelMar-24%/23Feb2024%/23PosFY231Nissan Qashqai8,9312.8%+ 32.2%914,5552.7%+ 31.4%222Ford Puma8,3182.6%+ 47.2%115,0542.8%+ 57.5%113Kia Sportage7,4452.3%+ 26.4%413,6322.5%+ 42.6%344Nissan Juke7,3462.3%– 2.5%n/a11,2062.1%+ 3.0%485Audi A36,0101.9%+ 53.9%510,4931.9%+ 66.4%596Vauxhall Corsa5,9521.9%+ 6.5%n/an/an/an/an/a37Mercedes A-Class5,8921.9%+ 45.4%n/an/an/an/an/a298VW Golf5,6311.8%+ 30.4%210,2901.9%+ 50.3%7129Tesla Model Y5,6021.8%– 31.0%8n/an/an/an/a510MG HS5,4601.7%+ 79.7%n/a10,0281.8%+ 41.6%913n/aBMW 1 Series5,3871.7%+ 112.2%710,4061.9%+ 140.3%622n/aMini5,1421.6%– 4.8%610,0491.8%+ 20.7%87n/aVW T-Roc4,7821.5%+ 36.5%38,9341.6%+ 10.0%1020
Source: SMMT


