
Brazil October 2023: Rampage lifts Ram up 474.1%
The Ram Rampage sells over 2,500 units in October.
The Brazilian new light vehicle market is up a sturdy 22.7% year-on-year in October to 206,669 units, a clear sign of recovery after October 2022 was up 12.3% on the year prior. However we remain roughly 15% below pre-pandemic levels (241,175 units in October 2019). The year-to-date volume is now up 11.4% to 1,741,128, 20% below the 10 months 2019 result. Fiat (+18.8%) comfortably retains the brands top spot with 21.5% share vs. 11.7% at home in Italy. Volkswagen (+38.6%) continues to impress in 2nd place with 15.9% share, it is also up 31.6% year-to-date. Chevrolet (+14.6%) is the weakest in the Top 4 and stuck at #3 above Toyota (+15.1%) which overtakes Hyundai (stable) to return to the 4th place it holds year-to-date. Nissan (+143.6%), Chery (+88.8%), Ford (+83.4%) and Peugeot (+61.9%) impress below but Ram (+474.1%) is the hero of the month with a surreal uptick. Porsche (+69.8%) also shines further down.
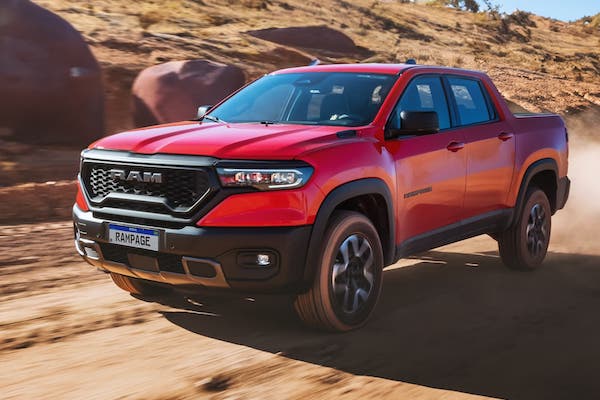
The Fiat Strada (+47.6%) is the best-selling model again, resisting the VW Polo (+1403.1%) which ends the month 751 units below. The Chevrolet Onix (+37.2%) lodges a solid month to stay at #3. Leader a year ago, the Hyundai HB20 (-18.3%) is down to #5 this month while the Nissan Kicks (+134.8%) is the only remaining Top 10 member to beat the market. Indeed the Chevrolet Tracker (-21.5%) and Onix Plus (-3.3%) regress, the Renault Kwid (+5.8%) is weak and the VW T-Cross (+20.3%) and Fiat Mobi (+19.2%) just miss out on matching the market growth. The VW Virtus (+661.8%) and Peugeot 208 (+129.9%) post extravagant lifts but the best performer this month is the new Ram Rampage, a competitor for the Toyota Hilux and Ford Ranger, up 24 spots to #32 with over 2,500 sales.
Previous month: Brazil September 2023: Fiat and Strada dominate, BYD and GWM up
One year ago: Brazil October 2022: Hyundai HB20 and Chevrolet Tracker top market up 12.3%
Full October 2023 Top 25 brands and Top 135 models below.
Brazil October 2023 – brands:
PosBrandOct-23%/22Sep2023%/22PosFY221Fiat 44,45621.5%+ 18.8%1384,44422.1%+ 11.9%112Volkswagen32,88615.9%+ 38.6%2271,31015.6%+ 31.6%233Chevrolet32,27415.6%+ 14.6%3268,58115.4%+ 15.9%324Toyota 17,6688.5%+ 15.1%5157,1759.0%+ 2.7%445Hyundai 16,3347.9%– 0.0%4144,3708.3%– 6.9%556Renault 11,9245.8%+ 3.8%699,2205.7%– 2.5%777Jeep9,5074.6%– 16.7%7106,6886.1%– 3.4%668Nissan8,0223.9%+ 143.6%859,1683.4%+ 32.5%999Honda5,5762.7%+ 10.1%959,8353.4%+ 32.3%8810Chery3,7881.8%+ 88.8%1023,2291.3%– 22.2%121111Ford 3,4891.7%+ 83.4%1322,5101.3%+ 36.3%131412Peugeot3,3051.6%+ 61.9%1128,1571.6%– 18.7%101013Citroen 3,1391.5%– 20.0%1225,9211.5%+ 10.0%111214Ram3,0771.5%+ 474.1%1810,4090.6%+ 212.9%162015BYD2,7321.3%new148,8220.5%new17n/a16Mitsubishi1,8550.9%+ 19.5%1514,1590.8%– 23.3%141317GWM1,4500.7%new177,3240.4%new18 –18BMW1,3690.7%+ 49.5%1611,8550.7%+ 3.6%151519Volvo6470.3%+ 38.8%206,3920.4%+ 59.6%191920Audi6310.3%+ 43.7%195,0210.3%+ 19.8%201721Kia4800.2%+ 21.8%n/an/an/an/a241822Porsche4380.2%+ 69.8%224,3910.3%+ 64.3%222223Land Rover3780.2%+ 3.6%214,0310.2%+ 31.3%232124Mercedes3290.2%– 44.6%234,7760.3%– 4.8%2116
Brazil October 2023 – models:
PosModelOct-23%/22Sep2023%/22PosFY221Fiat Strada11,8745.7%+ 47.6%198,5115.7%+ 4.7%112VW Polo 11,1235.4%+ 1403.1%283,0504.8%+ 2533.2%2523Chevrolet Onix10,6575.2%+ 37.2%381,4034.7%+ 19.1%334Fiat Mobi8,0373.9%+ 19.2%759,6663.4%+ 5.1%655Hyundai HB207,4213.6%– 18.3%469,2214.0%– 13.3%426Chevrolet Onix Plus7,1143.4%– 3.3%563,0933.6%+ 6.6%547VW T-Cross6,7243.3%+ 20.3%958,1253.3%+ 7.7%788Chevrolet Tracker6,6693.2%– 21.5%653,9793.1%– 2.4%979Renault Kwid6,3943.1%+ 5.8%1049,2412.8%+ 6.8%121210Nissan Kicks6,1153.0%+ 134.8%1341,7702.4%+ 27.7%152111Hyundai Creta5,3542.6%+ 6.1%1650,2522.9%– 1.1%101112Fiat Argo5,2572.5%– 20.7%856,1663.2%+ 13.4%8913VW Nivus4,9572.4%+ 31.4%1242,0372.4%+ 40.8%142014Fiat Cronos4,9292.4%+ 32.6%1438,8522.2%+ 27.4%181915Jeep Compass4,6402.2%– 12.6%1749,4222.8%– 3.2%111016VW Saveiro4,2142.0%– 5.2%1138,2222.2%+ 119.4%192717Fiat Pulse4,1572.0%– 3.6%2436,5522.1%– 14.6%211418Fiat Toro4,0872.0%+ 37.1%1842,1802.4%+ 0.9%131519Honda HR-V4,0492.0%+ 55.6%1539,9292.3%+ 329.3%163720Toyota Hilux4,0261.9%– 4.2%2138,0732.2%+ 0.2%201621Toyota Corolla3,9961.9%+ 21.6%2335,3052.0%+ 1.2%221722Toyota Corolla Cross3,6821.8%+ 14.2%2535,0372.0%– 0.5%231823Fiat Fastback3,6401.8%+ 28.0%2232,7451.9%+ 899.8%244724Hyundai HB20S3,4421.7%+ 59.7%1923,9011.4%+ 12.9%262625Jeep Renegade3,2491.6%– 17.9%2039,9222.3%– 3.8%171326Chevrolet Montana2,9241.4%n/a3025,2731.5%+ 168386.7%25n/a27VW Virtus2,9101.4%+ 661.8%2621,0341.2%+ 397.3%305528Renault Duster2,8911.4%+ 51.1%2720,0361.2%+ 10.2%312829Peugeot 2082,8321.4%+ 129.9%3123,0841.3%– 4.4%272330Citroen C32,7141.3%+ 3.6%3221,2521.2%+ 386.0%294231Ford Ranger2,5911.3%+ 84.7%3315,7610.9%+ 38.0%373832Ram Rampage2,5411.2%new563,1210.2%new62 –33Chery Tiggo 5X2,4831.2%+ 444.5%419,7420.6%+ 25.1%424834Toyota Yaris Sedan2,4261.2%+ 66.6%2816,1360.9%+ 32.7%363635Chevrolet Spin2,0511.0%+ 18.1%3416,8711.0%+ 25.2%343336Fiat Fiorino2,0511.0%+ 7.7%2916,1850.9%– 3.8%353137Chevrolet S102,0371.0%+ 25.4%3621,4621.2%– 4.0%282438VW Taos1,8650.9%+ 88.6%3812,3630.7%+ 35.9%394139Toyota Yaris Hatch1,8620.9%– 17.4%3519,1731.1%– 8.8%322540Jeep Commander1,5770.8%– 25.3%3716,9541.0%– 4.0%332941Toyota Hilux SW41,5480.7%+ 78.1%3912,5410.7%+ 15.9%383942GWM Haval H61,4500.7%new407,3240.4%new47 –43BYD Dolphin1,3660.7%new442,8680.2%new64 –44Mitsubishi L2001,2060.6%– 2.9%429,6850.6%– 25.4%433545BYD Song Plus1,1000.5%new464,2660.2%new54 –46Renault Oroch9910.5%– 31.3%4310,4840.6%+ 11.3%404047Renault Master9800.5%+ 31.4%458,7010.5%+ 4.0%454648Nissan Versa7670.4%+ 896.1%517,0630.4%+ 39.9%485449Honda City7510.4%– 33.9%5010,0240.6%– 49.0%413050VW Amarok7350.4%+ 70.1%476,3490.4%+ 45.9%515351Honda City Hatch6840.3%– 48.3%499,3270.5%– 29.5%443452Chery Tiggo 86780.3%– 30.7%487,3330.4%– 18.0%464453Nissan Frontier6480.3%+ 7.6%536,6750.4%+ 0.9%495054Chery Tiggo 75100.2%+ 5.8%525,0730.3%– 30.7%534955Nissan Sentra4900.2%n/a603,4360.2%n/a58n/a56Mitsubishi Eclipse Cross4640.2%+ 75.8%622,7950.2%– 5.8%665957Renault Sandero4430.2%– 24.7%546,5780.4%– 17.4%504358Chevrolet Equinox4250.2%+ 47.1%553,3570.2%+ 198.7%597759BMW X14180.2%+ 159.6%573,1610.2%– 6.4%616260Citroen C4 Cactus3320.2%– 71.6%583,1820.2%– 80.9%603261Volvo XC603230.2%+ 319.5%633,6090.2%+ 147.0%577562VW Jetta3130.2%+ 745.9%721,6720.1%+ 269.9%7110963Fiat Scudo3110.2%+ 41.4%612,9700.2%+ 377.5%639364BMW 320i3100.1%– 31.7%593,7280.2%+ 6.5%565765Ford Bronco2570.1%+ 46.9%n/an/an/an/an/a7966Audi Q52460.1%+ 284.4%691,6650.1%+ 32.2%738067Kia K25002360.1%– 8.2%642,0030.1%– 8.7%696668Chevrolet Trailblazer2170.1%– 37.8%841,4330.1%– 44.4%786369BYD Yuan Plus2150.1%new809950.1%new91n/a70Peugeot Expert1970.1%– 37.3%701,5220.1%– 52.9%756171Ford Maverick1970.1%+ 392.5%1001,3400.1%+ 12.4%848572Mitsubishi Pajero1850.1%+ 400.0%711,6670.1%+ 17.3%727373Renault Logan1770.1%– 74.3%653,7940.2%– 53.7%554574Ford Territory1750.1%+ 118.8%799560.1%+ 9.5%929575Ram 35001680.1%– 37.1%752,8680.2%+ 97.9%656876Ram Classic1630.1%+ 297.6%731,8240.1%+ 4348.8%7010877Ram 25001590.1%+ 591.3%741,3670.1%+ 55.9%829278VW/MAN Express1490.1%+ 20.2%761,5430.1%– 17.2%747079Ford Transit1400.1%– 10.8%812,1780.1%+ 76.1%677180Audi Q31400.1%– 37.5%771,2800.1%+ 12.2%857881Volvo XC401330.1%– 49.6%961,2790.1%– 5.3%867482Porsche 9111320.1%+ 73.7%828300.0%+ 60.9%9910583Peugeot 20081310.1%– 41.8%781,5050.1%– 68.2%775684Chevrolet Cruze Sedan1210.1%– 70.7%859970.1%– 87.5%905185Iveco Daily 1160.1%– 4.1%861,5120.1%+ 114.8%769686Kia Sportage1140.1%n/a898640.0%n/a98n/a87Fiat Ducato1050.1%+ 600.0%944950.0%– 73.0%1087688Mercedes Sprinter 3151040.1%+ 89.1%881,1450.1%+ 356.2%8811589Chery Arrizo 61000.0%+ 222.6%668960.1%– 29.8%958190Land Rover Discovery960.0%– 11.1%681,3510.1%+ 5.5%838291Mini Cooper940.0%+ 64.9%1086320.0%+ 8.0%10410092BMW X4930.0%n/a839020.1%n/a949993Peugeot Partner870.0%– 57.6%671,4230.1%– 18.0%796994Effa V21860.0%+ 16.2%927280.0%+ 24.2%10010195Porsche Macan840.0%– 9.7%911,1070.1%+ 19.8%899196Citroen Jumpy830.0%– 35.7%871,4190.1%– 41.6%806597Ford F-150780.0%n/a998760.1%n/a97n/a98Land Rover Defender750.0%n/a988890.1%n/a9613999Volvo XC90720.0%n/a909390.1%n/a93n/a100Audi A3 Sedan700.0%+ 600.0%1015650.0%+ 44.9%106110101Mercedes C Class630.0%– 68.2%976530.0%– 26.7%10388102Porsche Panamera630.0%+ 384.6%1063750.0%+ 98.4%111131103Audi A5580.0%+ 132.0%1044600.0%+ 89.3%109119104Porsche Cayenne480.0%n/a1031,3950.1%n/a81n/a105Ram 1500450.0%– 78.0%951,2290.1%+ 28.0%8786106BMW 330E450.0%– 27.4%1075330.0%+ 3.1%107107107Audi A3450.0%+ 4400.0%1133240.0%+ 110.4%117135108Porsche Cayman440.0%n/a1121840.0%n/a130n/a109Porsche Boxster410.0%+ 4000.0%1102430.0%+ 196.3%123146110Chevrolet Cruze Hatch380.0%– 64.5%1143400.0%– 72.9%11584111Jeep Gladiator340.0%+ 100.0%1112070.0%+ 78.4%129140112Honda Civic330.0%+ 1550.0%1194430.0%– 77.7%11072113Honda Accord330.0%n/an/a420.0%n/a162n/a114Hyundai Ioniq270.0%+ 1250.0%932280.0%– 5.0%126128115Porsche Taycan260.0%+ 766.7%n/a2320.0%+ 2.7%125127116JAC E-JS1240.0%– 11.1%1053730.0%– 32.5%112106117VW Gol220.0%– 99.3%1186,1530.4%– 89.0%526118Peugeot Boxer220.0%n/a1171600.0%+ 73.9%133144119Ford Mustang210.0%– 30.0%1153200.0%+ 5.6%118122120Iveco Daily 30-130200.0%+ 42.9%1261620.0%– 63.5%132113121Effa V22180.0%– 33.3%1162990.0%+ 39.1%120125122Jaguar F-Type180.0%+ 80.0%128830.0%+ 50.9%140n/a123BMW M3170.0%+ 0.0%1202420.0%+ 72.9%124134124Hyundai HR150.0%– 28.6%n/a930.0%– 85.4%138104125BMW 420i150.0%+ 25.0%n/a900.0%– 2.2%139138126Audi A4140.0%– 46.2%n/a2710.0%+ 74.8%121124127Toyota Corolla GR140.0%new129540.0%new156 –128Mercedes Sprinter 517120.0%new123650.0%new150 –129Mercedes Sprinter 110.0%+ 22.2%1271140.0%– 11.6%136137130BYD Seal110.0%new1021020.0%new137 –131Effa V25110.0%+ 57.1%n/a630.0%+ 46.5%152n/a132BMW i4100.0%new1221310.0%new135n/a133VW Fusca100.0%+ 66.7%n/a760.0%+ 46.2%144n/a134JAC EJV5.5100.0%new131390.0%new163 –135Honda Civic Type-R90.0%n/an/a450.0%n/a160n/a
Source: Fenabrave


More Stories
How to Experience the Magic of Maserati’s 100-Year Racing Legacy at Goodwood Revival 2026
The Goodwood Revival (18-20 September) will shine a spotlight on one of Italy’s most evocative marques. In 2026, the event...
BMW Bringing Humanoid Robots to a German Factory Marks a Big Shift for the Future of Car Building
BMW Group is taking the next step into what it calls “Physical AI,” and this time it’s happening on home...
Mystery Toyota Rally Coupe Spotted Testing Could Hint at a New Celica Return
Toyota fans have been living in a bit of a golden era lately, and the rumor mill says there may...
Why Upgrading to LED Headlights is Essential for Your Vehicle
When it comes to vehicle lighting, switching from traditional halogen bulbs to LED headlight bulb is a game-changer. Lasfit’s LED...
How to Turn That Eyesore in Your Idaho Driveway Into Instant Cash
Photo Credit Idaho property owners often watch their once-reliable vehicles transform into permanent lawn ornaments as the harsh mountain winters...
United Arab Emirates January 2026: Jetour (+63.1%), Mitsubishi (+12.6%) impress in market off -1.8%
This content is for members only. Visit the site and log in/register to read.