
Finland May 2026: Toyota places five models in the Top 6
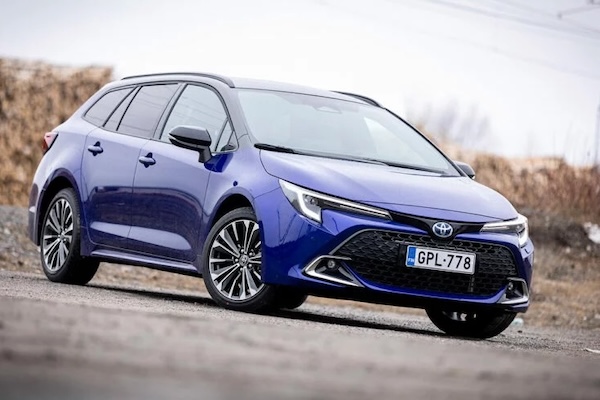
The Toyota Corolla is the best-selling vehicle in Finland for the first time in two years.
New car sales in Finland are stable in May at -0.5% to 6,666 units, leading to a year-to-date volume also down -0.5% to 29,152. Toyota (+38.9%) posts a sensational month and is up to 21.3% share vs. 16% year-to-date. In contrast Volkswagen (-27.5%) implodes but still manages a second place finish. Skoda (+3.9%) remains at #3 above a surging Mercedes (+62.8%). But it’s Tesla (+198.7%) that manages the best performance inside the Top 10, up 10 spots on April to #5. Further down, BYD (+936.4%) at #13 and Smart (+746.7%) at #12 both post surreal YoY gains, as do Opel (+166.7%) and MG (+106.3%) below.
In the models ranking, Toyota places five models in the Top 6. The Corolla (+45.5%) signs its first monthly win since June 2024, distancing the Yaris Cross (+26.3%). The Yaris (-12.6%) is in difficulty but still ranks #4 ahead of the C-HR (+337.5%) and bZ4X (+952.6%). The odd one out is the Tesla Model Y (+151.2%) back up 15 spots on April to #3 and still leader YTD. Notice also the Mercedes CLA (+464.7%) at #7, the VW T-Roc (+517.9%) at #8, the Tesla Model 3 (+418.5%) at #11 and the Smart #5 (+2280%) at #14.
Previous month: Finland April 2026: Toyota Yaris Cross back to #1, Smart #5 in Top 10
One year ago: Finland May 2025: Renault up 247.7%, pushes Clio to #4
Full May 2026 Top 30 brands and Top 20 models below.
Finland May 2026 – brands:
PosBrandMay-26%/25Apr2026%/25PosFY251Toyota1,41821.3%+ 38.9%14,66216.0%+ 4.6%112Volkswagen6639.9%– 27.5%23,01810.4%– 13.5%223Skoda6369.5%+ 3.9%32,8619.8%+ 7.4%334Mercedes4647.0%+ 62.8%61,7295.9%+ 25.7%675Tesla4456.7%+ 198.7%151,6885.8%+ 142.9%7106Volvo3996.0%– 30.8%42,3918.2%– 10.0%447BMW3355.0%+ 9.8%91,4905.1%+ 5.5%868Kia3244.9%– 41.0%71,7816.1%– 21.6%559Audi3204.8%+ 0.3%51,4144.9%+ 6.5%9810Ford1902.9%– 26.9%81,1053.8%– 6.8%10911Hyundai1372.1%– 47.3%106972.4%– 35.9%121212Smart1271.9%+ 746.7%124141.4%+ 483.1%162413BYD1141.7%+ 936.4%115121.8%+ 216.0%131814Polestar1131.7%+ 20.2%144651.6%– 24.4%141315Peugeot961.4%+ 21.5%163651.3%– 20.3%171616Mazda951.4%+ 55.7%203521.2%+ 2.9%181717Renault801.2%– 73.9%214581.6%– 27.4%151418Opel721.1%+ 166.7%133451.2%+ 92.7%192519Lexus701.1%+ 59.1%272210.8%+ 7.8%252620MG661.0%+ 106.3%222160.7%+ 4.3%262221Citroen641.0%+ 60.0%182660.9%– 11.3%211922Nissan570.9%– 67.6%177482.6%– 39.1%111123Cupra560.8%+ 0.0%192781.0%+ 20.3%202324Subaru490.7%+ 25.6%252330.8%+ 20.7%242825Mitsubishi470.7%– 36.5%262420.8%+ 0.8%232026Dacia440.7%+ 2.3%242130.7%– 35.5%271527Suzuki410.6%– 37.9%232550.9%– 18.0%222128Porsche270.4%– 40.0%291340.5%– 30.9%292729Mini210.3%– 32.3%n/a700.2%– 31.4%30n/a30Land Rover200.3%– 42.9%281370.5%– 20.3%2829
Finland May 2026 – models:
Note: This ranking features the Top 30 models YTD ordered based on their May sales and may therefore not be 100% accurate.
PosModelMay-26%/25Apr2026%/25PosFY251Toyota Corolla3525.3%+ 45.5%68512.9%+ 11.8%332Toyota Yaris Cross3124.7%+ 26.3%11,2374.2%+ 23.1%213Tesla Model Y3044.6%+ 151.2%181,2824.4%+ 177.5%154Toyota Yaris2704.1%– 12.6%38452.9%– 10.9%425Toyota C-HR2453.7%+ 337.5%136542.2%+ 28.5%11126Toyota bZ4x2003.0%+ 952.6%118152.8%+ 135.5%5n/a7Mercedes CLA1922.9%+ 464.7%97222.5%+ 749.4%8n/a8VW T-Roc1732.6%+ 517.9%76482.2%+ 356.3%12n/a9Skoda Octavia1412.1%+ 88.0%n/a4201.4%+ 4.2%151510Skoda Elroq1402.1%– 16.7%47442.6%+ 81.0%61111Tesla Model 31402.1%+ 418.5%n/a4001.4%+ 75.4%162412Skoda Enyaq1392.1%– 2.8%27272.5%+ 4.9%7613VW ID.41281.9%– 30.1%56722.3%– 7.4%10814Smart #51191.8%+ 2280.0%103801.3%+ 7500.0%17n/a15Volvo EX401071.6%+ 35.4%145261.8%+ 46.9%141616Mercedes GLC1021.5%n/an/a2610.9%+ 12.5%29n/a17Volvo XC60951.4%– 47.5%87122.4%– 3.9%9718BMW i4831.2%+ 43.1%163221.1%+ 38.8%222619VW Golf811.2%– 17.3%n/a3201.1%– 27.6%232120Audi Q4791.2%+ 25.4%n/a3251.1%– 11.9%2119n/aVW Tiguan721.1%– 35.7%202851.0%– 42.0%2617n/aPolestar 4691.0%+ 60.5%n/a2831.0%– 11.0%2720n/aAudi Q6681.0%+ 0.0%122951.0%+ 11.3%24n/an/aVolvo EX30681.0%+ 36.0%192941.0%+ 1.4%2530n/aKia EV3620.9%– 30.3%n/a3381.2%– 25.9%2014n/aVW ID.7500.8%– 73.8%153771.3%– 36.4%1813n/aFord Explorer460.7%+ 7.0%172740.9%+ 76.8%28n/an/aKia Ceed450.7%– 71.2%n/a2510.9%– 52.1%3010n/aKia Stonic380.6%– 61.6%n/a3571.2%+ 2.6%1923n/aNissan Qashqai340.5%– 73.4%n/a5732.0%– 28.5%139
Source: aut

More Stories
Internet Leak Pulls the Cover Off Audi’s Next Q7 Ahead of Planned Launch
Audi intended to begin introducing the next Q7 with a small teaser; however, the internet had other plans. A new...
AdventureBumms Turns a 2021 Sprinter into a Gear-Focused Off-Road Escape Rig
AdventureBumms is well-known for its one-off custom campers, and the company has recently released details of a Sprinter AWD van...
Croatia May 2026: VW T-Cross and Opel Frontera top record market
The Opel Frontera repeats at #2 in Croatia. Excellent month for the Croatian new car market, up 10.8% year-on-year in...
Chile May 2026: Mitsubishi L200 #1, Riddara RD6 at world best
The Riddara RD6 is inside the Chilean Top 30 in May. New light vehicle sales in Chine edge up 0.5%...
Saudi Arabia April 2026: MG (+41.5%), Haval (+30.7%), Jetour (+29.7%) defy market down -21.9%
This content is for members only. Visit the site and log in/register to read.
United Arab Emirates April 2026: Market off -41.9%, Nissan Patrol best-seller
This content is for members only. Visit the site and log in/register to read.