
Finland May 2026: Toyota places five models in the Top 6

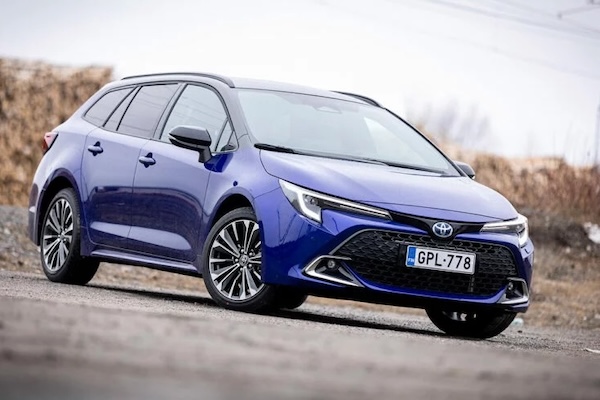
The Toyota Corolla is the best-selling vehicle in Finland for the first time in two years.
New car sales in Finland are stable in May at -0.5% to 6,666 units, leading to a year-to-date volume also down -0.5% to 29,152. Toyota (+38.9%) posts a sensational month and is up to 21.3% share vs. 16% year-to-date. In contrast Volkswagen (-27.5%) implodes but still manages a second place finish. Skoda (+3.9%) remains at #3 above a surging Mercedes (+62.8%). But it’s Tesla (+198.7%) that manages the best performance inside the Top 10, up 10 spots on April to #5. Further down, BYD (+936.4%) at #13 and Smart (+746.7%) at #12 both post surreal YoY gains, as do Opel (+166.7%) and MG (+106.3%) below.
In the models ranking, Toyota places five models in the Top 6. The Corolla (+45.5%) signs its first monthly win since June 2024, distancing the Yaris Cross (+26.3%). The Yaris (-12.6%) is in difficulty but still ranks #4 ahead of the C-HR (+337.5%) and bZ4X (+952.6%). The odd one out is the Tesla Model Y (+151.2%) back up 15 spots on April to #3 and still leader YTD. Notice also the Mercedes CLA (+464.7%) at #7, the VW T-Roc (+517.9%) at #8, the Tesla Model 3 (+418.5%) at #11 and the Smart #5 (+2280%) at #14.
Previous month: Finland April 2026: Toyota Yaris Cross back to #1, Smart #5 in Top 10
One year ago: Finland May 2025: Renault up 247.7%, pushes Clio to #4
Full May 2026 Top 30 brands and Top 20 models below.
Finland May 2026 – brands:
PosBrandMay-26%/25Apr2026%/25PosFY251Toyota1,41821.3%+ 38.9%14,66216.0%+ 4.6%112Volkswagen6639.9%– 27.5%23,01810.4%– 13.5%223Skoda6369.5%+ 3.9%32,8619.8%+ 7.4%334Mercedes4647.0%+ 62.8%61,7295.9%+ 25.7%675Tesla4456.7%+ 198.7%151,6885.8%+ 142.9%7106Volvo3996.0%– 30.8%42,3918.2%– 10.0%447BMW3355.0%+ 9.8%91,4905.1%+ 5.5%868Kia3244.9%– 41.0%71,7816.1%– 21.6%559Audi3204.8%+ 0.3%51,4144.9%+ 6.5%9810Ford1902.9%– 26.9%81,1053.8%– 6.8%10911Hyundai1372.1%– 47.3%106972.4%– 35.9%121212Smart1271.9%+ 746.7%124141.4%+ 483.1%162413BYD1141.7%+ 936.4%115121.8%+ 216.0%131814Polestar1131.7%+ 20.2%144651.6%– 24.4%141315Peugeot961.4%+ 21.5%163651.3%– 20.3%171616Mazda951.4%+ 55.7%203521.2%+ 2.9%181717Renault801.2%– 73.9%214581.6%– 27.4%151418Opel721.1%+ 166.7%133451.2%+ 92.7%192519Lexus701.1%+ 59.1%272210.8%+ 7.8%252620MG661.0%+ 106.3%222160.7%+ 4.3%262221Citroen641.0%+ 60.0%182660.9%– 11.3%211922Nissan570.9%– 67.6%177482.6%– 39.1%111123Cupra560.8%+ 0.0%192781.0%+ 20.3%202324Subaru490.7%+ 25.6%252330.8%+ 20.7%242825Mitsubishi470.7%– 36.5%262420.8%+ 0.8%232026Dacia440.7%+ 2.3%242130.7%– 35.5%271527Suzuki410.6%– 37.9%232550.9%– 18.0%222128Porsche270.4%– 40.0%291340.5%– 30.9%292729Mini210.3%– 32.3%n/a700.2%– 31.4%30n/a30Land Rover200.3%– 42.9%281370.5%– 20.3%2829
Finland May 2026 – models:
Note: This ranking features the Top 30 models YTD ordered based on their May sales and may therefore not be 100% accurate.
PosModelMay-26%/25Apr2026%/25PosFY251Toyota Corolla3525.3%+ 45.5%68512.9%+ 11.8%332Toyota Yaris Cross3124.7%+ 26.3%11,2374.2%+ 23.1%213Tesla Model Y3044.6%+ 151.2%181,2824.4%+ 177.5%154Toyota Yaris2704.1%– 12.6%38452.9%– 10.9%425Toyota C-HR2453.7%+ 337.5%136542.2%+ 28.5%11126Toyota bZ4x2003.0%+ 952.6%118152.8%+ 135.5%5n/a7Mercedes CLA1922.9%+ 464.7%97222.5%+ 749.4%8n/a8VW T-Roc1732.6%+ 517.9%76482.2%+ 356.3%12n/a9Skoda Octavia1412.1%+ 88.0%n/a4201.4%+ 4.2%151510Skoda Elroq1402.1%– 16.7%47442.6%+ 81.0%61111Tesla Model 31402.1%+ 418.5%n/a4001.4%+ 75.4%162412Skoda Enyaq1392.1%– 2.8%27272.5%+ 4.9%7613VW ID.41281.9%– 30.1%56722.3%– 7.4%10814Smart #51191.8%+ 2280.0%103801.3%+ 7500.0%17n/a15Volvo EX401071.6%+ 35.4%145261.8%+ 46.9%141616Mercedes GLC1021.5%n/an/a2610.9%+ 12.5%29n/a17Volvo XC60951.4%– 47.5%87122.4%– 3.9%9718BMW i4831.2%+ 43.1%163221.1%+ 38.8%222619VW Golf811.2%– 17.3%n/a3201.1%– 27.6%232120Audi Q4791.2%+ 25.4%n/a3251.1%– 11.9%2119n/aVW Tiguan721.1%– 35.7%202851.0%– 42.0%2617n/aPolestar 4691.0%+ 60.5%n/a2831.0%– 11.0%2720n/aAudi Q6681.0%+ 0.0%122951.0%+ 11.3%24n/an/aVolvo EX30681.0%+ 36.0%192941.0%+ 1.4%2530n/aKia EV3620.9%– 30.3%n/a3381.2%– 25.9%2014n/aVW ID.7500.8%– 73.8%153771.3%– 36.4%1813n/aFord Explorer460.7%+ 7.0%172740.9%+ 76.8%28n/an/aKia Ceed450.7%– 71.2%n/a2510.9%– 52.1%3010n/aKia Stonic380.6%– 61.6%n/a3571.2%+ 2.6%1923n/aNissan Qashqai340.5%– 73.4%n/a5732.0%– 28.5%139
Source: aut


More Stories
Toyota Recalls Nearly 106,000 Land Cruiser SUVs Over Fuel Leak and Potential Fire Risk
Toyota’s legendary Land Cruiser has built its reputation on durability and reliability, but even one of the toughest SUVs on...
Legendary Mercedes-Benz AMG Hammer Could Make a Comeback as HWA Teases Stunning W124 Revival
Some cars earn legendary status through impressive sales figures, while others become icons simply because they were outrageously fast for...
10 Practical Gifts for Truck Owners Who Work Outdoors
Who actually needs another novelty keychain? For someone whose truck doubles as an office, a toolshed, and a lunchroom, the...
Uzbekistan September 2026: Chevrolet falls to 70.2% share, BYD up to 13.4%
The Chazor Champion is BYD’s best-seller in Uzbekistan. The Uzbek new car market is down -5% year-on-year in September to...
2027 GMC Yukon Invoice Price, Dealer Cost, and What You Should Pay Near You
The 2027 GMC Yukon sits at the upper end of the full-size SUV market, with a lineup that runs from...
2027 Honda Civic Invoice Price, Dealer Cost, and What You Should Pay Near You
The Honda Civic has been America’s best-selling compact car for decades, and the 2027 lineup adds meaningful new content with...