
Netherlands May 2026: Kia Picanto, Tesla Model Y and Model 3 on top
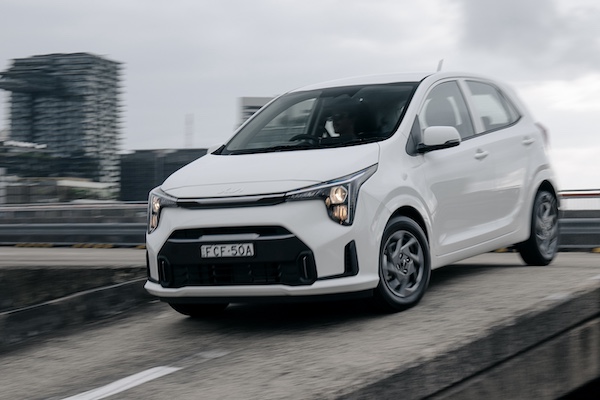
The Kia Picanto is the best-selling vehicle in the Netherlands in May.
The Dutch new car market edges up 1.1% year-on-year in May to 29,915 units. Yet the year-to-date volume remains in stark negative at -8% to 136,090. Hybrid vehicles hold 50.1% of the market with 15,002 sales, BEVs are at 41.3% with 12,363 units, petrol is at 6.9% with 2,075 and diesel at 1.1% with 324.
Strikingly, the Top 7 brands all beat the market. Kia (+7.1%) leads the way as usual with 11% share, well above the 9.8% it commands YTD. Toyota (+9.7%) and Volkswagen (+5.7%) ensure the podium is identical to last month and YTD, with Renault (+29.6%) very strong at #4. Volvo (+1.8%) rounds out the Top 5 in discreet but still market-beating fashion. BMW (+5.7%) follows ahead of Tesla (+31.2%) up nine spots on April to #7. In contrast Skoda (-46.4%) is in complete freefall at #8. Notice also Leapmotor (+813.7%) surging to #18.
This month the Kia Picanto (-7.9%) is the most popular model in the country for the first time since last August. The Tesla Model Y (+9.9%) and Model 3 (+66.1%) complete the podium, the former up 7 spots on April and the latter up 75. The Kia EV3 (-15.6%) is in difficulty at #4 while the Toyota Aygo X (+18.5%) closes out the Top 5. The new Kia EV5 is up 9 ranks to a record 6th place and now ranks #13 year-to-date. Excellent performances for the Renault Clio (+94.3%) and Hyundai Kona (+48.2%). #1 a year ago, over the Full Year 2025 and last month, the Skoda Elroq (-59.8%) implies to #12.
Previous month: Netherlands April 2026: Skoda Elroq back to #1, Toyota C-HR+ inside Top 10
One year ago: Netherlands May 2025: Skoda Elroq best-seller
Full May 2026 Top 58 All brands and Top 334 All models below.
Netherlands May 2026 – brands:
PosBrandMay-26%/25Apr2026%/25PosFY251Kia3,30311.0%+ 7.1%113,3479.8%– 19.7%112Toyota2,5428.5%+ 9.7%210,2947.6%– 0.2%243Volkswagen2,3577.9%+ 5.7%310,0317.4%– 1.5%324Renault1,9946.7%+ 29.6%57,9235.8%– 0.2%555Volvo1,8576.2%+ 1.8%76,9465.1%– 17.3%776BMW1,7545.9%+ 5.7%98,0305.9%– 12.0%467Tesla1,3874.6%+ 31.2%164,5283.3%– 7.2%12108Skoda1,2904.3%– 46.4%47,4965.5%– 11.7%639Audi1,2554.2%+ 3.3%65,9564.4%– 1.0%9910Hyundai1,1583.9%– 8.1%86,2364.6%– 12.1%8811Peugeot1,1353.8%– 5.1%105,9004.3%– 11.8%101212Mercedes9953.3%– 11.2%115,1893.8%– 10.6%111313Opel8602.9%– 11.8%134,2083.1%– 3.3%141414Ford7032.3%– 38.1%124,2713.1%– 34.9%131115Citroen5741.9%– 20.4%152,8482.1%– 18.4%151516BYD5491.8%+ 73.2%142,5241.9%+ 87.8%172217Suzuki5141.7%– 4.3%182,5901.9%– 15.7%161618Leapmotor4661.6%+ 813.7%271,3171.0%+ 420.6%253419Dacia4571.5%– 7.5%172,2151.6%+ 0.2%201720Seat4521.5%+ 13.6%192,2221.6%+ 9.5%192121Mazda3841.3%+ 35.7%202,4481.8%+ 3.2%181922Mini3711.2%+ 11.7%231,9031.4%– 24.3%211823Cupra3171.1%+ 3.9%211,4751.1%– 4.0%222024Jaecoo2881.0%new301,3531.0%new234025Nissan2740.9%– 39.5%241,3191.0%– 43.6%242326Jeep2720.9%+ 27.7%251,2080.9%+ 20.2%273127MG2580.9%– 33.2%221,0420.8%+ 3.0%302828Lynk & Co2190.7%– 40.2%281,1110.8%+ 10.3%282729Land Rover2030.7%+ 0.5%261,2920.9%– 26.4%262530Mitsubishi1700.6%– 25.8%311,1110.8%– 41.4%292431Fiat1580.5%– 45.9%299300.7%+ 8.9%323032Porsche1460.5%– 29.1%329340.7%– 34.3%312933Polestar1240.4%– 7.5%334340.3%– 41.6%372634Lexus1150.4%+ 22.3%364950.4%– 9.7%353535Omoda1150.4%new385820.4%new334636Honda1070.4%+ 64.6%355690.4%+ 47.0%343737Xpeng940.3%– 17.5%374050.3%– 12.9%383338Smart890.3%+ 56.1%402180.2%+ 0.5%403839Zeekr870.3%– 43.9%344900.4%+ 19.2%363240Alfa Romeo360.1%– 64.0%393150.2%– 28.6%393641DS250.1%– 44.4%431800.1%+ 2.3%414142Subaru250.1%+ 2400.0%56430.0%+ 53.6%475543Alpine190.1%– 26.9%411110.1%+ 33.7%424244Bentley140.0%– 12.5%42790.1%– 26.2%434445Lamborghini110.0%+ 22.2%44570.0%+ 72.7%444846Lucid100.0%+ 42.9%55200.0%– 13.0%545247Dongfeng90.0%– 30.8%46530.0%– 83.2%453948Ferrari80.0%– 55.6%49390.0%– 40.0%484749Changan60.0%new48260.0%new51 –50Abarth50.0%– 16.7%51250.0%– 21.9%524951Voyah50.0%+ 150.0%54240.0%+ 4.3%535452Lancia40.0%– 60.0%45490.0%– 29.0%464553NIO40.0%– 20.0%47390.0%– 15.2%494354Aston Martin30.0%+ 200.0%52170.0%+ 21.4%555855SsangYong/KGM30.0%+ 0.0%53300.0%+ 50.0%505056Genesis20.0%new50120.0%new57 –57Lotus20.0%+ 0.0% –100.0%– 47.4%585658Maserati10.0%– 50.0%5830.0%– 72.7%6159 –Others2901.0%– 36.5% –1,5061.1%– 9.2% – –
Netherlands May 2026 – models:
PosModelMay-26%/25Apr2026%/25PosFY251Kia Picanto7372.5%– 7.9%22,6371.9%– 23.1%342Tesla Model Y7122.4%+ 9.9%102,6992.0%+ 4.7%233Tesla Model 36712.2%+ 66.1%781,7821.3%– 21.2%1284Kia EV36342.1%– 15.6%52,3281.7%– 58.6%425Toyota Aygo X6152.1%+ 18.5%33,3452.5%+ 33.6%156Kia EV55131.7%new151,7041.3%new131837Hyundai Kona4891.6%+ 48.2%42,2711.7%+ 19.9%5158Renault Clio4801.6%+ 94.3%291,6911.2%+ 10.2%14169VW Tiguan4531.5%+ 4.1%161,6091.2%– 11.6%151110Kia Niro4421.5%– 29.1%71,9991.5%– 34.8%9711Toyota Yaris4421.5%– 6.4%211,3591.0%– 32.4%24912Skoda Elroq4391.5%– 59.8%12,0551.5%– 8.7%8113Toyota Yaris Cross4151.4%– 33.8%81,9501.4%– 19.6%10614Volvo EX304021.3%– 9.0%381,3471.0%– 41.9%261015Skoda Kodiaq3861.3%+ 0.5%122,2341.6%– 3.2%61416Ford Kuga3841.3%+ 10.7%62,2291.6%– 0.7%71217VW T-Roc3741.3%+ 181.2%261,1360.8%+ 60.2%309118Renault 53701.2%+ 87.8%171,5601.1%+ 4.7%161319Toyota C-HR+3541.2%new98780.6%new50 –20Peugeot 20083531.2%+ 15.4%281,8021.3%+ 33.0%113421Volvo V603251.1%+ 10.5%531,0460.8%– 13.6%374722Volvo XC603141.0%+ 23.6%201,3671.0%– 3.5%223323Peugeot 2082981.0%+ 36.7%141,4101.0%– 36.8%201724Volvo EX402961.0%+ 23.3%111,3661.0%+ 12.5%232425BMW iX32871.0%+ 2291.7%547160.5%+ 274.9%6721626Seat Ibiza2851.0%+ 86.3%451,1640.9%+ 22.1%285327Audi Q4 e-tron2740.9%– 2.5%258500.6%– 42.5%532028Opel Frontera2600.9%+ 88.4%301,0930.8%+ 322.0%335929BMW iX12420.8%– 8.0%439490.7%– 43.0%422330Kia Sportage2390.8%+ 0.0%341,5131.1%+ 20.7%173731Opel Corsa2390.8%– 39.5%131,5131.1%– 29.6%182132VW ID.72380.8%+ 122.4%578140.6%+ 55.9%572933Renault Captur2320.8%– 31.6%241,1240.8%– 21.6%312734VW ID.32320.8%+ 85.6%279030.7%+ 0.3%483235Volvo XC402310.8%– 1.7%597870.6%+ 1.9%606536VW Golf2310.8%– 12.5%419810.7%– 22.4%413037Hyundai Inster2300.8%– 31.3%221,0150.7%– 39.4%392838Mercedes CLA-Class2280.8%+ 109.2%449300.7%+ 65.8%445039Audi A32190.7%– 2.2%359400.7%– 7.2%434340Citroen C32120.7%– 32.7%421,0630.8%– 52.1%361941Renault Scenic E-Tech2120.7%+ 15.8%636920.5%– 10.7%703842VW Tayron2120.7%+ 5.0%191,3521.0%+ 187.0%256343Hyundai Tucson2050.7%+ 34.0%328560.6%+ 6.3%526144Suzuki Swift2050.7%– 36.3%371,4571.1%– 22.8%191845Leapmotor B102000.7%new965500.4%new8120646Kia EV21940.6%new663200.2%new122 –47BYD Seal U1930.6%– 14.2%181,3681.0%+ 90.0%214648Peugeot 30081930.6%+ 27.8%649910.7%+ 9.0%404849Volvo XC901890.6%+ 39.0%616320.5%– 2.6%739350Citroen C3 Aircross1880.6%+ 20.5%497440.5%+ 122.8%658951Toyota Corolla Cross1820.6%– 7.1%478360.6%– 12.2%555252BMW X31810.6%+ 20.7%839200.7%+ 108.6%466053VW ID.41720.6%+ 48.3%468870.7%+ 27.8%492654Kia Stonic1700.6%+ 4.9%331,0660.8%+ 2.3%354555Jaecoo 71680.6%new1071,0750.8%new3416956BMW X11660.6%– 18.2%657980.6%– 16.0%585557Audi Q51650.6%+ 251.1%985990.4%+ 487.3%7514258Audi Q31640.5%+ 1071.4%231,1410.8%+ 640.9%2918559Mini1620.5%– 12.0%551,0330.8%– 9.4%384060Leapmotor T031610.5%+ 666.7%1234480.3%+ 154.5%9614361BMW 3-Series1600.5%+ 15.9%797670.6%+ 1.7%637362Toyota Urban Cruiser1580.5%new1153880.3%new109 –63BMW 5-Series1550.5%– 26.2%719040.7%– 18.0%475464Mercedes GLC-Class1550.5%– 11.4%608360.6%+ 35.7%548265Lynk & Co 011540.5%– 56.0%1057230.5%– 23.7%665666Renault Symbioz1520.5%– 29.0%687850.6%– 0.4%615167Ford Puma1490.5%– 49.5%311,1020.8%– 20.4%323168Peugeot 50081490.5%+ 6.4%368740.6%+ 27.8%515769Citroen C5 Aircross1440.5%– 0.7%865650.4%+ 126.0%7914770Renault Megane E-Tech1440.5%+ 56.5%584850.4%+ 26.3%898171Suzuki e-Vitara1440.5%new1173260.2%new120 –72BYD Atto 21430.5%+ 1091.7%1702740.2%+ 813.3%13623073Opel Grandland X1420.5%+ 102.9%1105230.4%+ 68.2%8310774Audi Q6 e-Tron1410.5%– 8.4%624460.3%– 62.4%973975BMW 1-Series1400.5%+ 0.0%747610.6%– 12.2%646676Dacia Bigster1380.5%+ 411.1%976530.5%+ 546.5%718077Jeep Avenger1370.5%– 14.4%397830.6%+ 8.6%627578Skoda Enyaq1370.5%– 36.3%507130.5%– 0.7%683579VW Polo1360.5%– 63.1%939210.7%– 51.6%452280Toyota C-HR1310.4%– 37.0%1214960.4%– 45.4%884981Kia EV41300.4%new816460.5%new7213982Renault 41290.4%+ 12800.0%485800.4%+ 5172.7%7714083Jeep Compass1280.4%+ 433.3%893940.3%+ 191.9%10820784Seat Leon1170.4%– 27.8%527030.5%+ 3.5%696285Dacia Duster1160.4%+ 5.5%1034360.3%– 25.1%1009786Opel Astra1160.4%– 60.7%1064070.3%– 62.6%1036887Nissan Qashqai1150.4%– 24.3%518160.6%– 16.0%566788Suzuki Vitara1140.4%– 13.6%875530.4%– 27.3%807689Mazda 21110.4%+ 76.2%1446080.4%+ 20.4%748490Skoda Octavia1110.4%– 39.7%567900.6%– 21.8%594491Mazda CX-51070.4%+ 568.8%404620.3%– 36.3%9412592Mini Aceman1060.4%+ 12.8%1163700.3%– 47.7%1135893Leapmotor C101050.4%+ 250.0%1243190.2%+ 314.3%12418694Jaecoo 51040.3%new1532110.2%new16333495Nissan Micra1040.3%new1912370.2%new15327396Mini Countryman1030.3%+ 90.7%915000.4%– 24.8%877497BMW X51020.3%– 9.7%853490.3%– 30.1%1159298Renault Twingo1020.3%new1991280.1%new201 –99MG ZS1000.3%– 3.8%733320.2%– 1.2%118135100Dacia Sandero970.3%– 46.4%824370.3%– 31.8%9979101Toyota Corolla960.3%– 19.3%843830.3%– 32.2%11087102Mercedes A-Class950.3%– 4.0%755130.4%– 16.9%8495103Mercedes GLA-Class910.3%+ 56.9%774670.3%+ 73.0%93124104Renault Austral910.3%– 22.9%704750.3%– 33.5%9170105Audi A5890.3%– 1.1%695360.4%+ 73.5%82101106Toyota bZ4X860.3%+ 68.6%1014730.3%+ 37.5%92123107Kia K4850.3%new –850.1%new223 –108Cupra Terramar830.3%– 25.2%724820.4%+ 1.0%9098109Peugeot 308830.3%– 75.1%1095020.4%– 52.3%8664110Opel Mokka820.3%+ 20.6%805760.4%+ 28.3%78117111Dacia Jogger800.3%– 48.4%765080.4%– 14.3%85100112Omoda 5790.3%new1413200.2%new123294113Skoda Kamiq780.3%– 55.7%675970.4%– 20.1%7671114Mercedes EQA770.3%– 31.9%993950.3%– 29.3%10788115Cupra Tavascan720.2%+ 80.0%1282730.2%– 5.2%13990116MG HS720.2%+ 89.5%902610.2%+ 151.0%142198117BMW i4690.2%– 17.9%1124220.3%– 37.8%10177118Cupra Leon680.2%+ 44.7%1551930.1%– 17.2%171156119Mazda 6e670.2%new1572850.2%new129155120Mercedes C-Class670.2%– 23.9%1643290.2%– 29.9%119106121Range Rover Sport650.2%– 1.5%1004000.3%– 33.9%105104122Ford Tourneo/Transit Custom640.2%– 30.4%1562590.2%– 29.2%144149123Fiat 500600.2%+ 39.5%1022810.2%+ 40.5%131196124Hyundai Ioniq 6600.2%+ 650.0%1501390.1%+ 110.6%196228125Polestar 4600.2%+ 36.4%1361900.1%– 29.4%173102126VW ID.Buzz600.2%+ 27.7%1311690.1%+ 4.3%179159127BYD Dolphin Surf590.2%new1332100.2%new166188128Cupra Born590.2%– 19.2%882970.2%– 7.5%12885129Audi A6 e-tron560.2%– 72.1%1132990.2%– 50.7%12741130Mercedes E-Class560.2%– 33.3%1353700.3%– 22.8%112126131Skoda Fabia560.2%– 61.9%1204210.3%– 19.5%10286132Mercedes GLE-Class530.2%+ 23.3%1403150.2%+ 39.4%125157133Renault Espace530.2%– 37.6%1512640.2%– 15.9%140131134Xpeng G6530.2%– 32.9%1672110.2%– 31.9%165108135Mitsubishi Colt520.2%+ 15.6%1592170.2%– 61.9%161115136Peugeot 408520.2%+ 100.0%1452740.2%– 14.4%138152137Porsche Macan520.2%– 32.5%1622780.2%– 51.1%135113138Smart #5520.2%+ 188.9%2101030.1%+ 472.2%213219139BMW i5510.2%– 26.1%1393990.3%– 8.3%10694140Land Rover Defender510.2%+ 6.3%1182740.2%– 29.9%137127141Suzuki SX4 S-Cross510.2%– 32.0%1302490.2%– 33.8%149132142Toyota bZ4X Touring510.2%new –510.0%new248 –143Polestar 2500.2%– 30.6%1292010.1%– 52.7%16878144Kia EV9480.2%– 46.7%1632290.2%– 19.4%156137145Audi A6470.2%+ 6.8%1112790.2%+ 60.3%133161146VW Caddy470.2%+ 34.3%1791540.1%+ 102.6%188164147Mercedes GLB460.2%+ 557.1%1691490.1%+ 175.9%190246148Mitsubishi Outlander460.2%– 49.5%1663490.3%– 13.8%116120149BMW IX2430.1%– 40.3%1751660.1%– 57.1%181119150BYD Atto 3430.1%+ 53.6%2131100.1%– 59.6%209168151Fiat 600430.1%– 79.2%1961930.1%– 55.1%172133152Kia EV6430.1%– 74.6%1871630.1%– 69.1%18299153Porsche Cayenne430.1%– 29.5%1193750.3%– 13.8%111138154Seat Arona430.1%+ 186.7%1942130.2%+ 36.5%162167155VW Passat430.1%– 18.9%1272500.2%– 16.9%148141156Zeekr 7X430.1%– 59.8%943260.2%+ 181.0%121122157Hyundai Ioniq 5420.1%– 31.1%1522190.2%– 41.6%160112158Volvo EC40420.1%+ 0.0%1541940.1%– 17.8%170134159Skoda Superb410.1%– 61.7%1143630.3%– 2.4%114114160Xpeng G9410.1%+ 28.1%1611850.1%+ 32.1%174193161BYD Seal 6400.1%new1382530.2%new146264162Range Rover 400.1%– 9.1%1652200.2%– 10.9%159175163Lynk & Co 08390.1%new1042560.2%new145222164BMW 2-Series Gran Coupe380.1%– 9.5%1722010.1%– 23.3%167145165Mazda CX-60380.1%– 46.5%1782510.2%– 30.9%147105166Honda Jazz370.1%+ 54.2%1771600.1%+ 60.0%184202167Omoda 9360.1%new1982620.2%new141265168BMW 4-Series350.1%+ 16.7%2221050.1%– 45.9%211191169Cupra Formentor350.1%+ 2.9%1462300.2%+ 5.5%154150170Ford Explorer EV350.1%– 80.9%954390.3%– 64.2%9836171Porsche 911350.1%– 14.6%1841740.1%– 18.3%177192172BYD Seal340.1%+ 112.5%1371520.1%+ 1.3%189184173Ford Mustang Mach-E340.1%+ 36.0%208910.1%– 52.8%219162174Lexus RZ340.1%+ 183.3%1891010.1%+ 57.8%214240175VW Multivan340.1%– 40.4%2201270.1%– 19.6%203163176VW T-Cross340.1%– 75.9%1602440.2%– 61.6%15296177Hyundai Santa Fe330.1%+ 230.0%1971470.1%– 31.3%191170178Kia PV5330.1%new1471540.1%new186309179Kia Sorento330.1%– 28.3%1881570.1%+ 0.0%185189180Lexus LBX330.1%– 10.8%1681680.1%– 34.1%180165181Volvo EX90330.1%– 74.6%228630.0%– 83.3%235116182VW Taigo330.1%– 59.3%2072600.2%– 10.7%143129183Audi Q2320.1%– 22.0%1422220.2%– 21.6%158153184BYD Sealion 7320.1%+ 166.7%1801400.1%+ 508.7%195199185Hyundai i10310.1%– 88.0%921,1980.9%– 23.2%2725186Hyundai i20310.1%– 60.8%1341330.1%– 52.2%197136187Alfa Romeo Junior 300.1%– 54.5%1322840.2%– 12.3%130128188Fiat Grande Panda300.1%+ 25.0%1224030.3%+ 1200.0%104130189Mercedes Sprinter300.1%– 53.8%1582450.2%– 9.9%151154190Range Rover Evoque300.1%+ 57.9%1812480.2%– 7.8%150172191MG 3290.1%– 51.7%1481980.1%– 6.6%169146192Mitsubishi ASX290.1%– 65.5%1832300.2%– 53.6%155110193Mazda CX-30280.1%– 54.1%2184540.3%+ 17.9%95103194Nissan Juke280.1%– 65.4%1252110.2%– 71.4%164111195Lexus NX270.1%+ 0.0%2151200.1%– 12.4%206200196Dacia Spring260.1%+ 23.8%1491810.1%– 38.4%175109197Lynk & Co 02260.1%+ 62.5%1731320.1%+ 123.7%198187198Renault Rafale 260.1%– 38.1%2191270.1%– 44.5%202176199Audi Q7250.1%+ 19.0%1761300.1%+ 15.0%199205200Fiat Panda250.1%+ 38.9%223470.0%– 73.0%255197201Mazda 3240.1%– 33.3%2302790.2%+ 58.5%134151202Mitsubishi Grandis240.1%new2042250.2%new157255203Volvo ES90240.1%new2401230.1%new204315204Citroen C4 X220.1%+ 100.0%1951200.1%+ 192.7%205261205Ford Tourneo/Transit Connect220.1%+ 266.7%267320.0%+ 166.7%269321206Mercedes Vito220.1%– 8.3%1821290.1%– 14.6%200174207Skoda Karoq220.1%– 42.1%1741690.1%– 34.0%178166208BMW iX210.1%– 34.4%2351100.1%+ 34.1%208190209Honda HR-V210.1%+ 50.0%1711420.1%+ 1.4%193212210Smart #3210.1%+ 133.3%217660.0%– 25.8%232210211Skoda Scala200.1%– 67.7%1861540.1%– 49.0%187144212Zeekr 7GT200.1%new335210.0%new282 –213Audi A1190.1%– 57.8%1083050.2%– 3.8%126148214Audi Q8190.1%– 60.4%1431790.1%– 20.8%176158215Hyundai Bayon190.1%– 5.0%2001610.1%+ 1.3%183195216Mitsubishi Eclipse Cross190.1%+ 137.5%193900.1%– 50.5%221203217Honda Civic 180.1%+ 100.0%2361040.1%+ 215.2%212251218Subaru Uncharted180.1%new180.0%new288 –219Zeekr 001180.1%– 21.7%202840.1%– 24.3%224177220Mercedes B-Class170.1%– 56.4%231970.1%– 51.7%217182221VW Touareg170.1%– 10.5%211640.0%+ 16.4%234232222VW Transporter170.1%+ 1600.0%303660.0%+ 3200.0%233347223Honda CR-V160.1%+ 14.3%241990.1%+ 30.3%216217224Jaecoo 8160.1%new126680.0%new230 –225MG 4 Urban160.1%new234280.0%new272 –226Smart #1160.1%– 46.7%252490.0%– 55.5%251215227Alpine A290150.1%– 40.0%192900.1%+ 15.4%220201228BMW 2-Series Active Tourer150.1%– 51.6%212910.1%– 49.4%218178229Mercedes EQB150.1%– 83.0%2371430.1%– 77.4%19272230Polestar 3140.0%– 22.2%232420.0%– 14.3%260234231Ford Capri130.0%– 80.3%2031000.1%– 46.2%215118232VW California130.0%– 45.8%206590.0%– 6.3%238226233DS No.8120.0%+ 200.0%271880.1%+ 2100.0%222296234Hyundai Ioniq 9120.0%new185700.1%new229249235MG S6120.0%new239430.0%new258 –236Nissan Ariya120.0%– 94.0%190660.0%– 84.7%231173237Bentley Continental110.0%– 8.3%221610.0%– 24.7%237241238Land Rover Discovery Sport110.0%+ 10.0%2241090.1%– 26.8%210214239BMW 4-Series Gran Coupe100.0%n/a253480.0%n/a252n/a240BMW X2100.0%+ 11.1%254550.0%– 38.2%244220241Honda Prelude100.0%new282260.0%new275 –242Lamborghini Urus100.0%+ 900.0%246490.0%+ 512.5%249266243Lexus UX100.0%+ 233.3%273350.0%+ 0.0%265254244Dongfeng Box90.0%– 30.8%249530.0%– 83.2%245160245Lexus RX90.0%– 10.0%225560.0%+ 47.4%243252246Lucid Gravity 90.0%new298180.0%new287381247MG S590.0%new209760.1%new225223248Nissan X-Trail90.0%– 47.1%216710.1%– 32.4%228227249Mercedes CLE-Class80.0%– 46.7%275570.0%– 36.7%242237250MG S980.0%new259140.0%new298 –251Porsche Panamera80.0%– 46.7%256510.0%– 56.0%247218252Toyota RAV480.0%– 93.3%2051130.1%– 79.0%20783253BMW XM70.0%– 53.3%264480.0%– 56.8%253225254Citroen C4 70.0%– 88.7%2142800.2%– 39.5%132121255Jeep Wrangler70.0%– 22.2%283300.0%– 9.1%271258256Mercedes EQE70.0%– 65.0%299420.0%– 56.7%259211257MG Cyberster70.0%+ 75.0%285170.0%– 29.2%290293258Seat Ateca70.0%– 89.7%2011420.1%– 41.1%194179259Alfa Romeo Tonale60.0%– 81.8%280310.0%– 72.1%270235260BMW 7-Series60.0%– 14.3%262460.0%+ 2.2%256247261DS 7 Crossback60.0%– 82.4% –180.0%– 81.8%286213262Mazda CX-8060.0%– 62.5%226710.1%– 44.5%227208263Nissan Leaf60.0%n/a –60.0%– 92.9%328263264Opel Combo60.0%n/a328120.0%+ 50.0%304306265Peugeot Expert60.0%– 66.7%243350.0%– 64.6%266242266Porsche Taycan60.0%– 40.0%248520.0%– 31.6%246243267Range Rover Velar60.0%– 60.0%244400.0%– 57.9%261236268Zeekr X60.0%– 76.0%269590.0%– 67.9%239194269Abarth 60050.0%– 16.7%304170.0%– 10.5%289297270BMW X750.0%+ 0.0%263260.0%+ 36.8%274292271BMW Z450.0%– 54.5%233440.0%+ 25.7%257269272Changan Deepal S0550.0%new265150.0%new291 –273DS No.450.0%new250620.0%new236283274Honda ZR-V50.0%+ 66.7%229370.0%+ 2.8%262279275Hyundai i3050.0%+ 0.0%255250.0%– 66.2%276256276MG 450.0%– 89.1%238730.1%– 53.2%226171277Subaru e-Outback50.0%new –50.0%new336 –278Audi e-Tron GT40.0%+ 300.0%258220.0%+ 100.0%278281279Lancia Ypsilon40.0%– 60.0%247490.0%– 29.0%250231280Mercedes EQE SUV40.0%– 76.5%276340.0%– 78.8%267204281Nio Firefly40.0%new260330.0%new268284282Bentley Bentayga30.0%+ 0.0%290110.0%– 8.3%305323283BYD Dolphin30.0%– 87.0%308100.0%– 91.7%311244284Mazda MX-530.0%– 57.1%274360.0%+ 2.9%263267285Mercedes EQS30.0%– 66.7%300190.0%– 34.5%284259286Mercedes EQS SUV30.0%– 62.5%268150.0%– 59.5%294268287Mercedes S-Class30.0%– 85.7%277200.0%– 71.8%283250288Opel Vivaro30.0%– 66.7%242580.0%– 28.4%241224289Ssangyong/KGM Torres30.0%+ 0.0%278220.0%+ 10.0%279272290Tesla Model X30.0%+ 0.0% –250.0%+ 19.0%277290291Toyota Proace30.0%+ 200.0%30270.0%+ 0.0%324280292Voyah Free30.0%+ 200.0%287100.0%– 52.4%313305293Alpine A11020.0%+ 100.0% –80.0%+ 60.0%316342294Alpine A39020.0%new245130.0%new299 –295BMW 2-Series20.0%– 86.7%291270.0%– 46.0%273260296BMW i720.0%– 50.0%270470.0%+ 20.5%254274297BYD Han20.0%n/a –20.0%+ 100.0%356408298DS 3 Crossback20.0%+ 100.0%31170.0%– 66.7%323286299Ferrari 29620.0%– 50.0%31450.0%– 72.2%331291300Ferrari 849 Testarossa20.0%new –20.0%new358 –301Ferrari Purosangue20.0%– 60.0%295110.0%– 8.3%309343302Ford Transit/Tourneo20.0%n/a272150.0%+ 25.0%292328303Kia Ceed20.0%– 98.9% –3320.2%– 69.6%11742304Lexus ES20.0%– 60.0%320150.0%– 11.8%293287305Lotus Emeya20.0%+ 100.0% –60.0%– 45.5%327339306Mercedes G-Class20.0%– 88.2%251360.0%– 65.0%264229307Porsche 718 Cayman20.0%n/a –40.0%– 60.0%348336308Voyah Courage20.0%new333130.0%new301341309Aston Martin DB1210.0%n/a28870.0%+ 40.0%321355310Aston Martin Valhalla10.0%new –10.0%new373 –311Aston Martin Vanquish10.0%+ 0.0%30660.0%+ 50.0%326357312Audi A810.0%– 75.0%28980.0%– 33.3%317327313BMW 8-Series10.0%+ 0.0%29280.0%– 63.6%318307314BMW X410.0%– 50.0%293100.0%– 37.5%310316315Changan Deepal S0710.0%new –110.0%new306 –316Citroen SpaceTourer10.0%+ 0.0% –20.0%+ 0.0%357378317Ferrari 12Cilindri10.0%+ 0.0%313110.0%+ 83.3%308349318Ferrari F8010.0%new –20.0%new360 –319Genesis GV6010.0%new29650.0%new334 –320Genesis GV7010.0%new29740.0%new341 –321Hyundai Nexo10.0%n/a –20.0%n/a361 –322Lamborghini Temerario10.0%new –40.0%new343392323Lucid Air10.0%– 85.7%32120.0%– 91.3%362289324Maserati Grecale10.0%+ 0.0%32320.0%– 71.4%363350325Mercedes SL-Class10.0%– 75.0% –50.0%– 66.7%335324326Opel Movano10.0%n/a227150.0%n/a295 –327Opel Zafira Life10.0%n/a –20.0%n/a367414328Subaru Forester10.0%+ 0.0% –20.0%– 88.2%371322329Subaru Solterra10.0%n/a286150.0%+ 150.0%296340330Tesla Model S10.0%– 50.0%301220.0%+ 22.2%280303331Toyota Prius10.0%– 66.7% –90.0%– 76.3%314277332Volvo V9010.0%– 97.5%332210.0%– 81.6%281180333VW Crafter10.0%– 80.0%334190.0%– 48.6%285271334VW ID.510.0%– 83.3% –60.0%– 90.5%329253
Source: BOVAG

More Stories
Taiwan May 2026: Toyota Corolla Cross, RAV4 and Tesla Model Y dominate
Toyota RAV4 sales are up 49.5% in May. 33,076 new cars hit Taiwanese roads in May, a 3.7% year-on-year improvement....
Iceland May 2026: Smart #5 and BMW iX3 inside Top 10
The Smart #5 is up to 6th place in April. It’s another difficult month for the Icelandic new car market,...
Italy May 2026: Leapmotor T03 threepeats at #3, BYD Atto 2 up to #5
The Leapmotor T03 ranks #3 again in Italy. New car sales in Italy grow by a very healthy +7.6% year-on-year...
Spain May 2026: BYD (+85.7%) breaks records at 4% share
The BYD Atto 2 is up to a record 13th place in April. The Spanish new car market is uncharacteristically...
2027 Toyota GR86 Gets Sharper Without More Power and That’s Perfectly Fine
Toyota is giving enthusiasts another reason to appreciate one of the last affordable rear-wheel-drive sports cars on the market. Unveiled...
How Dangerous U.S. Intersection Design Can Lead to Legal Claims Beyond Driver Fault
Image Source When a crash happens at an intersection, the instinct is often to assign blame to one of the...