
Why Americans Pay High Gas Prices Despite Record U.S. Oil Production and Exports
By Stephen Zogopoulos, USNN World News
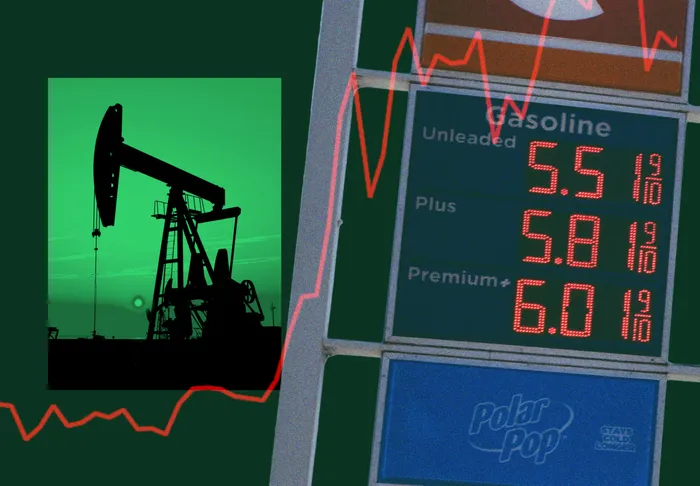
The Paradox at the Pump
As of early May 2026, U.S. regular gasoline prices have climbed above $4.50 per gallon nationally amid disruptions from the U.S.-Israeli conflict with Iran and the closure of the Strait of Hormuz. Some regions see even higher figures, with California nearing or exceeding $6 in spots. This stings for American drivers, especially given robust domestic production. The U.S. hit record crude oil output around 13.6 million barrels per day (b/d) in 2025, with strong exports in recent years (averaging over 4 million b/d in prior peaks, though slightly down in 2025).
Yet pump prices remain elevated. Why? The U.S. is not fully insulated from global markets, refining bottlenecks persist, taxes add up, and recent geopolitical shocks matter more than many assume.
U.S. Imports: Minimal Reliance on Venezuela and Iran
The premise that the U.S. acquires no oil from Venezuela or Iran needs correction for accuracy. Direct imports from Iran have been near zero for years due to sanctions (historically negligible, often under 1% or effectively banned).
Venezuela supplies more, especially heavy crude suited to certain Gulf Coast refineries. In 2024-2025 data, Venezuela accounted for a small but notable share—around 2-3% of U.S. crude imports in recent tallies, with surges at times (e.g., higher volumes in early 2026 under policy shifts). Canada dominates (~50-60% of crude imports), followed by Mexico and others. Middle East Gulf sources were only about 8% in 2025.
Overall, the U.S. is a net exporter of petroleum products and has been energy-independent in broader terms, but it still imports specific grades for refining optimization while exporting lighter domestic crude.
Global Supply Dynamics: OPEC, UAE Exit, and Disruptions
OPEC (now reduced after the UAE’s exit effective May 1, 2026) traditionally influences prices through production quotas. With Venezuela and Iran as members (Iran heavily impacted by conflict), and the UAE departing to pursue higher output independently, the cartel appears weakened—down to about 11 members.
In theory, this plus high U.S. production should yield excess supply and lower prices. However, the Iran-related conflict has disrupted the Strait of Hormuz (a chokepoint for ~20% of global oil), causing immediate price spikes regardless of U.S. self-sufficiency. Global oil is fungible; U.S. exports go to the world market, and imports (or displaced supply) respond to international prices. Sanctions, wars, and logistics prevent perfect isolation.
U.S. crude exports reached records in 2024 and remained strong, but 2025 saw a slight dip amid shifting global flows. Domestic refiners sometimes compete with export demand for barrels.
Refineries: Capacity, Ownership, and Utilization
The U.S. has approximately 131-132 operable refineries as of early 2025, with total atmospheric crude distillation capacity around 18.4 million b/cd—largely stable but down from historical highs due to closures and conversions (e.g., to renewables).
Utilization rates hover near or above 90% in recent weeks, indicating they are at or near capacity, especially amid maintenance or regional issues.
Ownership: Major players are publicly traded companies, often with significant institutional (Wall Street) investors—e.g., Marathon Petroleum (MPC), Valero Energy (VLO), HF Sinclair, ExxonMobil, Chevron, and Phillips 66. These are not “owned by Wall Street” in a shadowy sense but by shareholders, including pension funds, ETFs, and investors seeking returns. Refining margins (crack spreads) can be highly profitable during tight supply, leading to accusations of profiteering.
Fewer, larger, more efficient refineries handle complex crudes, but this concentration creates bottlenecks. Environmental regulations, aging infrastructure, and limited new builds exacerbate constraints. Regional mismatches (e.g., California’s isolated market and strict fuel standards) drive higher local prices.
Taxes and “Profit Taking”
Federal gas tax is 18.4 cents/gallon (unchanged for decades). State averages add ~33 cents, varying widely (California highest at ~70+ cents including fees; Alaska lowest). Total taxes often exceed 50 cents/gallon nationally, higher with sales taxes or programs like California’s Low Carbon Fuel Standard.
Suspending federal (and ideally state) gas taxes could provide relief and test the “profit taking” hypothesis. If prices drop mostly by the tax amount with stable or rising refiner margins, it supports claims of limited pass-through from crude costs. However, refiners argue high utilization, export competition, and compliance costs justify margins. Crude oil typically comprises ~50-55% of pump price, with refining profits, distribution, marketing, and taxes making up the rest.
Opinion: The Real Drivers and Path Forward
Americans face “astronomical” prices not primarily from Venezuelan/Iranian imports (minimal direct impact) but from a mix of global shocks (Iran conflict dominating recently), domestic refining limits, high taxes in some states, and market dynamics where U.S. producers optimize globally. Record production and exports are successes of shale innovation, yet they don’t guarantee low domestic pump prices due to fungible markets and infrastructure realities.
OPEC’s weakening (UAE exit signals fractures) could eventually boost supply, but geopolitics overrides. Blaming “oil companies” alone ignores that integrated majors and refiners respond to incentives; heavy regulation and underinvestment in capacity contribute. Suspending taxes would be a transparent experiment—relief for consumers and clarity on margins.
Policymakers should prioritize permitting for refining expansions/upgrades, strategic reserves management, and all-of-the-above energy (including renewables where viable) to build resilience. Consumers feel the pain regardless of production records when disruptions hit or bottlenecks persist. Transparency in margins, competitive refining, and lower tax burdens where fiscally responsible could align better with energy dominance goals.
Sources include EIA reports on exports, imports, refining capacity, and gasoline prices; Reuters/BBC on OPEC/UAE; Tax Foundation on taxes; and market data as of May 2026. Markets move fast—check EIA.gov for updates.
Disclaimer: This is an opinion-based analysis drawing on publicly available data from the U.S. Energy Information Administration (EIA) and other sources. It aims for honesty and balance rather than partisanship. Energy markets are complex, involving global geopolitics, domestic infrastructure limits, corporate profits, and policy choices. Prices fluctuate, and no single factor explains everything. Readers should consult primary sources for the latest figures.


More Stories
Netflix’s Upcoming Drama, All the Truth in My Lies: Release Date, Cast, and More
Excited to know about the upcoming Spanish drama on Netflix, All the Truth in My Lies. If you love watching...
Obsession (2026): Release Date, Cast Members, Trailer, Plot, and More
Be Alert: Spoilers Ahead! Are you also a lover of horror shows and looking for upcoming horror movies and series...
Desire 2026: Release Date, Cast Members, Trailer, Audio, and More
Netflix is expanding its international movie lineup with intense action, thriller, and drama that explore the complexities of human emotions....
AI Assistants Overwhelmingly Cite Third-Party Lists, Not Company Homepages, Study Finds
Artificial intelligence assistants overwhelmingly cite third-party “best-of” and comparison pages rather than companies’ own websites, according to a new study...
How Businesses are Incorporating AI Video Into Sales Processes
Over the last few years, businesses have had to rethink their traditional sales processes. Consumers are more empowered to complete...
Margaret and Jack got separated after 3 Years of Marriage!
For everyone who is searching for the recent trendy news about the separation of Margaret Qualley and Jack Antonoff, here...