
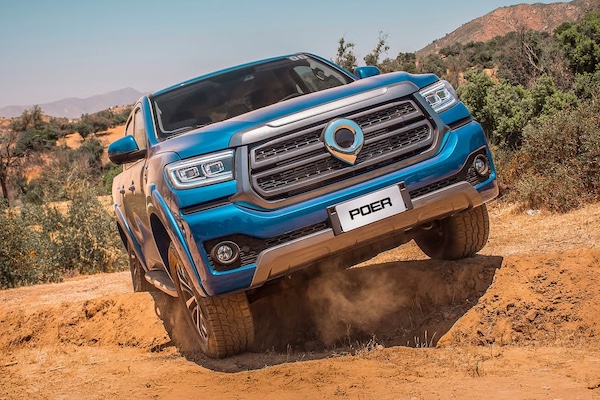
Chile March 2026: GWM Poer now #1 year-to-date
The GWM Poer is the best-selling vehicle in Chile over Q1 2026.
27,358 new light vehicles hit Chilean roads in March, a solid 14% year-on-year gain. The Q1 volume is now up 5.8% to 74,977 units. Toyota (+22.9%) repeats at #1 and reclaims the YTD top spot off Suzuki (-1.9%) skidding this month. Hyundai (+1.7%) and Kia (+4.1%) are soft but Ford (+22.4%) advances three spots on last month to round out the Top 5. MG (+65%), Changan (+30.2%) and GWM (+24.5%) post the largest gains in the Top 10. Below, Jetour (+160.7%), Maxus (+44.2%) and Omoda+Jaecoo (+27.5%) prove the Chinese continue to expand their footprint in Chile. In fact, the 33 Chinese brands present here add up to 34.4% share for the month thanks to sales up 36.5% to 9,401.
Over in the models charts, the GWM Poer (+38.5%) repeats at #1 and also snaps the YTD top spot in the process. The MG ZX (the previous generation ZS) triples its sales year-on-year and climbs to a record 2nd place. The Ford Ranger (+60.9%) also excels and is up five ranks on last month to #3, distancing the Chery Tiggo 2 (-15%) down on a winning year-ago performance. The Suzuki Fronx (+125.7%) and Swift (+59.5%) impress below.
Previous month: Chile February 2026: GWM Poer leads, MG ZX up to #3
One year ago: Chile March 2025: Chery Tiggo 2 surprise best-seller
Full March 2026 Top 67 All brands and Top 30 models below.
Chile March 2026 – brands:
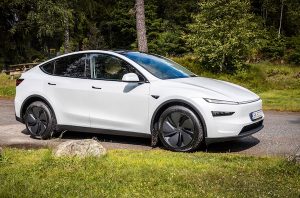
PosBrandMar-26%/25Feb2026%/25PosFY251Toyota 2,1727.9%+ 22.9%15,7817.7%+ 9.0%112Suzuki1,9027.0%– 1.9%25,6937.6%+ 0.8%233Hyundai 1,7966.6%+ 1.7%34,9526.6%+ 4.8%324Kia 1,5745.8%+ 4.1%44,5726.1%– 1.9%445Ford 1,4905.4%+ 22.4%83,8745.2%+ 7.0%766Chevrolet 1,4325.2%+ 1.3%63,9505.3%– 7.2%657GWM1,4315.2%+ 24.5%54,2025.6%+ 25.5%578Peugeot 1,3745.0%+ 2.8%73,3734.5%– 11.5%889ChangAn1,1434.2%+ 30.2%93,2574.3%+ 19.1%9910MG1,0333.8%+ 65.0%102,8023.7%+ 32.2%111211Mazda9263.4%+ 21.5%122,4653.3%+ 14.7%121112Chery8873.2%+ 2.8%132,1882.9%+ 8.3%131313Mitsubishi8383.1%+ 3.7%112,8583.8%– 6.2%101014Jetour6572.4%+ 160.7%171,6672.2%+ 98.7%162215Maxus6432.4%+ 44.2%151,6122.1%+ 7.5%171616Omoda+Jaecoo5892.2%+ 27.5%161,5982.1%+ 28.7%182017Volkswagen5842.1%+ 15.4%181,7332.3%+ 27.0%151518JAC5722.1%+ 42.3%141,7512.3%+ 58.5%141919Subaru5271.9%– 10.4%201,4301.9%– 10.5%191720Foton5091.9%+ 22.1%211,3271.8%+ 9.0%211821Citroen4311.6%– 31.8%251,1531.5%– 40.5%221422Geely4251.6%+ 137.4%191,3551.8%+ 251.0%202423Ram3821.4%– 2.3%221,0381.4%+ 6.9%232324Tesla3561.3%+ 408.6%315370.7%+ 101.9%293825BMW3311.2%+ 48.4%267010.9%+ 5.4%263026Nissan3291.2%– 39.0%239011.2%– 44.3%242127Jeep2791.0%+ 329.2%286430.9%+ 219.9%283228Mercedes2601.0%+ 29.4%247691.0%+ 28.4%252729BYD2480.9%+ 112.0%334630.6%+ 49.8%323530JMC2380.9%+ 24.6%276790.9%+ 2.4%272631DFM1880.7%+ 16.0%325230.7%+ 13.9%303132DFSK1610.6%– 19.9%295180.7%– 19.8%312933Opel1420.5%– 56.6%373360.4%– 65.9%362834Volvo1360.5%+ 9.7%392690.4%– 12.4%383635Kaiyi1210.4%+ 181.4%382820.4%+ 90.5%373736GAC Motor1130.4%– 25.2%343840.5%– 27.7%343337Honda1120.4%– 29.6%353360.4%– 30.9%353438Audi820.3%+ 12.3%362350.3%+ 27.7%393939Renault 810.3%+ 72.3%461560.2%– 9.3%424440KGM/Ssangyong800.3%– 66.2%304400.6%– 42.2%332541Exeed740.3%+ 94.7%411880.3%+ 113.6%404742Landking600.2%+ 62.2%421490.2%+ 79.5%434943Lexus580.2%+ 81.3%501130.2%+ 15.3%455144Cupra520.2%+ 6.1%431700.2%+ 38.2%414245Riddara500.2%+ 1566.7%59830.1%+ 84.4%526646Skoda440.2%+ 22.2%51870.1%– 5.4%495347Leapmotor360.1%new49840.1%new506448Mini330.1%– 26.7%45830.1%– 5.7%515049Dongfeng320.1%+ 10.3%551080.1%+ 24.1%464350Porsche320.1%+ 52.4%58670.1%+ 11.7%545751BAIC310.1%+ 1450.0%44960.1%+ 380.0%476852Fiat310.1%– 20.5%47950.1%– 33.1%484653Land Rover310.1%+ 3.3%48790.1%+ 8.2%535454Karry310.1%– 35.4%63530.1%– 64.9%584555Shineray230.1%– 23.3%60640.1%– 28.9%564856Mahindra190.1%– 82.2%401370.2%– 56.9%444157Soueast190.1%new62340.0%new628358ZX Auto180.1%+ 63.6%53650.1%+ 0.0%555659Lynk & Co180.1%+ 80.0%52610.1%+ 117.9%575860SWM160.1%– 54.3%61490.1%– 52.4%605261JIM160.1%– 40.7%66300.0%– 53.8%655562Smart150.1%+ 200.0%64360.0%+ 620.0%616363KYC110.0%– 76.6%56490.1%– 72.0%594064DS60.0%– 53.8%67130.0%– 68.3%676165Livan40.0%+ 300.0%57310.0%+ 416.7%647066Nammi40.0%+ 100.0%54240.0%+ 700.0%665967Ferrari20.0%n/a6890.0%+ 125.0%6973 –Others180.1%+ 1700.0% –410.1%+ 583.3% – – –Total Chinese9,40134.4%+ 36.5% –25,70434.3%+ 26.1% – –
Chile March 2026 – models:
PosModelMar-26%/25Feb2026%/25PosFY251GWM Poer7122.6%+ 38.5%12,1712.9%+ 30.8%132MG ZX6182.3%+ 204.4%31,6042.1%+ 144.1%4243Ford Ranger6102.2%+ 60.9%81,5332.0%+ 24.3%794Chery Tiggo 25822.1%– 15.0%71,3861.8%– 10.8%855Suzuki Fronx5802.1%+ 125.7%61,5482.1%+ 87.4%6166Mitsubishi L2005522.0%+ 11.7%22,0562.7%– 2.6%227Suzuki Swift5121.9%+ 59.5%171,1611.5%+ 27.0%12238Peugeot Partner5091.9%– 24.4%41,5752.1%– 5.5%549Toyota Hilux5071.9%– 5.1%51,6482.2%– 6.6%3110Mazda CX-54941.8%+ 22.3%111,2571.7%+ 28.5%101211Kia Soluto4561.7%+ 20.3%91,2821.7%+ 5.3%9712Omoda C54521.7%+ 17.4%101,2361.6%+ 19.4%111113GWM Jolion4401.6%+ 19.2%121,1591.5%+ 11.8%141014Maxus T604041.5%+ 48.5%181,0071.3%+ 6.0%151315Chevrolet Sail4011.5%+ 57.3%149951.3%+ 30.7%181816Ford Territory3841.4%+ 36.7%211,0051.3%+ 6.6%161717Hyundai Creta3671.3%+ 25.7%169901.3%+ 18.0%192018Kia Sonet3641.3%n/a131,1591.5%n/a131919Hyundai Grand i103291.2%+ 1.5%199951.3%+ 0.8%171420Toyota Raize3151.2%+ 24.0%208401.1%+ 42.9%212721Subaru Crosstrek3091.1%+ 34.3%278221.1%+ 39.6%222622Geely Coolray3021.1%n/a159481.3%n/a203123Toyota Yaris2791.0%+ 63.2%237661.0%+ 45.1%263024MG ZS2681.0%+ 81.1%268051.1%+ 34.8%243325Toyota Yaris Cross2651.0%+ 2.3%306770.9%– 23.7%312226Toyota Corolla Cross2641.0%n/a286850.9%n/a303427Toyota RAV42631.0%+ 0.8%n/a6160.8%– 27.7%322128Hyundai Tucson2410.9%– 11.7%297631.0%+ 9.9%271529Ram 700 Pickup2360.9%– 0.4%325380.7%+ 3.9%n/a3230Citroen Berlingo2200.8%– 24.7%n/a3750.5%– 59.1%n/a28n/aChangan X7 Plus2150.8%+ 23.6%227301.0%+ 16.1%2829n/aHyundai Porter2050.7%– 34.3%244980.7%+ 3.5%n/an/an/aSuzuki Celerio2020.7%+ 38.4%n/a5720.8%+ 50.9%n/an/an/aChevrolet Groove2010.7%– 53.1%258191.1%– 37.5%238n/aKia Frontier1870.7%+ 16.1%n/a3650.5%– 16.3%n/an/an/aHyundai Staria1810.7%+ 64.5%n/a3140.4%+ 28.7%n/an/an/aTesla Model 31610.6%n/an/a2460.3%n/an/an/an/aChevrolet Silverado1560.6%+ 6.1%n/a4670.6%+ 0.4%n/an/an/aFord F-1501530.6%– 6.7%n/a4140.6%+ 17.6%n/a35n/aSuzuki Jimny1510.6%n/a316920.9%n/a2925n/aChevrolet Colorado1500.5%+ 4.2%n/a3670.5%– 18.3%n/an/an/aChevrolet N400 Max1490.5%+ 69.3%n/a3490.5%+ 30.2%n/an/an/aSuzuki Baleno1410.5%– 76.4%n/a7741.0%– 54.0%256n/aSuzuki Alto1380.5%+ 56.8%n/a2470.3%– 9.5%n/an/an/aChangan Hunter1360.5%+ 1.5%n/a3090.4%– 22.2%n/an/an/aFord Transit1220.4%+ 8.0%n/a2600.3%– 12.2%n/an/an/aKia Morning1210.4%– 47.4%n/a4240.6%– 29.2%n/an/an/aJMC Grand Avenue1180.4%+ 5.4%n/a3860.5%– 9.0%n/an/an/aJMC Vigus1160.4%+ 65.7%n/a2730.4%+ 29.4%n/an/an/aHyundai Accent1090.4%– 26.8%n/a4250.6%– 9.8%n/an/an/aFoton G71060.4%– 15.2%n/a3150.4%– 9.5%n/an/an/aRam Rampage1000.4%+ 49.3%n/a3720.5%+ 49.4%n/an/an/aJAC Sunray990.4%+ 90.4%n/a3230.4%+ 73.7%n/an/an/aFoton Midi960.4%+ 62.7%n/a1710.2%– 27.5%n/an/an/aGWM Wingle 7930.3%– 19.8%n/a3180.4%+ 43.9%n/an/an/aMazda3930.3%n/an/a2840.4%n/an/an/an/aNissan Versa880.3%+ 22.2%n/a2120.3%– 30.3%n/an/an/aHyundai Grand i10 Sedan870.3%n/an/a2000.3%n/an/an/an/aSuzuki Dzire Sedan840.3%n/an/a2450.3%n/an/an/an/aFoton TM5830.3%– 3.5%n/a1750.2%– 29.7%n/an/an/aMercedes Sprinter820.3%– 22.6%n/a3250.4%– 1.2%n/an/an/aMG3810.3%– 27.7%n/a2100.3%– 25.5%n/an/an/aFoton TM3750.3%+ 4.2%n/a1590.2%– 27.4%n/an/an/aVW Polo750.3%– 9.6%n/a1470.2%– 30.0%n/an/an/aChangan Alsvin740.3%+ 5.7%n/a1980.3%– 9.6%n/an/an/aChevrolet Montana720.3%– 36.3%n/a2390.3%– 19.8%n/an/an/aJAC T8 Pro720.3%+ 41.2%n/a2270.3%+ 56.6%n/an/an/aPeugeot Boxer690.3%– 28.9%n/a1640.2%– 36.9%n/an/an/aPeugeot 208650.2%– 28.6%n/a1760.2%– 51.6%n/an/an/aMaxus Deliver 9650.2%+ 0.0%n/a1650.2%– 17.5%n/an/an/aPeugeot Rifter510.2%– 38.6%n/a1460.2%– 46.5%n/an/an/aVW Saveiro500.2%– 43.2%n/a2690.4%+ 10.2%n/an/an/aPeugeot Traveller470.2%n/an/a960.1%n/an/a –n/aFoton Miler450.2%+ 15.4%n/a850.1%– 5.6%n/an/an/aPeugeot Expert440.2%n/an/a1520.2%n/an/an/an/aFord Maverick420.2%n/an/a1760.2%n/an/an/an/aLandking LK3320.1%n/an/a790.1%n/an/an/an/aMaxus C35300.1%n/an/a1290.2%n/an/an/an/aFoton Furgon FT120.0%n/an/a750.1%n/an/an/an/aKGM Grand Musso60.0%– 94.9%n/a2170.3%– 53.0%n/an/a
Source: ANAC

More Stories
2027 Toyota Tundra Trailhunter Brings Factory Off-Road Upgrades to the SR5
Toyota is giving the 2027 Tundra a tougher personality with the addition of a new Trailhunter package, bringing factory-backed off-road...
Trump Adds 50 Percent Tariffs on Canadian Goods as Auto Trade Fight Escalates
The trade fight between the United States and Canada is escalating again, and the auto industry is right in the...
U.S. Automakers Race to Remove Chinese Connected-Car Hardware as New Federal Rules Loom
The U.S. auto industry is entering another major supply-chain shift, and this one reaches deep into the electronics that make...
Portugal June 2026: Sales up 13.6%, Dacia and Tesla break volume records
Dacia posts its first 2,000+ sales month in Portugal. Another solid result for new car sales in Portugal, up 13.6%...
Cadillac CT5-V Blackwing Successor Reportedly Planned as Next-Gen Super Sedan Takes Shape
Cadillac’s CT5-V Blackwing may not be heading quietly into history after all. While the current-generation CT5-V Blackwing is set to...
What to Do if You Bought a Defective Vehicle
Buying a new car can be life-changing to some, but a major liability to others who unknowingly bought a lemon....