
Ireland August 2025: Skoda and Octavia lead, BYD Sealion 7 up to #5
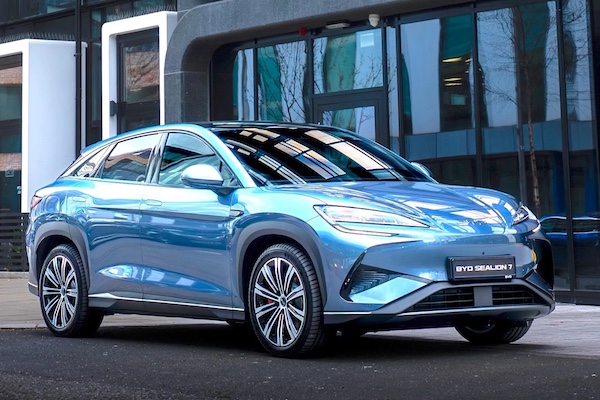
The new Sealion 7 helps BYD crack the Irish Top 10 in August.
Irish new car sales edge up 0.9% year-on-year in August to 7,615 units, meaning the year-to-date tally remains in positive territory at +3.4% to 116,099. This month Skoda (+7.5%) snaps the brands top spot with a fantastic 14% share vs. 9.9% so far this year. This is Skoda’s first win since February 2024. For its part Kia (-21.9%) is up three spots on last month to #2 despite a drastic YoY fall, followed by Volkswagen (-21.2%) also in a bad way. Toyota (-15.7%) is pushed down to #4 but remains #1 year-to-date with Hyundai (-11.6%) rounding out the Top 5. In contrast the next four carmakers are in outstanding shape. Audi (+33.3%) is at #6 ahead of BMW (+142.9%), BYD (+243.3%) lodging its first ever Irish Top 10 finish at #8 and Cupra (+370.6%), also in the Top 10 for the first time. Tesla is off -36.6% to #10.
Model-wise, the Skoda Octavia (+11.8%) snaps the lead above the Kia Sportage (-8.3%). The Skoda Kodiaq (-32.3%) rounds out the podium but suffers from a particularly high year-ago basis when it led the charts outright. Still faraway leader year-to-date, the Hyundai Tucson (-24.9%) falls to #4 in August. Launched in April, the new BYD Sealion 7 storms into the Top 5 whereas it ranked #106 last month. It distances the Toyota Yaris Cross (-13.1%) and another new model: the Skoda Elroq scoring its maiden Top 10 finish in Ireland. The VW ID.4 (+41.8%) also impresses at #9 while the Tesla Model Y (+106.8%) is up to #14 with 1.6% share, more than double its YTD level of 0.7% (#44).
Previous month: Ireland July 2025: Hyundai Tucson stays on top despite -37.6% fall
One year ago: Ireland August 2024: Skoda Kodiaq lodges first ever win
Full August 2025 Top 37 All brands and Top 220 All models below.
Ireland August 2025 – brands:
PosBrandAug-25%/24Jul2025%/24PosFY241Skoda1,06514.0%+ 7.5%311,4419.9%– 0.1%332Kia80210.5%– 21.9%59,1057.8%+ 6.1%553Volkswagen6989.2%– 21.2%213,44111.6%+ 6.3%224Toyota6778.9%– 15.7%115,97613.8%– 2.1%115Hyundai6158.1%– 11.6%411,2429.7%+ 4.6%446Audi5006.6%+ 33.3%84,5683.9%– 8.0%767BMW4766.3%+ 142.9%104,7044.1%+ 12.9%688BYD3334.4%+ 243.3%142,2932.0%+ 76.8%14199Cupra2403.2%+ 370.6%132,0201.7%+ 63.8%182010Tesla2323.0%– 36.6%241,9541.7%– 10.0%191411Ford2142.8%– 18.6%113,8323.3%– 2.9%12912Mercedes2072.7%+ 27.8%152,5742.2%– 10.2%131313Dacia1912.5%+ 11.7%63,9743.4%+ 4.9%101114Seat1752.3%+ 25.0%192,1311.8%– 22.4%171515Peugeot1391.8%– 44.8%74,1473.6%+ 0.7%81016MG1301.7%+ 103.1%221,3771.2%+ 38.8%212317Renault1191.6%– 23.2%94,0513.5%+ 18.5%91218Volvo1121.5%+ 30.2%171,8291.6%+ 9.0%201819Nissan1061.4%– 6.2%123,9593.4%– 18.5%11720Suzuki1001.3%– 28.6%212,1911.9%+ 13.5%151721Citroen1001.3%+ 53.8%181,1061.0%+ 5.7%242222Lexus751.0%– 18.5%201,1991.0%+ 34.9%232423Opel710.9%+ 10.9%162,1441.8%– 9.2%161624Mini490.6%+ 88.5%276020.5%+ 33.8%262725Mazda410.5%– 16.3%231,3001.1%+ 4.3%222126Land Rover340.4%– 48.5%257940.7%– 12.0%252527Honda240.3%– 53.8%263890.3%+ 81.8%283028Porsche190.2%– 50.0%283810.3%+ 14.4%292829Polestar190.2%+ 46.2%291350.1%– 14.6%322930Xpeng130.2%new301310.1%new33 –31Jeep110.1%+ 0.0%311950.2%+ 80.6%313232Fiat70.1%– 53.3%345380.5%– 1.1%272633Alfa Romeo70.1%+ 600.0%32690.1%+ 56.8%353634Leapmotor60.1%new –60.0%new40 –35SsangYong30.0%+ 50.0%36450.0%+ 9.8%363436Alpine30.0%n/a35230.0%+ 666.7%374237Smart20.0%+ 0.0% –2140.2%+ 590.3%3037
Ireland August 2025 – models:
PosModelAug-25%/24Jul2025%/24PosFY241Skoda Octavia3214.2%+ 11.8%23,4363.0%– 17.7%222Kia Sportage2993.9%– 8.3%83,2832.8%– 10.2%433Skoda Kodiaq2373.1%– 32.3%102,6012.2%+ 15.1%794Hyundai Tucson2052.7%– 24.9%14,4303.8%– 13.1%115BYD Sealion2032.7%new1063600.3%new91 –6Toyota Yaris Cross1732.3%– 13.1%33,3462.9%+ 7.0%357Skoda Elroq1692.2%new256530.6%new56 –8VW Tiguan1692.2%– 41.9%92,4922.1%– 5.4%869VW ID.41562.0%+ 41.8%111,8661.6%+ 33.9%142110Hyundai Kona1502.0%– 25.0%72,4872.1%+ 2.6%9811Skoda Karoq1471.9%+ 48.5%211,4081.2%+ 5.5%202312Audi Q31341.8%+ 44.1%688050.7%– 29.5%422913Toyota Corolla1301.7%+ 68.8%52,6332.3%– 2.2%6714Tesla Model Y1221.6%+ 106.8%657940.7%– 24.2%442615Toyota Corolla Cross1181.5%– 40.4%161,9531.7%+ 8.4%131416Hyundai Inster1131.5%new179120.8%new33 –17Cupra Tavascan1101.4%new1333440.3%new9724018Tesla Model 31101.4%– 64.2%1191,1601.0%+ 3.3%251819Kia EV31021.3%new231,1721.0%new2422120Audi A3951.2%+ 30.1%368540.7%+ 14.5%363921Kia EV6921.2%– 8.9%379240.8%+ 34.5%314722VW T-Roc871.1%– 15.5%141,8321.6%+ 1.4%151523Kia Stonic841.1%– 15.2%407300.6%– 4.5%494424Toyota RAV4841.1%– 47.5%63,1572.7%– 5.1%5425BYD Seal U831.1%new221,1471.0%new2618226Kia Sorento791.0%– 26.2%319270.8%+ 21.7%304127BMW X1781.0%+ 387.5%487140.6%+ 65.3%506828Dacia Duster720.9%+ 28.6%181,4571.3%+ 12.9%192429Toyota C-HR710.9%– 1.4%121,9731.7%– 4.3%111230Ford Puma700.9%– 39.7%331,2671.1%– 16.1%231931Toyota Yaris690.9%– 5.5%131,9651.7%– 14.0%121032Seat Arona670.9%+ 67.5%867390.6%– 22.0%483433BMW X5660.9%+ 1000.0%738460.7%+ 67.2%385934VW Tayron650.9%new209200.8%new32 –35Audi A5620.8%n/a396670.6%+ 167.9%5411336Kia Picanto620.8%– 50.4%1014220.4%– 8.5%807237Audi A6610.8%– 7.6%467020.6%+ 8.5%514838Skoda Superb580.8%– 25.6%438680.7%– 1.3%343539VW Golf550.7%– 70.4%42,3632.0%+ 9.7%101140BMW X3540.7%+ 237.5%565770.5%+ 42.1%637741Dacia Sandero540.7%– 48.6%151,5991.4%– 18.2%171342BMW IX1530.7%+ 960.0%883630.3%+ 5.2%899243Kia Niro530.7%– 66.7%698210.7%– 26.4%403044Skoda Enyaq530.7%+ 60.6%356550.6%+ 23.6%556545Cupra Terramar510.7%new543630.3%new90 –46MGS5510.7%new –510.0%new194 –47Suzuki Swift500.7%– 40.5%706740.6%+ 37.6%536148VW ID.3490.6%+ 250.0%535630.5%+ 4.6%656049VW Polo490.6%– 36.4%241,3981.2%– 8.6%212050Ford Tourneo470.6%+ 571.4%983540.3%+ 1041.9%9517851Peugeot 3008470.6%– 52.5%191,6081.4%+ 29.1%162552Nissan Qashqai440.6%+ 51.7%271,5791.4%– 18.2%181653BMW 5-Series430.6%+ 330.0%518510.7%+ 2.9%373754Hyundai i20420.6%– 50.6%341,0820.9%– 21.9%272255Renault 5420.6%new522880.2%new111 –56BMW 3-Series410.5%+ 10.8%1152960.3%– 46.1%1085857Dacia Bigster400.5%new293560.3%new93 –58Seat Ibiza400.5%+ 60.0%1115520.5%– 7.7%675559Mercedes GLC380.5%+ 137.5%894150.4%+ 10.4%818860Volvo XC60380.5%+ 65.2%446140.5%+ 2.8%585261Skoda Fabia370.5%– 24.5%387910.7%– 1.2%454262BMW IX2360.5%+ 1100.0%1471000.1%+ 1011.1%16721163Seat Leon350.5%+ 66.7%1002960.3%+ 47.3%11011964Ford Focus340.4%– 55.8%558610.7%– 25.1%352865Hyundai Ioniq 5330.4%+ 135.7%325450.5%+ 19.0%697366Peugeot 2008330.4%– 17.5%267520.6%– 22.3%473367Peugeot 5008330.4%– 52.9%281,0470.9%+ 27.2%284068Seat Ateca330.4%– 13.2%905140.4%+ 5.3%726369Audi Q5310.4%– 44.6%923650.3%– 3.9%877970Audi Q4290.4%+ 52.6%1022320.2%– 46.3%1227471Citroen C3290.4%+ 383.3%120890.1%– 26.4%17014572Cupra Formentor290.4%+ 70.6%426010.5%+ 7.7%605673Lexus NX290.4%– 3.3%804290.4%+ 46.4%799474Mercedes GLA290.4%+ 31.8%1073560.3%– 14.0%947875MG HS290.4%n/a932520.2%+ 620.0%11719976Skoda Kamiq290.4%– 56.7%616350.5%– 36.5%573277Volvo EX40290.4%new842090.2%new129 –78Ford Kuga280.4%– 53.3%718090.7%– 29.7%412779Cupra Born270.4%+ 237.5%743110.3%+ 24.4%10510680Hyundai Santa Fe270.4%+ 107.7%675590.5%+ 557.6%6611281Mercedes E Class270.4%– 3.6%854650.4%– 9.4%746682MG4270.4%+ 50.0%1534570.4%– 20.5%755783Opel Mokka270.4%+ 8.0%575920.5%– 9.6%615084Nissan Juke260.3%– 16.1%301,3811.2%– 28.5%221785Opel Grandland X260.3%+ 550.0%495200.4%+ 87.1%7010586Suzuki Vitara260.3%+ 100.0%795830.5%– 6.9%625187Audi A1240.3%+ 41.2%1131950.2%+ 7.1%13212888Citroen Berlingo240.3%+ 4.3%1361990.2%– 3.4%13011189Suzuki SX4 S-Cross240.3%+ 14.3%1127980.7%+ 66.9%437090BMW 2-Series230.3%– 30.3%1252390.2%+ 4.4%11910791Ford Explorer230.3%new1093570.3%new9216792Mercedes C Class230.3%+ 109.1%1172450.2%+ 142.6%11815293BMW 1-Series220.3%+ 266.7%1272220.2%+ 26.9%12312494Lexus LBX220.3%– 51.1%783910.3%+ 46.4%889895Mini Cooper220.3%+ 1000.0%1413730.3%+ 233.0%8614996Mini Countryman220.3%+ 340.0%1431340.1%+ 22.9%15014497Renault Megane220.3%+ 57.1%872150.2%– 21.5%12710898Cupra Leon210.3%+ 40.0%633510.3%+ 6.4%969199VW T-Cross210.3%– 52.3%418330.7%+ 1.1%3938100Audi Q2200.3%+ 66.7%972350.2%+ 5.9%120116101BYD Seal200.3%– 62.3%814090.4%– 36.1%8249102Citroen C5 Aircross190.2%+ 72.7%1212960.3%+ 19.4%109110103Volvo XC90190.2%+ 137.5%763920.3%– 1.3%8583104VW ID.7190.2%– 42.4%913300.3%+ 41.6%101104105Kia Ceed180.2%– 75.0%666070.5%– 29.9%5936106Mercedes GLE180.2%+ 50.0%1101720.1%– 23.2%135117107Nissan Ariya180.2%+ 20.0%1222590.2%+ 14.1%113115108Nissan X-Trail180.2%– 14.3%944390.4%– 1.1%7875109Audi Q6 e-tron170.2%+ 183.3%1731340.1%+ 857.1%149214110BMW i4170.2%+ 30.8%1351820.2%– 6.2%146123111Renault Scenic170.2%+ 183.3%1292220.2%+ 318.9%124174112BYD Dolphin160.2%+ 33.3%1611150.1%– 58.3%160101113Citroen Multispace160.2%n/a821170.1%n/a159 –114Range Rover Sport150.2%– 42.3%1183300.3%– 20.5%10082115Toyota bZ4X150.2%+ 36.4%594530.4%+ 33.6%7687116Volvo EX30150.2%– 53.1%1573320.3%+ 7.4%9995117Dacia Jogger140.2%+ 40.0%644410.4%– 18.8%7762118Hyundai i10140.2%– 81.6%585010.4%+ 11.3%7367119Mercedes CLE Coupe140.2%+ 55.6%1461640.1%+ 10.1%138135120Peugeot Rifter140.2%+ 75.0%175800.1%– 27.3%176142121Renault Symbioz140.2%– 69.6%477750.7%+ 1584.8%46175122Skoda Scala140.2%– 39.1%834010.3%– 15.4%8471123Hyundai Ioniq 9130.2%new128580.0%new188 –124Kia EV9130.2%– 65.8%1162190.2%– 19.2%125103125Mercedes CLA130.2%– 23.5%952750.2%– 17.4%11290126MG ZS130.2%+ 30.0%963400.3%+ 81.8%98125127Polestar 4130.2%+ 1200.0%132750.1%+ 7400.0%179196128Xpeng G6130.2%new1311310.1%new152 –129Hyundai Bayon120.2%– 40.0%773280.3%– 20.2%10281130Mazda CX-30120.2%– 25.0%1032340.2%+ 6.8%121120131Audi A6 e-tron110.1%new –110.0%new247 –132Citroen C4110.1%– 8.3%1042570.2%+ 21.2%114121133Dacia Spring110.1%n/a1391210.1%n/a157256134Land Rover Defender110.1%+ 22.2%1261450.1%+ 8.2%145138135Mazda2110.1%+ 22.2%1301540.1%– 61.2%14185136Mercedes A Class110.1%n/a1501600.1%+ 700.0%139207137Mercedes EQB110.1%+ 175.0%232470.0%– 53.5%198147138Jeep Avenger100.1%+ 233.3%1801540.1%+ 148.4%140170139Lexus UX100.1%+ 400.0%163860.1%+ 62.3%172176140MG3100.1%– 47.4%1381670.1%+ 149.3%137161141Renault Austral100.1%– 28.6%1082990.3%– 43.6%10764142Toyota Prius100.1%+ 900.0%1561290.1%– 5.8%154137143VW ID.5100.1%+ 233.3%1421210.1%+ 22.2%158150144BMW 4-Series90.1%+ 350.0%193600.1%– 6.3%187169145BMW iX90.1%+ 350.0%208270.0%– 35.7%217206146Honda HR-V90.1%+ 12.5%1371350.1%+ 1400.0%147229147Lexus RX90.1%+ 80.0%1521300.1%– 9.1%153141148Porsche Macan90.1%n/a1851110.1%n/a163208149Audi Q780.1%– 52.9%1232170.2%+ 130.9%126151150BYD Dolphin Surf80.1%new –80.0%new255 –151Mercedes EQA80.1%n/a210430.0%– 25.9%200171152Opel Combo80.1%n/a183750.1%+ 1400.0%178248153Porsche Cayenne80.1%– 63.6%1551490.1%– 22.8%143126154BMW 7 Series70.1%n/a201380.0%– 5.0%203192155Fiat 60070.1%+ 40.0%176840.1%+ 110.0%173186156Volvo C40/EC4070.1%+ 40.0%166650.1%– 28.6%185155156VW ID.Buzz70.1%– 12.5%156530.0%– 29.3%191153157Honda Jazz60.1%– 76.9%1481130.1%+ 59.2%161165158Hyundai i3060.1%– 25.0%1142140.2%+ 0.9%128122159Mazda CX-8060.1%new1451090.1%new164234160Mazda360.1%+ 100.0%1401250.1%– 0.8%156143161Polestar 260.1%– 50.0%184520.0%– 66.2%193114162Renault Captur60.1%– 77.8%629320.8%+ 18.6%2943163Alfa Romeo Junior50.1%new168320.0%new211 –164BMW i550.1%+ 150.0%187640.1%+ 20.8%186181165Honda CR-V50.1%– 16.7%172470.0%+ 2.2%197188166Lexus ES50.1%– 50.0%1341310.1%– 1.5%151140167Mazda CX-6050.1%– 28.6%1491280.1%– 16.9%155130168Mercedes GLB50.1%– 80.8%1881680.1%+ 1.8%136129169Opel Astra50.1%– 61.5%993160.3%– 13.7%10489170Opel Corsa50.1%– 54.5%725660.5%– 26.6%6445171Peugeot 30850.1%+ 25.0%158840.1%– 49.1%174131172Range Rover 50.1%– 78.3%1541510.1%– 2.6%142139173Renault Arkana50.1%– 76.2%506780.6%– 36.5%5231174Audi Q840.1%– 55.6%1621030.1%+ 77.6%165173175BMW X240.1%+ 300.0%202270.0%– 38.6%218183176BMW X740.1%n/a203210.0%– 8.7%227215177BMW XM40.1%+ 300.0%194480.0%+ 220.0%196228178Ford Capri40.1%new1511020.1%new166 –179Leapmotor C1040.1%new –40.0%new273 –180Mercedes AMG GT40.1%n/a178430.0%+ 258.3%199218181Mercedes S Class40.1%+ 33.3%211350.0%– 23.9%209190182VW T740.1%+ 300.0%167830.1%+ 144.1%175195183VW Taigo40.1%– 50.0%605170.4%+ 64.6%7196184Alpine A29030.0%new179120.0%new242 –185BYD Atto 330.0%– 90.6%1692540.2%– 33.3%11584186Honda Civic30.0%– 70.0%165720.1%+ 22.0%182172187Mini Aceman30.0%new220380.0%new204 –188Peugeot 20830.0%– 78.6%1054080.4%+ 7.9%8386189Renault Rafale30.0%+ 0.0%160880.1%+ 72.5%171184190Ssangyong Torres30.0%+ 200.0%197280.0%+ 300.0%215241191Toyota Aygo X30.0%– 75.0%753210.3%– 21.7%10380192Toyota Land Cruiser30.0%n/a206280.0%n/a216 –193Alfa Romeo Giulia20.0%+ 100.0%214110.0%– 21.4%244236194Audi A720.0%+ 100.0%186260.0%– 29.7%220194195Cupra Ateca20.0%– 81.8%226500.0%– 47.4%195154196Ford Transit Custom20.0%+ 100.0%229200.0%+ 300.0%231253197Leapmotor T0320.0%new –20.0%new283 –198Peugeot 40820.0%– 83.3%1591460.1%– 55.6%14493199Peugeot 50820.0%– 50.0%237200.0%– 77.0%232159200Porsche Taycan20.0%+ 0.0%212270.0%– 60.9%219162201Smart #320.0%+ 100.0% –170.0%+ 41.7%237235202Volvo V6020.0%+ 100.0%192260.0%– 3.7%222205203VW Touareg20.0%– 60.0%171530.0%– 30.3%192166204Audi A810.0%n/a –90.0%– 40.0%250233205Audi e-Tron GT10.0%n/a20770.0%– 72.0%257209206BMW Z410.0%n/a21590.0%+ 200.0%251249207Citroen C4 X10.0%– 75.0%189290.0%+ 31.8%214198208Honda ZR-V10.0%– 50.0%209210.0%+ 110.0%229220209Jeep Compass10.0%– 87.5%177210.0%– 25.0%230203210Land Rover Discovery Sport10.0%+ 0.0%190730.1%– 14.1%181156211Mazda MX-510.0%+ 0.0%182370.0%+ 5.7%206201212Mercedes G Class10.0%n/a233120.0%+ 1100.0%243279213Mercedes GLS10.0%– 50.0%23650.0%– 28.6%265243214Mini Clubman10.0%– 90.9%191380.0%– 50.6%205160215Mini Convertible10.0%n/a204190.0%– 65.5%234180216Range Rover Evoque10.0%– 85.7%196650.1%– 13.3%184168217Range Rover Velar10.0%n/a213220.0%– 18.5%226187218Volvo EX9010.0%new164560.0%new189272219Volvo XC4010.0%– 94.1%1441350.1%– 47.5%148109220VW Caddy10.0%+ 0.0% –60.0%– 92.1%262163
Source: SIMI

More Stories
Ferrari Denies Claims That Buyers Must Order the Luce EV to Get Higher Models
Ferrari’s first fully electric vehicle, the Luce, has already become one of the most talked-about cars to come out of...
China new models May 2026: Audi E7X and Onvo L80 appear
Onvo L80 Now that May 2026 has been studied, let’s focus on the latest launches on the Chinese market. Once...
World Full Year 2025: Discover the Top 500 best-selling models (BSCB Exclusive)
This content is for members only. Visit the site and log in/register to read.
McLaren Marks a Historic Milestone with a Special Artura
McLaren Automotive has revealed a striking new limited-edition model: the McLaren Artura 1000GP by MSO. Created to celebrate McLaren Racing’s...
The ROI Equation, Fleet Longevity and Truck Parts Quality
The math of fleet management has changed. For years, deciding to replace an aging tractor was mainly about mileage, age,...
Electric Rides That Make Weekend Camping and Local Exploring Easier
Outdoor travel does not need to be far away When people think about outdoor travel, they often imagine long road...