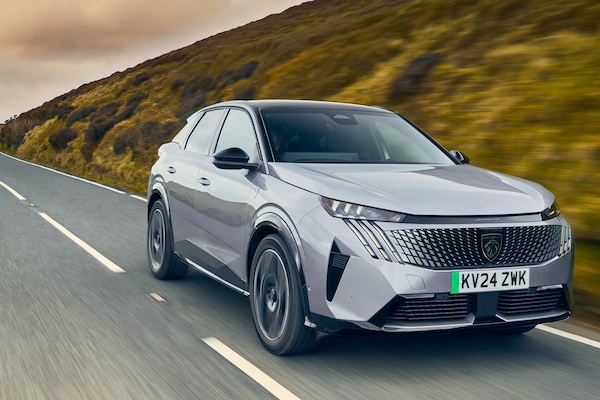
Europe November 2024: Peugeot (+17%), Renault (+13.2%), Toyota (+10.9%) stand out in negative market
Peugeot lodges the largest year-on-year gain among the Top 15 brands.
Figures by ACEA show a European market (EU+EFTA+UK) down a disappointing -2% year-on-year in November to 1,055,319. As a result the year-to-date tally is up a tepid 0.6% to 11,876,655. This is -18.3% or 2.66 million less than the same period in pre-pandemic 2019… Among the Top 5 markets, Spain is the only one in positive at +6.4%, Germany (-0.5%) is stable, the UK (-1.9%) matches the market but Italy (-10.8%) and France (-12.7%) struggle. Year-to-date, Spain is up 5.1%, the UK up 2.8%, Italy (-0.2%) and Germany (-0.4%) are almost immobile whereas France drops -3.7%. Among other markets in the region, for the month Estonia (+81.3%), Hungary (+28.4%), the Netherlands (+22%), Ireland (+21.4%), Lithuania (+19.1%) and Croatia (+18.3%) are the best performers, whereas at the other end of the scale Iceland (-61%), Belgium (-15.3%), Cyprus (-13.8%) and Switzerland (-10.5%) are all hit hard. Year-to-date, it’s Bulgaria (+16.2%), Poland (+14.5%), Croatia (+13%) and Hungary (+10%) that fare best, with Iceland (-41.6%), Finland (-17%) and Latvia (-9.7%) are at the bottom.
BEVs gain 0.5 percentage point (p.p.) to 17.5% share while PHEVs drop -0.6 p.p. to 7.9%. Year-to-date, BEVs drop -0.4 p.p. to 15.1% as do PHEVs to 7.2% share. In the detail by country, in the UK BEVs hold 25.1% share and PHEVs are at 10.2%, year-to-date BEVs hold 18.7% and PHEVs are at 8.5%. In France BEVs hold 17.4% with 8.4% for PHEVs in November while so far this year BEVs hold 17% and PHEVs 7.9%. Interestingly Germany does a worse, with BEVs at 14.4% and PHEVs at 8.4% and year-to-date BEVs are at 13.4% and PHEVs at 6.7%. Spain lags significantly behind with a BEV share at 6.9% and PHEV at 5.8% while the YTD figures are worse: BEV 5.3% and PHEV 5.7%. Finally Italy fares the worst of the Big Five with just 5.3% share for BEVs for November and 3.1% for PHEVs while year-to-date these figures are 4.1% and 3.3%.
In the groups ranking, the Volkswagen Group (+2.8%) is relatively solid in context, selling more than double its direct follower Stellantis (-10.8%) in a bad way again. The Renault Group (+9.2%) and Toyota Group (+12%) both post fantastic gains. Mercedes (+0.1%) and Volvo (+16.8%) are the only remaining groups in positive just as Ford Motor (-15.6%), Hyundai-Kia (-10.5%) and to a lesser extent the BMW Group (-4.3%) all disappoint.
Looking at brands, the Top 3 all defy the negative market with year-on-year gains. Volkswagen advances 5.4% to 11.2% share vs. 10.4% a year ago, Toyota soars 10.9% to 7.4% vs. 6.5% and Skoda is up 10% to 6.5% share vs. 5.7% in November 2023. BMW (-2.9%), which ranked #2 a year ago, is down to #4 this month. Mercedes (+4.3%) is solid at #5 while Renault (+13.2%) and Peugeot (+17%) both post excellent scores, the former improving from 5.1% to 5.9% share and the latter from 4.2% to 5%. Other Stellantis brands are not that lucky, with Fiat off -40.2%, Opel/Vauxhall down -19.6% and Lancia down -77.7%. Further down, notice Volvo (+16.8%), Cupra (+23.5%), Porsche (+28.3%) and Lexus (+27.1%).
Previous month: Europe October 2024: Skoda, Volvo, Volkswagen impress
One year ago: Europe November 2023: BMW up to #2, Skoda shines in market slowing down its growth
Full November 2024 Top 10 groups and Top 30 brands below.
Europe November 2024 – groups:
PosGroupNov-24/232024/23PosFY231Volkswagen Group286,552+ 2.8%3,119,194+ 2.2%112Stellantis142,425– 10.8%1,843,335– 7.4%223Renault Group111,697+ 9.2%1,152,424+ 1.9%334Toyota Group84,372+ 12.0%919,074+ 12.4%565BMW Group83,210– 4.3%839,770+ 2.0%656Hyundai-Kia79,744– 10.5%984,541– 4.4%447Mercedes62,332+ 0.1%629,529– 0.8%778Ford Motor32,729– 15.6%395,611– 17.3%889Volvo30,960+ 16.8%336,813+ 31.2%91010Tesla26,191– 28.4%282,691– 13.7%119
Europe November 2024 – brands:
Note: BYD may appear in the Top 30 but figures were not available at the time of publishing.
PosBrandNov-24/232024/23PosFY231Volkswagen117,994+ 5.4%1,258,324+ 1.3%112Toyota77,793+ 10.9%849,628+ 11.3%223Skoda68,119+ 10.0%700,748+ 12.0%474BMW67,783– 2.9%707,527+ 7.8%345Mercedes62,232+ 4.3%617,901+ 1.4%656Renault 62,057+ 13.2%626,719+ 1.8%567Peugeot52,803+ 17.0%595,867– 0.5%888Audi52,576– 14.7%612,540– 9.5%739Dacia49,352+ 4.8%522,013+ 2.0%91010Kia40,152– 8.4%494,725– 8.1%10911Hyundai39,592– 12.5%489,816– 0.4%111112Ford 32,729– 15.6%395,611– 17.3%121213Volvo30,960+ 16.8%336,813+ 31.2%141814Opel/Vauxhall28,492– 19.6%387,360– 9.3%131315Tesla26,191– 28.4%282,691– 13.7%181616Citroën25,101– 9.6%335,386– 3.5%151517Nissan22,294– 11.9%283,207+ 5.3%171718Cupra 20,115+ 23.5%198,615+ 10.4%212119MG19,536– 3.4%217,209+ 6.0%202020Seat17,708– 6.9%244,224+ 7.6%191921Fiat17,092– 40.2%290,354– 18.6%161422Mini15,426– 9.7%132,243– 20.7%242323Suzuki14,374– 8.5%189,367+ 10.0%222224Mazda12,381– 16.6%156,770– 6.6%232425Land Rover10,783+ 2.9%118,444+ 7.0%262626Jeep10,625– 1.3%121,495+ 3.3%252527Porsche9,439+ 28.3%97,257+ 5.5%272728Lexus6,579+ 27.1%69,446+ 27.3%292929Honda4,403– 19.6%70,115+ 24.9%282830Alfa Romeo4,285– 2.7%40,829– 12.4%3130
Source: ACEA


