Hungary November 2024: Strong market at +28%
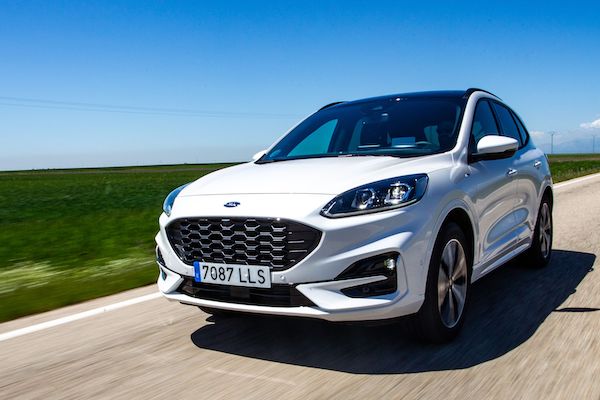
Ford Kuga sales are up three-fold year-on-year in November.
It’s a fantastic month for Hungarian new passenger car sales in November at +28% year-on-year to 10,647 units, meaning the year-to-date tally stands just below 110,000, a 10% year-on-year improvement. When adding light commercials, the market reaches 12,991 units for November (+26.1%) and 132,423 units year-to-date, up 11.4% over the same period in 2023. Suzuki (-3%) leads the PC brands ranking above Skoda (+29%) and Toyota (-4%). Ford (+164%) surges ahead to 7.2% share vs. 4.7% year-to-date. Other great performers include Jeep (+3900%), Renault (+292%), Cupra (+244%), Peugeot (+89%), Opel (+81%), Hyundai (+78%) and Lexus (+77%). Ford dominates the PC+LCV charts ahead of Suzuki, Toyota, Skoda and Volkswagen.
Model-wise, the Suzuki S-Cross (-8.6%) repeats at #1 but stays #2 year-to-date behind the Suzuki Vitara (-14.7%). The Skoda Octavia (+25.7%) also trails the market at #3. The Ford Ranger (+32.2%) is up eight spots on October to #4, followed by the Dacia Duster (+9.7%), Ford Kuga (+203.4%) and Toyota Corolla (+5.7%). The Ford Tourneo Custom (+375%), Suzuki Swift (+210.3%), Nissan Qashqai (+200%) and Ford Transit Custom (+148.1%) also impress below.
Previous month: Hungary October 2024: Suzuki reclaims lead in solid market
Full November and 11 months 2024 Top 25 brands and Top 140 models below.
Hungary November 2024 – brands (PC+LCV):
PosBrand PC+LCVNov-24Pos11m 2024%Pos1Ford1,463312,6229.3%32Suzuki1,376214,56911.0%23Toyota1,276116,14312.4%14Skoda1,144510,0987.5%55Volkswagen 998410,2127.7%4
Hungary November 2024 – brands (PC only):
PosBrand PC onlyNov-24%/23Oct11m 2024%PosFY231Suzuki1,37612.9%– 3%114,31110.8%122Skoda1,14410.7%+ 29%210,0987.6%333Toyota1,07510.1%– 4%312,9579.8%214Ford7667.2%+ 164%46,2434.7%565Volkswagen6826.4%+ 6%58,0836.1%446BMW5625.3%+ 17%n/an/an/an/a77Kia5505.2%+ 12%66,0394.6%65
Hungary November 2024 – brands (PC only):
PosBrand PC onlyNov-24%/231Suzuki1,37612.9%– 3%2Skoda1,14410.7%+ 29%3Toyota1,07510.1%– 4%4Ford7667.2%+ 164%5Volkswagen6826.4%+ 6%6BMW5625.3%+ 17%7Kia5505.2%+ 12%8Mercedes5124.8%+ 45%9Dacia3863.6%+ 30%10Renault3493.3%+ 292%11Hyundai3323.1%+ 78%12Nissan2962.8%+ 60%13Opel2892.7%+ 81%14Volvo2452.3%+ 7%15Audi2442.3%+ 10%16Peugeot2192.1%+ 89%17BYD1731.6%new18SsangYong1571.5%+ 11%19Lexus1401.3%+ 77%20Mazda1311.2%+ 20%21Tesla1231.2%– 25%22Jeep1201.1%+ 3900%23MG1191.1%– 20%24Cupra1171.1%+ 244%
Hungary November 2024 – models (PC+LCV):
PosModelNov-24%/23Oct11m 2024%/23PosFY231Suzuki S-Cross6054.7%– 8.6%15,9414.5%+ 15.5%212Suzuki Vitara5554.3%– 14.7%36,2894.7%+ 53.6%133Skoda Octavia5474.2%+ 25.7%25,5204.2%+ 6.7%324Ford Ranger3122.4%+ 32.2%122,1101.6%+ 24.3%10115Dacia Duster2722.1%+ 9.7%92,5862.0%+ 15.7%766Ford Kuga2642.0%+ 203.4%41,9831.5%+ 117.0%12317Toyota Corolla2602.0%+ 5.7%62,7332.1%– 9.3%648Kia Ceed2501.9%+ 4.6%82,8472.1%– 6.4%459Toyota Yaris Cross2141.6%+ 9.7%151,9741.5%– 2.3%13710Suzuki Swift2111.6%+ 210.3%101,7111.3%+ 109.9%173711Nissan Qashqai2041.6%+ 200.0%52,8102.1%+ 120.4%52012Renault Master1951.5%+ 17.5%391,7871.3%+ 4.6%161313Ford Transit Custom1911.5%+ 148.1%112,3961.8%+ 222.9%82114Ford Tourneo Custom1901.5%+ 375.0%191,3381.0%– 30.9%211015Kia Sportage1791.4%+ 45.5%71,8651.4%+ 31.6%151716Ford Transit1631.3%+ 0.0%141,3461.0%– 7.0%201517Skoda Superb1621.2%+ 62.0%241,0990.8%+ 24.5%273318Opel Corsa1581.2%+ 618.2%289850.7%– 20.0%322319VW Caddy1531.2%+ 106.8%436560.5%+ 8.6%525420VW Golf1521.2%+ 19.7%221,9161.4%+ 34.5%141621Toyota C-HR1261.0%+ 5.0%132,0841.6%+ 13.4%11922Hyundai Tucson1251.0%+ 73.6%291,4751.1%+ 21.2%192423Toyota Hilux1220.9%– 44.8%502,1401.6%+ 9.4%9824Skoda Kodiaq1190.9%+ 17.8%161,1370.9%– 3.4%262225VW Crafter1130.9%+ 189.7%326750.5%– 11.5%514526Audi A3 1120.9%+ 409.1%n/a6860.5%– 16.3%494027Toyota Yaris1110.9%– 17.8%171,5221.1%– 15.9%181228Ford Puma1100.8%+ 93.0%441,2430.9%+ 38.1%243429Ssangyong Korando1090.8%+ 28.2%371,0230.8%– 25.9%311930Toyota Corolla Cross1080.8%+ 17.4%331,3191.0%+ 23.7%232831Renault Express Van1080.8%+ 50.0%n/a6950.5%+ 0.9%485132Renault Clio1070.8%+ 1237.5%319240.7%+ 144.4%376833Mercedes Citan1050.8%+ 483.3%n/a3420.3%+ 25.7%9011234VW T-Roc1020.8%+ 32.5%279300.7%– 16.6%352735Opel Combo990.8%+ 312.5%206170.5%+ 55.4%567036Renault Captur900.7%+ 260.0%457480.6%+ 143.6%4410037Opel Astra880.7%+ 137.8%417990.6%+ 90.2%416938Mercedes GLC860.7%+ 230.8%409440.7%+ 64.2%345739VW Passat830.6%+ 3.8%361,1600.9%+ 10.0%252640Peugeot Boxer830.6%+ 144.1%n/a5360.4%+ 50.1%628641MG ZS790.6%– 21.8%n/a1,0460.8%+ 8.8%283042Volvo XC40770.6%+ 2.7%n/a7150.5%– 17.0%453543Opel Vivaro Tour760.6%+ 85.4%n/a3460.3%+ 5.5%899144Toyota Camry750.6%+ 87.5%n/a3500.3%– 23.9%876545Volvo XC60730.6%– 16.1%429040.7%+ 16.5%384146Fiat Ducato710.5%– 6.6%269290.7%– 18.0%362547Peugeot 2008700.5%+ 218.2%n/a5790.4%+ 18.2%606248Toyota Aygo X690.5%– 4.2%497560.6%+ 11.7%435049Tesla Model 3690.5%– 24.2%n/a6800.5%+ 88.4%508450BMW 5 Series680.5%+ 257.9%n/a4270.3%+ 29.8%7196
Hungary 11 months 2024 – models (PC+LCV):
PosModel11m 2024%/23PosFY231Suzuki Vitara6,2894.7%+ 53.6%132Suzuki S-Cross5,9414.5%+ 15.5%213Skoda Octavia5,5204.2%+ 6.7%324Kia Ceed2,8472.1%– 6.4%455Nissan Qashqai2,8102.1%+ 120.4%5206Toyota Corolla2,7332.1%– 9.3%647Dacia Duster2,5862.0%+ 15.7%768Ford Transit Custom2,3961.8%+ 222.9%8219Toyota Hilux2,1401.6%+ 9.4%9810Ford Ranger2,1101.6%+ 24.3%101111Toyota C-HR2,0841.6%+ 13.4%11912Ford Kuga1,9831.5%+ 117.0%123113Toyota Yaris Cross1,9741.5%– 2.3%13714VW Golf1,9161.4%+ 34.5%141615Kia Sportage1,8651.4%+ 31.6%151716Renault Master1,7871.3%+ 4.6%161317Suzuki Swift1,7111.3%+ 109.9%173718Toyota Yaris1,5221.1%– 15.9%181219Hyundai Tucson1,4751.1%+ 21.2%192420Ford Transit1,3461.0%– 7.0%201521Ford Tourneo Custom1,3381.0%– 30.9%211022Toyota RAV41,3251.0%– 10.9%221423Toyota Corolla Cross1,3191.0%+ 23.7%232824Ford Puma1,2430.9%+ 38.1%243425VW Passat1,1600.9%+ 10.0%252626Skoda Kodiaq1,1370.9%– 3.4%262227Skoda Superb1,0990.8%+ 24.5%273328MG ZS1,0460.8%+ 8.8%283029Tesla Model Y1,0410.8%+ 34.5%294230Hyundai i301,0310.8%+ 31.8%304631Ssangyong Korando1,0230.8%– 25.9%311932Opel Corsa9850.7%– 20.0%322333VW Tiguan9670.7%+ 37.7%334734Mercedes GLC9440.7%+ 64.2%345735VW T-Roc9300.7%– 16.6%352736Fiat Ducato9290.7%– 18.0%362537Renault Clio9240.7%+ 144.4%376838Volvo XC609040.7%+ 16.5%384139Opel Movano8740.7%+ 66.8%395840Mercedes Sprinter8440.6%+ 0.4%403841Opel Astra7990.6%+ 90.2%416942BMW X57680.6%+ 17.1%425243Toyota Aygo X7560.6%+ 11.7%435044Renault Captur7480.6%+ 143.6%4410045Volvo XC407150.5%– 17.0%453546Nissan X-Trail7050.5%+ 70.7%466747Hyundai i207030.5%+ 62.0%477148Renault Express Van6950.5%+ 0.9%485149Audi A3 6860.5%– 16.3%494050Tesla Model 36800.5%+ 88.4%508451VW Crafter6750.5%– 11.5%514552VW Caddy6560.5%+ 8.6%525453Volvo EX306280.5%new53 –54BMW 3 Series6200.5%+ 11.7%545655Fiat 5006190.5%– 56.7%551856Opel Combo6170.5%+ 55.4%567057Citroen Jumper6150.5%+ 101.6%57n/a58Hyundai Kona6080.5%+ 76.7%589259Toyota Proace City 5950.4%+ 1.5%595360Peugeot 20085790.4%+ 18.2%606261Ford Focus5560.4%– 20.6%614862Peugeot Boxer5360.4%+ 50.1%628663VW T-Cross5220.4%– 38.1%633964Dacia Sandero5170.4%+ 0.0%646065BYD Atto 34970.4%new65 –66Lexus NX4830.4%– 6.2%666167Opel Mokka4760.4%– 45.5%673668VW Transporter4430.3%+ 49.7%689469Audi Q34400.3%+ 1.1%697370Mercedes V Class4390.3%+ 27.2%709071BMW 5 Series4270.3%+ 29.8%719672BMW X14190.3%+ 106.4%7213573BMW X64070.3%+ 6.3%7311074Kia Xceed4030.3%+ 15.1%748375Nissan Juke3990.3%– 4.8%757276Toyota Proace3970.3%n/a7614477Mercedes E Class3880.3%+ 162.2%7716078Renault Trafic3830.3%+ 26.0%7810479Nissan Leaf3770.3%+ 179.3%79n/a80Renault Trafic Tour3650.3%+ 67.4%8012181Mercedes C Class3590.3%+ 2.6%818882Peugeot 30083560.3%+ 45.9%82n/a83Renault Austral3550.3%+ 143.2%8315784Toyota Proace City Verso3520.3%+ 28.0%8410685Lexus RX3510.3%+ 15.1%8510186Toyota Camry3500.3%– 23.9%876587Peugeot 3083500.3%– 10.5%867488Skoda Fabia3490.3%– 36.3%885989Opel Vivaro Tour3460.3%+ 5.5%899190Mercedes Citan3420.3%+ 25.7%9011291Mercedes GLE3390.3%+ 27.4%9110392Iveco Daily3360.3%+ 32.3%9211593Cupra Formentor3320.3%+ 16.9%9311394Isuzu D-Max3310.2%– 23.2%946695Ford Transit Courier3300.2%– 22.0%967596VW Taigo3300.2%– 46.2%955597Mercedes GLE Coupe3250.2%n/a9712098BYD Seal3210.2%new98n/a99Seat Leon3190.2%+ 49.1%99138100VW Touareg3180.2%+ 60.6%100143101Volvo XC903150.2%+ 18.4%101108102Kia Niro3140.2%– 36.7%10264103Peugeot Partner3110.2%– 3.1%10397104Audi Q83020.2%– 24.3%10478105BYD Dolphin2990.2%new105n/a106BMW 4 Series Coupe/Cabrio2980.2%– 10.2%10695107Ford Tourneo Courier2960.2%n/a107n/a108Mazda CX-52930.2%+ 15.4%108122109VW Amarok2910.2%n/a109169110Cupra Leon2890.2%n/a110n/a111Audi A62870.2%+ 22.1%111128112Renault Megane2810.2%– 27.0%11298113Seat Ateca2640.2%– 24.1%11485114Audi A42640.2%– 19.8%11399115Mitsubishi Space Star2610.2%+ 107.1%115182116Jeep Wrangler2610.2%n/a116n/a117Renault Arkana2600.2%+ 42.1%117150118Kia Sorento2590.2%– 36.7%11877119Mazda62580.2%– 0.4%120119120Suzuki Jimny2580.2%– 19.4%11982121Mazda CX-602580.2%– 20.9%12180122Ssangyong Torres2550.2%new122 –123Audi Q52520.2%– 31.1%12381124BMW 2 Series Active Tourer2500.2%+ 55.3%124158125Citroen C3 Van2480.2%n/a125149126Mini Countryman2340.2%– 6.4%126125127Citroen C42310.2%– 2.9%128130128Ford Transit Connect Van2310.2%– 34.0%12787129Citroen C32300.2%+ 25.7%129114130BMW X32240.2%– 45.0%13276131Mercedes GLA2240.2%+ 14.9%131140132Mercedes CLE2240.2%new130 –133Peugeot 2082230.2%– 6.3%133126134Mazda CX-302210.2%+ 1.4%134139135Mercedes Vito2180.2%+ 43.4%135162136BMW X72180.2%+ 1.4%136189137MG HS2160.2%– 15.6%137116138BMW 1 Series 2120.2%n/a138n/a139Mercedes GLS2100.2%n/a139194
Source: Datahouse, many thanks to Csaba
