
USA November 2024: Ford F-Series (+27.1%), Toyota Camry (+24.5%) impress in solid market
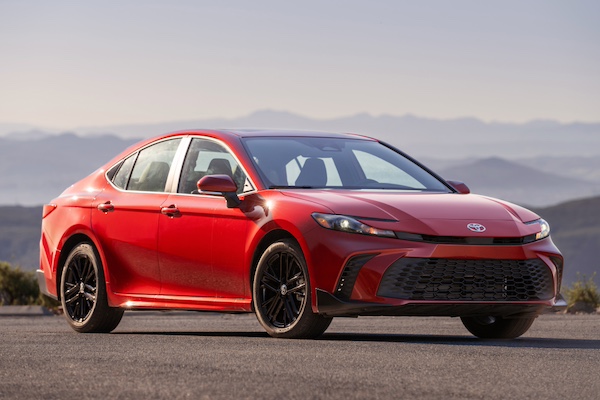
Toyota Camry sales perk up thanks to the new model.
US new light vehicle sales are estimated to reach 1.364 million units in November, a robust +9.8% year-on-year uptick. Light trucks soar 14.3% to 1.123 million and 82.3% of the market whereas passenger cars drop -7.2% to 241,000 and 17.7% share. The SAAR is up to 16.5 million units vs. 15.3 million in November 2023. The market’s strong performance was helped by improved affordability with higher incentives and lower auto loan rate, the start of year-end promotions, increased inventory and one more business day.
Among OEM’s still reporting monthly figures, Toyota Motor edges up 4.8% but Hyundai-Kia (+14.7%), Ford Motor (+14.5%) and American Honda (+14.5%) all do much better. Brand-wise, all 12 reporting manufacturers post year-on-year increases. Toyota is weak at +4% while Mazda (+20.6%), Kia (+20.2%), Honda (+15.9%) and Ford (+13%) all shoot up. Among smaller brands, Lincoln (+48.7%) and Genesis (+33.7%) stand out. Lexus (+9.3%), Hyundai (+8.5%) and Subaru (+8.2%) are relatively strong but Acura (+2.6%) and Volvo (+5%) both fall behind the market’s growth rate.
Looking at models with available monthly data, the Ford F-Series is up a fantastic 27.1% year-on-year to stay on top. The Toyota RAV4 (-3.9%) is in negative but remains well above its archenemy the Honda CR-V (+9.5%) despite the latter posting a solid lift. Thanks to the new generation, the Toyota Camry (+24.5%) defies its segment’s catastrophic result to tighten its grip on the passenger car charts, as the Toyota Corolla drops -4.1%, the Honda Civic gains 9.1% and the Honda Accord falls -16.2%. The Toyota Tacoma (+28.5%) is also in excellent shape, as are the Ford Bronco (+254.5%), Transit (+52.4%), Toyota Tundra (+49.1%), Honda Pilot (+38.8%) and Kia Telluride (+31.3%).
Previous month: USA October 2024: Ford (+14.4%), Mazda (+58.7%) among best performers in solid market
One year ago: USA November 2023: Lexus (+70.3%) stands out in market up 7.3%
Full November 2024 data for selected groups, brands and models below.
USA November 2024 – groups:
GroupNov-24/232024/23Toyota Motor Corporation207,222+ 4.8%2,122,674+ 5.0%Ford Motor Co165,418+ 14.5%1,874,866+ 4.7%Hyundai-Kia154,118+ 14.7%1,548,333+ 2.5%American Honda121,419+ 14.5%1,288,260+ 8.7%Subaru57,690+ 8.2%605,854+ 5.5%Mazda33,422+ 20.6%384,181+ 18.6%Volvo Cars12,259+ 5.0%111,166– 3.4%
USA November 2024 – brands:
BrandNov-24/232024/23Toyota173,356+ 4.0%1,814,041+ 4.3%Ford156,139+ 13.0%1,781,708+ 3.7%Honda110,020+ 15.9%1,168,890+ 11.1%Hyundai76,008+ 8.5%758,304+ 4.4%Kia70,107+ 20.2%723,186+ 0.1%Subaru57,690+ 8.2%605,854+ 5.5%Lexus33,866+ 9.3%308,633+ 9.3%Mazda33,422+ 20.6%384,181+ 18.6%Volvo12,259+ 5.0%111,166– 3.4%Acura11,399+ 2.6%119,370– 10.1%Lincoln9,279+ 48.7%93,158+ 28.4%Genesis8,003+ 33.7%66,844+ 7.2%
USA November 2024 – models:
ModelNov-24/232024/23Ford F-Series67,459+ 27.1%685,777+ 0.9%Toyota RAV441,179– 3.9%430,897+ 11.1%Honda CR-V34,398+ 9.5%363,388+ 11.8%Toyota Camry28,232+ 24.5%283,065+ 6.7%Toyota Tacoma23,322+ 28.5%170,098– 21.0%Hyundai Tucson20,178– 5.6%185,954– 2.2%Toyota Corolla20,142– 4.1%215,188+ 3.0%Honda Civic18,367+ 9.1%223,321+ 23.4%Subaru Crosstrek16,948+ 13.0%164,723+ 14.9%Subaru Forester14,843– 1.6%158,372+ 15.7%Toyota Tundra14,393+ 49.1%144,555+ 28.3%Ford Explorer14,299+ 14.3%178,243+ 6.6%Kia Sportage14,051+ 27.6%146,490+ 13.0%Subaru Outback14,004+ 14.5%153,886+ 4.3%Ford Transit13,080+ 52.4%139,790+ 21.8%Honda Pilot12,652+ 38.8%127,694+ 28.0%Honda HR-V12,594+ 18.3%138,911+ 27.0%Hyundai Santa Fe12,376– 8.3%105,701– 11.4%Lexus RX11,756+ 21.2%105,609+ 3.8%Honda Accord 11,671– 16.2%147,972– 18.5%Kia Telluride11,568+ 31.3%103,016+ 1.7%Hyundai Elantra11,344+ 28.7%125,113– 0.4%Kia K4/Forte11,005+ 11.7%127,867+ 11.8%Ford Escape10,344– 10.4%133,604+ 4.6%Ford Bronco10,320+ 254.5%97,105– 2.1%Ford Bronco Sport9,601– 3.5%113,340– 1.1%Hyundai Palisade8,982– 2.2%99,757+ 32.8%Toyota Sienna8,925+ 35.4%68,005+ 12.1%Toyota Corolla Cross8,903+ 26.8%85,573+ 34.5%Mazda CX-58,733– 8.6%122,954– 7.8%Kia Sorento8,705+ 26.7%85,722+ 6.0%Toyota Grand Highlander7,215– 6.7%63,292+ 59.5%Mazda CX-507,072+ 78.9%73,358+ 88.9%Lexus NX7,065– 3.6%66,368+ 0.6%Hyundai Sonata6,971+ 200.3%61,701+ 46.5%Ford Maverick6,899– 33.5%126,760+ 46.8%Mazda CX-306,844+ 10.5%87,640+ 22.7%Honda Prologue6,823new25,132newHonda Odyssey6,644+ 12.2%71,933+ 6.1%Kia K56,378+ 24.8%40,672– 32.1%Hyundai Kona6,133– 12.3%76,326+ 6.8%Ford Mustang Mach-E5,938+ 38.3%44,877+ 25.0%Ford Expedition5,852+ 19.3%69,243+ 4.9%Toyota Prius5,353+ 51.6%39,500+ 20.2%Ford Ranger5,039+ 2346.1%40,949+ 27.3%Hyundai Ioniq 54,989+ 110.3%39,805+ 29.8%Kia Carnival4,925+ 44.7%44,561+ 11.2%Mazda CX-904,883– 3.4%48,681+ 86.9%Volvo XC604,713+ 48.7%33,647– 5.6%Volvo XC904,711+ 28.8%34,486– 1.7%Subaru Ascent4,595+ 7.1%51,611– 7.1%Acura MDX4,328+ 6.2%45,077– 14.4%Lexus ES4,268+ 33.0%38,151+ 8.2%Kia Soul4,031+ 11.9%48,747– 15.8%Honda Ridgeline3,963+ 1.8%41,367– 13.1%Toyota Highlander3,861– 59.4%86,406– 45.0%Kia Seltos3,778– 10.3%56,221+ 1.1%Lexus GX3,493+ 5.5%27,446– 0.8%Lexus TX3,430+ 11.3%25,186+ 463.8%Acura RDX3,386– 8.3%39,283+ 11.9%Ford E-Series3,292– 20.7%36,494– 6.1%Lincoln Nautilus3,292+ 103.2%32,447+ 48.6%Toyota Land Cruiser3,283n/a23,714+ 395133.3%Mazda33,272+ 30.7%34,830+ 24.1%Genesis GV703,235+ 39.3%26,463+ 14.3%Honda Passport2,908– 8.4%29,172– 26.9%Toyota Crown Signia2,767new7,469newSubaru Impreza2,693+ 13.6%28,267– 12.2%Lincoln Aviator2,479+ 85.7%22,565+ 74.6%Genesis GV802,394+ 14.9%21,642+ 23.3%Hyundai Santa Cruz2,393– 0.1%29,991– 11.9%Ford Mustang2,355– 45.1%41,528– 5.4%Toyota Sequoia2,221+ 14.0%23,992+ 21.7%Kia EV92,155+ 43000.0%20,066+ 401220.0%Lincoln Corsair2,147+ 4.2%24,571+ 12.2%Volvo XC402,000– 25.5%23,966– 4.4%Kia EV61,887+ 46.3%19,604+ 11.2%Acura Integra1,841– 18.5%22,453– 23.7%Mazda CX-701,820new9,225newToyota bZ4X1,738+ 105.0%16,716+ 93.0%Lexus IS1,730+ 9.6%17,488– 14.4%Ford Edge1,661– 83.3%65,217– 28.8%Kia Niro1,624– 31.4%28,302– 16.4%Subaru Legacy1,612– 12.3%17,915– 24.2%Subaru WRX1,608+ 23.2%16,790– 27.9%Genesis G701,548+ 126.3%11,102– 10.1%Hyundai Venue1,521– 11.4%22,808– 13.4%Lincoln Navigator1,361+ 11.0%13,575– 14.6%Acura ZDX1,317new5,543newHyundai Ioniq 61,121– 19.1%11,055+ 1.0%Subaru Solterra1,067+ 13.1%11,282+ 42.5%Mazda MX-5 Miata798+ 76.9%7,489– 12.4%Toyota Crown676– 63.1%18,838+ 12.2%Lexus LX656+ 29.6%6,076– 4.7%Lexus UX632– 14.4%7,929– 27.7%Acura TLX527– 51.4%7,014– 55.1%Toyota GR86506– 33.2%10,847+ 5.4%Lexus RZ495– 55.3%9,300+ 113.3%Genesis G80391+ 15.7%3,806– 25.3%Subaru BRZ320+ 21.7%3,008– 23.2%Toyota 4Runner299– 97.0%92,106– 13.9%Genesis GV60285– 34.3%2,486– 17.3%Volvo EX90272new650newVolvo V60205+ 37.6%2,656+ 54.9%Toyota Venza178– 92.5%30,771+ 12.5%Volvo S60177– 88.9%12,786+ 37.4%Lexus LS159+ 0.0%2,005– 2.3%Lexus RC152+ 19.7%1,679+ 6.1%Genesis G90150+ 120.6%1,345+ 16.1%Toyota Mirai89+ 67.9%464– 82.9%Volvo C4082– 71.1%1,303– 79.6%Toyota Supra73– 67.6%2,545+ 5.7%Volvo S9061– 26.5%1,186– 15.3%Volvo V9038– 25.5%475– 7.8%Lexus LC30– 76.4%1,392– 13.4%Toyota Avalon1n/a13– 76.4%
Source: Manufacturers

More Stories
What to Look for When Choosing a Luxury Car Rental
There was a time when sliding behind the wheel of a Rolls-Royce, a Bentley or a high-end performance car meant...
Ferrari Denies Claims That Buyers Must Order the Luce EV to Get Higher Models
Ferrari’s first fully electric vehicle, the Luce, has already become one of the most talked-about cars to come out of...
China new models May 2026: Audi E7X and Onvo L80 appear
Onvo L80 Now that May 2026 has been studied, let’s focus on the latest launches on the Chinese market. Once...
World Full Year 2025: Discover the Top 500 best-selling models (BSCB Exclusive)
This content is for members only. Visit the site and log in/register to read.
McLaren Marks a Historic Milestone with a Special Artura
McLaren Automotive has revealed a striking new limited-edition model: the McLaren Artura 1000GP by MSO. Created to celebrate McLaren Racing’s...
The ROI Equation, Fleet Longevity and Truck Parts Quality
The math of fleet management has changed. For years, deciding to replace an aging tractor was mainly about mileage, age,...