
USA May 2026: Mazda (+35%), Honda (+10.5%), Subaru (+10.4%) impress, sedans up
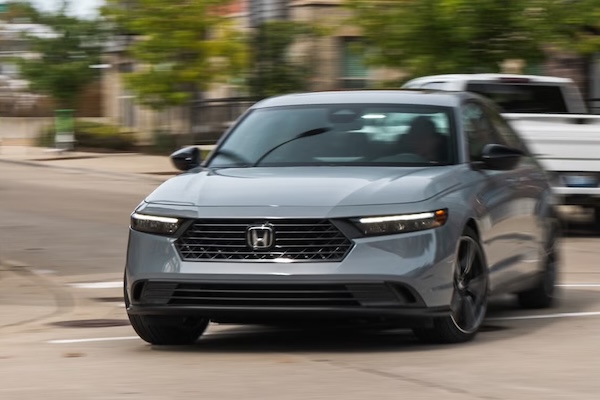
Honda Accord sales are up 33.3% year-on-year in May. Picture caranddriver.com
The U.S. new light vehicle market edges up for the first time this year, albeit at a tiny +0.6% year-on-year in May to 1.48 million units according to GlobalData. Retail sales are up 0.6% while fleet shipments gain 2.5%. The year-to-date tally is down -5%. The SAAR stands at 16.2 million according to Motor Intelligence, up from 15.7 million in May 2025 and 16.1 million last month. AutoForecast Solutions says U.S. sales will drop -2.3% over the Full Year 2026 to 15.7 million units. Average transaction prices have stopped surging at -0.2% year-on-year to $46,023 according to GlobalData and JD Power, while average incentives soar 21% to $3,297. Average incentives as a percentage of sticker price is 6.4%, up from 5.4% a year ago. Non-EV incentives are up 24% to $2,973 while EV discounts are 11% higher to $10,308. An estimated 22.6% of buyers leased their car in May, up from 22.3% a year ago.
Among OEMs still sharing their sales monthly, American Honda (+9.9%) fares best with Hyundai-Kia (+2.7%) also in positive, Toyota Motor (-0.6%) is stable but Ford Motor (-13.7%) falls apart. Brand-wise, Toyota (-0.1%) is almost immobile while Ford (-13.4%) suffers. This is Ford’s 5th consecutive month of year-on-year drops. Ford EVs are down -44% and Ford SUVs off -21%. In contrast Honda (+10.5%) has a tremendous month, with hybrid sales reaching a record 42,583. Hyundai (+3.5%) is also pushed up by hybrids (+90%) as is Kia (+1.9%, hybrids up 179%). Subaru (+10.4%) and Mazda (+35%) both end nine months of volume losses just as Genesis (+2.5%) posts a 20th consecutive monthly gain.
Looking at models with available monthly data, the Ford F-Series (-13.3%) dives as two fires at a key aluminium supplier last year continue to disrupt production. F-Series sales are down -15.1% so far this year. The Honda CR-V (+19.3%) continues to fly well above its archenemy the Toyota RAV4 (-26%) which is still in the midst of a difficult generation changeover. The Toyota Camry (+14.2%) illustrates a new trend towards cheaper and more fuel efficient sedans as gasoline prices remain painfully high. As such, other sedans such as the Honda Civic (+4.6%), Toyota Corolla (+0.8%), Honda Accord (+33.3%) and Hyundai Elantra (+6.8%) are also up.
Previous month: USA April 2026: Accord helps Honda up, sales off -6.7%
One year ago: USA May 2025: Employee pricing sends Ford Motor up 16.4%, stable market
Full May 2026 data for selected OEMs, brands and models below.
USA May 2026 – OEMs:
OEMMay-26/252026 1-5/25Toyota Motor238,800– 0.6%949,645– 11.5%Ford Motor Co189,645– 13.7%798,653– 13.8%Hyundai-Kia174,860+ 2.7%638,554– 20.4%American Honda148,903+ 9.9%491,696– 29.9%Subaru57,748+ 10.4%317,496+ 16.5%Mazda39,066+ 35.0%212,138+ 17.0%
USA May 2026 – brands:
BrandMay-26/252026 1-5/25Toyota207,393– 0.1%890,051– 0.4%Ford180,444– 13.4%780,325– 10.6%Honda135,688+ 10.5%565,737– 3.2%Hyundai87,468+ 3.5%373,013+ 0.2%Kia80,502+ 1.9%360,220+ 2.2%Subaru57,748+ 10.4%252,425– 12.7%Mazda39,066+ 35.0%164,667– 15.1%Lexus31,407– 3.9%140,546– 7.7%Acura13,215+ 4.1%57,401– 1.3%Lincoln9,201– 20.5%41,938– 7.4%Genesis6,890+ 2.5%31,563+ 3.6%
USA May 2026 – models:
ModelMay-26/252026 1-5/25Ford F-Series69,175– 13.3%291,124– 15.1%Honda CR-V45,141+ 19.3%187,255+ 2.5%Toyota Camry35,797+ 14.2%147,471+ 13.4%Toyota RAV433,524– 26.0%121,605– 40.0%Honda Civic26,995+ 4.6%109,635+ 1.2%Toyota Tacoma26,650+ 0.6%120,690+ 10.4%Toyota Corolla23,644+ 0.8%111,530+ 10.0%Ford Explorer22,316+ 8.8%104,894+ 18.1%Hyundai Tucson20,581+ 3.4%98,031+ 1.1%Subaru Forester19,577+ 26.8%91,566+ 8.2%Honda Accord 18,688+ 33.3%72,076+ 28.9%Kia Sportage18,405+ 7.9%78,912+ 5.9%Subaru Crosstrek17,409+ 10.2%71,573– 3.7%Ford Maverick17,055+ 10.0%65,112– 11.7%Hyundai Elantra16,819+ 6.8%64,660+ 3.7%Ford Transit15,859+ 4.2%65,156+ 4.9%Ford Bronco15,389+ 5.2%63,659+ 3.3%Mazda CX-5014,897+ 107.2%52,132+ 36.3%Toyota Grand Highlander14,692– 0.9%63,395+ 17.7%Toyota 4Runner14,166+ 112.6%59,339+ 143.6%Toyota Tundra14,100+ 1.0%63,050– 0.8%Kia Telluride13,665+ 18.2%62,170+ 19.0%Honda HR-V13,350+ 0.7%56,631– 16.9%Ford Bronco Sport13,272– 8.3%58,809– 1.5%Hyundai Palisade13,089+ 16.8%52,117+ 8.7%Kia K412,592– 9.2%63,026– 1.5%Subaru Outback11,258+ 0.4%48,884– 22.0%Hyundai Santa Fe11,220+ 1.7%53,621– 2.2%Lexus RX11,075+ 25.0%50,068+ 11.8%Honda Pilot11,066– 1.4%53,715– 4.1%Toyota Corolla Cross10,762+ 9.3%51,897+ 18.7%Toyota Sienna10,511– 0.3%44,611+ 0.4%Kia Sorento10,127+ 11.4%40,746– 7.1%Ford Expedition8,537– 24.4%32,842– 8.5%Hyundai Sonata8,456+ 39.0%30,108+ 7.9%Honda Odyssey8,441– 3.1%34,365– 15.1%Kia Carnival8,062+ 15.6%33,082+ 18.3%Mazda CX-57,805– 17.9%53,003– 6.2%Kia K56,673– 4.1%32,016+ 10.6%Lexus NX6,239– 10.3%24,982– 22.0%Hyundai Kona6,036– 22.4%30,133– 7.9%Toyota Highlander5,879– 12.2%28,118+ 12.5%Kia Seltos5,843+ 11.2%25,877+ 25.1%Honda Passport5,689+ 3.8%25,181+ 11.2%Lexus TX5,444– 0.9%22,811+ 11.7%Mazda CX-305,060+ 16.9%17,025– 46.2%Hyundai Ioniq 55,002+ 28.3%18,395+ 15.5%Ford Mustang4,920– 1.8%24,824+ 28.6%Ford Ranger4,849– 23.3%27,869– 1.3%Mazda CX-904,728+ 16.9%17,093– 30.5%Acura MDX4,504+ 16.1%19,643+ 4.8%Mazda34,121+ 68.0%16,665+ 10.8%Honda Ridgeline4,103– 4.3%18,685– 4.2%Toyota Prius3,451– 48.2%15,489– 48.6%Ford Escape3,427– 80.3%20,874– 69.1%Subaru Ascent3,293– 7.2%15,940– 13.3%Lincoln Nautilus3,232– 7.6%15,044– 6.0%Genesis GV703,197+ 2.1%14,268+ 10.1%Acura ADX3,179+ 106.2%13,446+ 399.9%Hyundai Venue3,159– 27.4%12,530– 2.7%Lexus IS3,140+ 75.9%11,183+ 30.8%Toyota Land Cruiser3,016– 33.1%14,325– 41.4%Ford E-Series2,998– 11.3%15,245– 9.0%Acura Integra2,968+ 67.1%11,436+ 34.6%Toyota BZ/bZ4X2,830+ 109.3%15,860+ 97.6%Kia Niro2,772+ 17.8%11,718+ 19.3%Toyota Sequoia2,682+ 12.4%11,482+ 13.7%Ford Mustang Mach-E2,647– 44.0%9,917– 48.5%Lincoln Aviator2,582– 6.1%10,901+ 5.7%Lincoln Navigator2,536– 10.8%8,458– 12.3%Acura RDX2,514– 14.2%11,724– 24.8%Toyota Crown Signia2,208+ 59.2%9,503– 15.2%Genesis GV802,185– 3.1%10,689+ 2.6%Lexus GX2,104– 35.6%12,537– 23.9%Honda Prologue1,897– 10.1%6,724– 50.3%Hyundai Santa Cruz1,785– 41.1%8,214– 32.5%Kia EV91,647+ 4351.4%5,736+ 42.5%Subaru Impreza1,577– 35.8%6,933– 46.4%Toyota C-HR1,509n/a2,154n/aMazda CX-701,402+ 31.6%4,838– 34.4%Subaru Uncharted1,270new1,792newSubaru WRX1,195+ 147.9%5,875– 3.4%Lexus UX1,176+ 33.0%4,569+ 5.3%Hyundai Ioniq 91,145+ 279.1%4,001+ 1224.8%Lexus RZ1,140+ 25.1%6,810+ 125.8%Subaru Trailseeker1,074new1,483newMazda MX-5 Miata1,053+ 196.6%3,911+ 10.9%Genesis G70943+ 22.0%4,353+ 10.2%Lincoln Corsair851– 65.7%7,535– 31.2%Toyota Crown834– 9.0%4,496+ 8.8%Subaru Solterra750– 39.8%4,919– 7.6%Toyota GR86711– 16.5%3,253– 29.6%Kia EV6708– 11.6%3,459– 33.4%Lexus LX613– 9.7%3,097– 1.7%Toyota Supra404+ 24.3%1,667+ 80.6%Lexus ES338– 90.4%3,565– 77.8%Honda Prelude318new1,470newGenesis G80282– 5.1%1,423– 7.5%Subaru BRZ255– 21.8%1,341– 8.1%Hyundai Ioniq 6176– 85.3%1,203– 78.6%Genesis G90151+ 26.9%492– 14.7%Genesis GV60132– 10.8%338– 68.5%Lexus LC129+ 25.2%545– 24.8%Subaru Legacy90– 95.0%2,125– 77.6%Acura TLX48– 93.0%1,067– 63.6%Toyota Mirai23+ 283.3%109+ 172.5%Lexus RC8– 93.5%234– 67.1%Kia Soul7– 99.9%3,477– 83.7%Acura ZDX2– 99.9%85– 99.1%Lexus LS1– 98.9%145– 76.8%Toyota Avalon0– 100.0%2– 50.0%Toyota Venza0– 100.0%5– 99.3%
Source: Manufacturers
More Stories
Ford F-150 Overland Capacity: What Actually Matters When You’re Packing for the Backcountry!
Overland Builds Live and Die by How Well You Use Your Roof Ask ten F-150 owners what “overland ready” means...
How Much Does It Cost to Rent an Exotic Car in Houston?
Exotic rentals in Houston run anywhere from $800 to $2,500 per day, and the spread comes down to what’s in...
In-Car Cameras Are Now Required in Europe as Driver Monitoring Debate Heads Toward the U.S.
New vehicles sold in the European Union are now required to include advanced driver-distraction warning technology, and for many models...
2026 Cadillac CT5 Pricing: The Last Luxury Sedan From a Legacy American Automaker
Edmunds said it plainly in their 2026 review: the CT5 is the last luxury sedan from a legacy American automaker,...
What Is BMW SmartView?
Your phone already does most of the heavy lifting when it comes to media, navigation, and apps. BMW SmartView is...
2026 Mazda CX-70 Invoice Pricing: Three Powertrains, a $3,000 Rebate, and 0.9% Financing
If you are shopping for a 2026 Mazda CX-70 and want to know what dealers are actually paying, what a...