
Finland September 2025: Tesla Model Y (+88.6%) lodges best result in two years
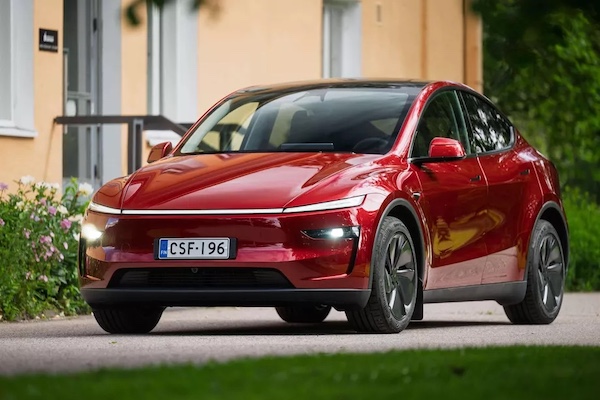
The Tesla Model Y is at its highest since September 2023.
Finnish new car sales are up year-on-year for the third time in the past four months in September at +29.4% to 5,897. Keep in mind September 2024 was down -38.3% on the year prior. Year-to-date volumes remain in negative however at -2.5% to 52,907. Toyota (+89.7%) almost doubles its sales year-on-year to 15.7% share while Tesla (+33.3%) beats the market and is up 10 spots on last month to #2 with 10.3% share, its best score since December 2023. Volkswagen (+24.7%) stays in third place above Skoda (+6.2%) and Kia (+37%). Mercedes (+68.9%), BMW (+46.2%) and Nissan (+30.4%) also outrun the overall growth rate in the remainder of the Top 10. MG (+716.7%), Mini (+233.3%), Suzuki (+135.5%), Dacia (+135.1%) and BYD (+125%) post surreal gains further down.
Over in the models charts, the Tesla Model Y (+88.6%) reaches its highest share in two years at 8.7% and climbs to #5 year-to-date vs. #3 over the Full Year 2024. The Toyota Yaris (+268.1%) is far below at 5.7% of the market vs. 3.4% so far this year where it now ranks #1. The Corolla (+104.7%) and RAV4 (+30.3%) make it three Toyotas in the Top 4 with the new Skoda Elroq repeating at an outstanding 5th place. The Toyota C-HR (+188.9%), VW ID.7 (+111.5%), Toyota Yaris Cross (+100%) and Nissan Qashqai (+85%) impress YoY but only lodge market shares equal or below their YTD levels.
Previous month: Finland August 2025: Toyota RAV4 repeats at #1, sales off -19.5%
One year ago: Finland September 2024: Tesla Model Y and Skoda Enyaq top market down -38.3%
Full September 2025 Top 30 brands and Top 20 models below.
Note: These rankings feature the Top 30 brands and models year-to-date ordered based on their September volumes and may therefore not be 100% accurate.
Finland September 2025 – brands:
PosBrandSep-25%/24Aug2025%/24PosFY241Toyota92415.7%+ 89.7%18,15315.4%– 18.4%112Tesla60810.3%+ 33.3%121,8323.5%– 30.4%1173Volkswagen5258.9%+ 24.7%36,17711.7%+ 35.4%244Skoda5148.7%+ 6.2%25,0649.6%+ 2.9%335Kia4267.2%+ 37.0%44,4598.4%+ 7.1%456Volvo4096.9%– 0.7%54,4368.4%– 26.0%527Mercedes3536.0%+ 68.9%82,4784.7%– 18.1%768BMW3105.3%+ 46.2%62,6985.1%– 0.2%689Ford2354.0%+ 24.3%72,1794.1%+ 33.8%91210Nissan2103.6%+ 30.4%111,9483.7%– 21.6%101011Audi1823.1%– 2.2%92,1904.1%+ 15.0%81112Polestar1332.3%+ 33.0%151,1072.1%+ 132.1%131613Hyundai1222.1%– 42.7%101,7443.3%– 27.6%12914BYD991.7%+ 125.0%163730.7%– 14.6%232015Dacia871.5%+ 135.1%136241.2%+ 56.0%152116Mazda771.3%+ 40.0%195761.1%– 7.5%171717Suzuki731.2%+ 135.5%214660.9%– 24.7%201818Renault671.1%– 2.9%171,0932.1%+ 105.5%141519MG490.8%+ 716.7%223850.7%+ 795.3%213120Mitsubishi460.8%+ 24.3%145441.0%+ 3.0%181921Lexus450.8%+ 7.1%283310.6%+ 1.8%262322Cupra400.7%+ 60.0%273780.7%+ 40.0%222623Peugeot380.6%– 65.8%236201.2%– 23.6%161324Land Rover380.6%+ 111.1%252790.5%+ 26.2%292725Subaru330.6%+ 10.0%292940.6%– 18.3%272426Mini300.5%+ 233.3%202310.4%+ 122.1%303227Porsche270.5%– 28.9%243330.6%+ 46.1%252528Citroen260.4%– 13.3%265010.9%+ 30.8%192229Opel260.4%– 67.9%183460.7%– 49.0%241430Seat60.1%+ 100.0%302810.5%+ 44.1%2828
Finland September 2025 – models:
PosModelSep-25%/24Aug2025%/24PosFY241Tesla Model Y5138.7%+ 88.6%121,3352.5%– 21.1%532Toyota Yaris3355.7%+ 268.1%61,7963.4%– 10.2%143Toyota Corolla1763.0%+ 104.7%41,4662.8%– 51.0%314Toyota RAV41722.9%+ 30.3%11,4612.8%+ 39.4%4125Skoda Elroq1512.6%new51,0492.0%new11 –6Nissan Qashqai1482.5%+ 85.0%131,2522.4%– 18.1%977VW ID.41252.1%+ 7.8%31,2722.4%+ 24.1%7118Toyota Yaris Cross1162.0%+ 100.0%21,7753.4%– 21.6%229Volvo XC601121.9%– 8.9%91,2982.5%+ 8.9%6810VW ID.71101.9%+ 111.5%111,0372.0%+ 123.5%122211Skoda Enyaq1091.8%– 54.2%101,2532.4%+ 23.3%8912Kia Ceed1051.8%+ 25.0%81,2422.3%+ 12.8%101013Toyota C-HR1041.8%+ 188.9%71,0101.9%– 4.9%131314Kia EV31041.8%new147771.5%new1414615Tesla Model 3951.6%– 44.8%n/a4870.9%– 46.1%291516Volvo EX40781.3%+ 69.6%n/a6401.2%+ 183.2%194217Kia Stonic681.2%+ 15.3%186021.1%+ 4.2%222118Polestar 4631.1%+ 14.5%n/a5651.1%+ 633.8%236719BMW X1591.0%+ 13.5%154860.9%– 19.1%302620Volvo V60581.0%+ 9.4%167041.3%– 27.1%1614n/aVW Golf530.9%+ 89.3%n/a6631.3%+ 10.5%1820n/aKia Niro520.9%+ 23.8%n/a4980.9%– 14.4%2728n/aVW Tiguan510.9%– 59.8%207611.4%+ 33.3%1518n/aSkoda Kodiaq500.8%– 24.2%175371.0%+ 47.5%2530n/aAudi Q4 e-Tron470.8%– 24.2%n/a6081.1%– 14.6%2119n/aSkoda Octavia440.7%+ 33.3%196991.3%– 57.7%176n/aVW T-Cross420.7%+ 110.0%n/a5571.1%+ 50.1%2441n/aSkoda Superb290.5%– 54.7%n/a4970.9%+ 19.2%2831n/aVW Taigo190.3%+ 11.8%n/a6131.2%+ 183.8%2046n/aRenault Clio90.2%– 75.0%n/a5081.0%+ 393.2%2681
Source: AUT


More Stories
Reasons Classic Nostalgia 2026 Was the Ultimate Historic Motorsport Event
Classic Nostalgia returned to Shelsley Walsh on 18 and 19 July with another memorable celebration of historic motorsport. Blessed with...
Morocco First Half 2026: Dacia Logan keeps Sandero at bay, Renault Kardian and Nissan Magnite up
According to fresh data by local association AIVAM, the Moroccan new vehicle market soars 17.6% year-on-year over the First Half...
New Zealand June 2026: Tesla Model Y #1, Jaecoo up 189.7% to record ranking
First Top 20 finish for the Jaecoo J5 in New Zealand. The New Zealand new vehicle market soars 13.4% year-on-year...
2027 Kia Telluride Invoice Price, Dealer Cost, and How to Get the Best Deal Near You
If you are shopping for a 2027 Kia Telluride and want to know what dealers are actually paying, what a...
Lessons from the car industry’s smartest dealers
Ask any dealer who’s been at it twenty years and they’ll tell you the trade rewards patience more than flair....
The Most Overlooked Parts of a Classic Car Restoration
Restoring a classic car is often a labour of love. Enthusiasts can spend months or even years sourcing parts, rebuilding...