
Germany August 2025: VW T-Roc repeats at #1, teases Golf YTD
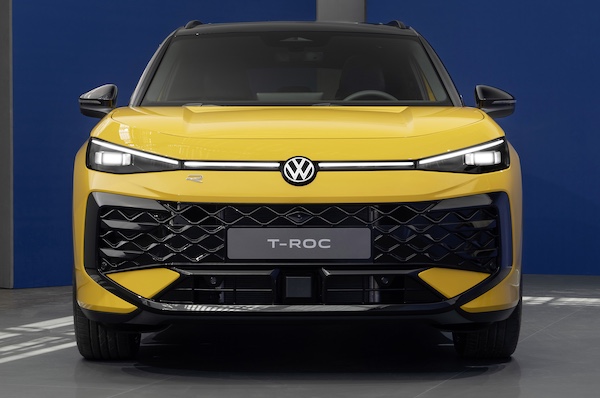
The outgoing T-Roc benefits from promotions before the arrival of the new generation (pictured)
New car sales in Germany stand at 207,229 in August, up 5% year-on-year. This is still a weak result given August 2024 was off -27.8% on the year prior. The year-to-date volume is down -1.7% to 1,874,820. As a reminder we are -34% below the pre-pandemic August 2019 volume (313,748) and -25% below the 8 months 2019 result (2,495,536). BEV sales are up 45.7% to 39,367 and 19% share vs. 13.7% a year ago and up 39.2% YTD to 336,707 and 18% share vs. 12.7% over the first 8 months of 2024.
In the brands charts, Volkswagen (+6%) matches the market to 18.1% share vs. 20% year-to-date, distancing Mercedes (-1.5%) at 9.2%. BMW (+15.3%) and Audi (+13.2%) are both very solid just as Skoda (+0.1%) doesn’t move YoY and falls one spot on July to #5. Ford (+10.6%) is the only additional Top 10 member in positive, with Opel (-9.9%), Hyundai (-7.7%), Toyota (-6.6%) and Seat (-3.2%) all in difficulty. Cupra surges 73% to #11. Below, Xpeng is up 757.6%, BYD is up 411%, MG up 260.3%, KGM up 175.7%, Polestar up 79.8%, Alfa Romeo up 55.9% and Citroen up 36%. Tesla is down -39.2%
Model-wise, the VW T-Roc (+22.7%) is once again pushed by rebates on the outgoing generation, repeating at #1 with over 7,000 sales. That’s 51% better than the VW Golf (+8.8%) at #2. Notably the YTD gap between the Golf and T-Roc is now just 341 sales, the smallest it has ever been. If promotions continue until the end of the year, which is likely, the T-Roc could end 44 consecutive years of VW Golf domination in Germany. The VW Tiguan (-2.9%) completes the podium above the Opel Corsa (+11.6%) and BMW X1 (+31.4%) exchanging their positions vs. last month. The Seat Leon (+60.9%) is up 11 spots on July to #6 which the Audi A3 (+105.5%) is up 14 to #7. Notice also the the BMW 1 Series up 216.5% and the VW ID.3 up 170.4%.
Previous month: Germany July 2025: VW back up 25.5%, T-Roc best-seller in solid market (+11.1%)
One year ago: Germany August 2024: Market off -27.8%, BEVs down -68.8%, Opel Astra outsells VW Golf
Full August 2025 Top 63 All brands and Top 348 All models below.
Germany August 2025 – brands:
PosBrandAug-25%/24Jul2025%/24PosFY241Volkswagen37,46718.1%+ 6.0%1375,40320.0%+ 2.6%112Mercedes19,1489.2%– 1.5%2170,7609.1%+ 0.9%223BMW18,6059.0%+ 15.3%3162,2128.7%+ 6.7%334Audi15,3447.4%+ 13.2%5130,2476.9%– 5.0%555Skoda14,4727.0%+ 0.1%4146,8477.8%+ 6.7%446Opel10,9405.3%– 9.9%686,9644.6%– 14.5%667Ford9,3104.5%+ 10.6%773,9933.9%+ 7.9%788Hyundai7,2793.5%– 7.7%862,4373.3%– 5.4%8109Seat7,1303.4%– 3.2%1057,9533.1%– 22.9%9710Toyota6,3543.1%– 6.6%953,9512.9%– 10.2%10911Cupra5,5952.7%+ 73.0%1351,9402.8%+ 65.6%111812Dacia5,1982.5%+ 15.5%1147,8782.6%– 1.8%121113Kia4,8222.3%– 11.5%1240,7442.2%– 14.8%141214Fiat4,3792.1%+ 7.9%1437,5772.0%– 16.8%171515Peugeot4,2852.1%– 12.1%1739,1522.1%– 8.7%151316Renault4,0732.0%+ 10.9%1637,8992.0%+ 12.8%161617Citroen4,0542.0%+ 36.0%1932,6991.7%– 15.3%181718Volvo3,7601.8%– 4.4%1540,9142.2%– 0.9%131419Mini2,8611.4%+ 9.2%1822,0131.2%+ 9.4%202220Mazda2,7691.3%+ 3.2%2225,5691.4%– 14.0%191921MG Roewe2,1401.0%+ 260.3%2315,6460.8%– 2.4%232622Nissan1,9831.0%– 0.3%2121,9041.2%+ 5.9%212323Porsche1,7110.8%– 9.7%2021,0611.1%– 18.5%222124Suzuki1,6660.8%– 25.4%2415,3650.8%– 9.2%242525Tesla1,4410.7%– 39.2%2811,4410.6%– 56.1%262026BYD1,1140.5%+ 411.0%278,5630.5%+ 419.0%293727Land Rover9570.5%+ 24.1%259,2520.5%+ 8.3%272828Jeep9410.5%+ 32.9%268,8840.5%+ 12.5%282929Mitsubishi9340.5%– 50.0%2914,5880.8%– 28.0%252430Leapmotor8260.4%new333,5310.2%new325531Honda6040.3%+ 1.5%305,0820.3%+ 3.3%313032Alfa Romeo5690.3%+ 55.9%315,2220.3%+ 15.4%303133Smart4130.2%– 36.5%352,7750.1%– 71.3%362734Lexus3600.2%– 29.4%343,2790.2%+ 4.2%333235Polestar3380.2%+ 79.8%322,9230.2%+ 33.2%343536Subaru3210.2%– 11.8%362,8660.2%– 3.9%353337Xpeng2830.1%+ 757.6%381,6140.1%+ 1917.5%405038KGM2040.1%+ 175.7%372,0610.1%+ 56.1%393839Man1550.1%+ 47.6%421,0270.1%+ 2.3%424140DS1520.1%– 20.8%392,1020.1%+ 1.0%383441Ferrari1450.1%+ 3.6%411,3000.1%– 11.0%414042Genesis 1060.1%+ 53.6%498080.0%+ 31.8%444343Alpine940.0%+ 422.2%466290.0%+ 84.5%464844Lamborghini870.0%+ 1.2%449220.0%+ 1.8%434245Iveco600.0%– 15.5%476490.0%– 15.8%454446Maserati480.0%+ 54.8%435030.0%+ 33.1%484647Aston Martin460.0%+ 283.3%531880.0%– 17.9%555448GWM420.0%– 83.1%402,2120.1%+ 16.8%373649Rolls-Royce360.0%+ 111.8%542310.0%+ 2.2%525350Lynk & Co350.0%+ 1650.0%555370.0%+ 1018.8%476051Bentley300.0%+ 233.3%484010.0%– 22.1%504552NIO230.0%– 34.3%501910.0%– 36.5%544953Togg230.0%new –240.0%new62 –54Chery220.0%new57420.0%new61 –55Lucid 170.0%+ 30.8%511360.0%+ 58.1%565156Lotus160.0%– 56.8%522420.0%+ 4.8%515257Ineos100.0%– 76.2%454080.0%+ 10.6%494758Maxus80.0%+ 166.7%59860.0%+ 72.0%585959Vinfast50.0%– 78.3%56880.0%+ 49.2%575660Cadillac50.0%– 16.7%58650.0%– 52.6%595761Morgan40.0%– 66.7%60430.0%– 15.7%606162Lancia10.0%new –20.0%new65 –63Lada10.0%– 85.7% –10.0%– 96.9%666264Jaguar00.0%– 100.0%611930.0%– 88.0%5339 –Others1,4080.7%+ 32.1% –8,3770.4%+ 3.7% – –
Germany August 2025 – models:
PosModelAug-25%/24Jul2025%/24PosFY241VW T-Roc7,0013.4%+ 22.7%155,0242.9%+ 1.7%222VW Golf4,6322.2%+ 8.8%255,3653.0%– 21.0%113VW Tiguan4,3892.1%– 2.9%343,5632.3%+ 2.8%334Opel Corsa4,0071.9%+ 11.6%532,0911.7%+ 15.3%475BMW X13,4971.7%+ 31.4%431,0911.7%+ 40.2%586Seat Leon3,1201.5%+ 60.9%1726,2041.4%– 1.1%897Audi A32,9011.4%+ 105.5%2120,8971.1%– 1.5%19188Mini All2,8611.4%+ 9.2%922,0131.2%+ 9.4%16149VW Polo2,6601.3%– 26.1%5317,9401.0%– 31.2%271010VW Passat2,6191.3%– 18.4%730,7441.6%– 7.1%6511Skoda Octavia2,5591.2%– 33.3%630,0941.6%– 16.9%7412Toyota Yaris/Cross2,5321.2%+ 1.9%1418,7581.0%– 5.4%241313Audi A62,5171.2%+ 3.4%2624,0031.3%+ 59.6%102914BMW 3er2,4731.2%+ 3.8%1521,0771.1%– 14.0%181115VW ID.32,3501.1%+ 170.4%2219,8801.1%+ 31.5%204916Mercedes GLC2,3421.1%– 14.0%1023,6251.3%+ 18.4%121517Opel Astra2,3331.1%– 45.9%823,3771.2%– 30.0%13618Fiat Ducato2,3311.1%+ 9.0%1224,7781.3%+ 17.4%92719VW Transporter2,2951.1%+ 17.3%2022,6141.2%– 9.5%141220BMW 5er2,2791.1%+ 4.2%1323,6921.3%+ 54.5%112821VW T-Cross2,2021.1%– 14.1%1121,2081.1%+ 0.8%172222BMW X32,1291.0%+ 7.3%3714,8680.8%– 18.2%402323BMW 1er2,1241.0%+ 216.5%2915,7110.8%+ 16.2%335224Mercedes E-Klasse 2,0391.0%+ 19.1%3217,2390.9%+ 8.5%293125Cupra Formentor1,9881.0%+ 33.2%5819,3651.0%– 10.7%232126Ford Transit Custom1,9801.0%+ 153.2%2716,6270.9%+ 186.9%329427Skoda Kodiaq1,9781.0%+ 23.1%1619,3891.0%+ 30.2%223228Skoda Karoq1,9430.9%– 11.0%1818,5081.0%– 12.6%251629Seat Ibiza1,8600.9%+ 3.2%4411,6620.6%– 24.7%504530Dacia Sandero1,8400.9%– 10.6%3918,1161.0%– 14.2%261731VW ID.4, ID.51,8140.9%+ 124.5%2419,5681.0%+ 48.1%213932Skoda Elroq1,7310.8%new3013,5060.7%new4335233VW ID.71,7170.8%+ 19.4%2322,4991.2%+ 386.5%156934Audi A51,7050.8%+ 107.4%4315,4920.8%+ 102.8%348035Audi Q51,6380.8%+ 13.8%5211,2760.6%+ 4.1%535836Skoda Kamiq1,6210.8%+ 8.0%2515,2950.8%– 0.3%363337Skoda Fabia1,6180.8%– 14.3%2816,7780.9%– 13.8%302438Mercedes CLA-Klasse1,6080.8%+ 19.6%639,7290.5%– 15.2%686039Volvo XC601,6050.8%+ 53.0%4915,1420.8%+ 11.8%373740VW Tayron1,5800.8%new1915,4570.8%new3536141Cupra Terramar1,5740.8%new6011,7920.6%new4925042Hyundai Tucson1,5500.7%– 4.0%4713,1360.7%– 10.0%463843Opel Grandland X1,5180.7%+ 44.4%4210,3100.5%– 19.1%615144Citroen C3/C3 Aircross1,4830.7%+ 217.6%7210,0250.5%– 32.6%656445Opel Frontera1,4830.7%new855,2100.3%new11532746Ford Kuga1,4820.7%– 17.2%6110,4090.6%– 32.1%604247Mercedes V-Klasse/EQV1,4580.7%+ 12.3%3115,0850.8%+ 4.2%394448Skoda Enyaq1,4560.7%– 21.3%3416,7510.9%+ 26.9%313049Opel Mokka1,4360.7%– 31.4%3614,1150.8%– 1.3%424050BMW 2er1,4070.7%– 18.2%3812,5840.7%– 6.1%475051Ford Puma1,3810.7%– 2.7%5710,7780.6%– 16.3%565552Mercedes C-Klasse 1,3770.7%– 42.6%3317,5550.9%– 5.5%282553BMW 4er1,3660.7%– 17.1%4115,0990.8%– 2.0%383454Mercedes A-Klasse 1,3540.7%+ 0.7%5510,9420.6%– 4.8%555755Dacia Bigster1,3020.6%new356,5330.3%new96 –56Audi Q31,2960.6%– 14.8%4611,3420.6%– 27.9%524357BMW X51,2850.6%+ 41.5%658,2770.4%– 2.6%777658Kia Ceed/Xceed1,2790.6%– 14.0%5911,2730.6%– 22.9%544759Hyundai Kona1,2680.6%+ 11.9%629,4750.5%+ 6.8%697360Toyota Aygo X1,2400.6%+ 5.6%5610,2770.5%– 12.0%625661VW Caddy1,2340.6%+ 6.4%5113,3150.7%+ 7.8%445362Seat Arona1,2020.6%– 37.9%7410,5330.6%– 24.3%595463Mercedes GLA1,1950.6%+ 21.7%738,6880.5%+ 12.8%727564Hyundai i101,1930.6%– 15.6%6910,1650.5%– 0.6%636765Audi Q41,1630.6%+ 30.2%888,4530.5%– 8.6%757866Ford Explorer1,1610.6%+ 108.8%826,6020.4%+ 571.6%9416967Ford Focus1,1350.5%– 42.0%4012,5170.7%– 19.4%483668Cupra Born1,1340.5%– 25.0%4813,2670.7%+ 40.5%456269Skoda Superb1,1190.5%+ 6.8%4511,6470.6%+ 7.0%516170Audi A11,0580.5%– 16.2%788,3090.4%– 0.5%767471VW Taigo1,0570.5%– 59.4%5014,7710.8%– 24.8%412672Nissan Qashqai1,0140.5%+ 17.8%649,9130.5%+ 12.8%668273Dacia Duster9990.5%– 26.1%7010,7700.6%– 27.9%574174Volvo XC409750.5%+ 17.0%5410,5840.6%+ 37.0%588675Audi Q69700.5%+ 430.1%808,5460.5%+ 726.5%7417076Peugeot 20089460.5%– 33.1%777,9480.4%– 24.1%806877Mercedes B-Klasse9440.5%+ 16.4%1155,4410.3%+ 6.9%11310878Toyota Corolla/Cross9400.5%– 19.9%838,1690.4%– 27.4%785979Seat Ateca9390.5%– 44.3%689,4350.5%– 37.5%703580Mercedes GLE9310.4%+ 12.0%757,6600.4%– 22.6%827781Fiat 5009290.4%– 40.6%875,5010.3%– 71.0%1124682Peugeot 2089150.4%– 24.5%9910,1190.5%+ 28.0%646383Citroen C4/C4 X8990.4%– 3.7%1194,8960.3%– 32.0%1188184Cupra Tavascan8990.4%+ 575.9%1287,5160.4%+ 5268.6%8621185Audi Q28960.4%+ 0.2%797,6250.4%– 19.6%847086Hyundai Inster8750.4%new767,2160.4%new8836587Kia Sportage8690.4%– 25.6%668,5570.5%– 20.0%736588VW Touran8690.4%– 39.0%679,9000.5%– 22.5%674889Mercedes Sprinter8480.4%+ 37.4%907,2650.4%+ 15.9%8710590Mercedes EQA8270.4%– 5.9%916,4290.3%– 8.0%978591Kia EV38200.4%new945,9710.3%new10327592Mazda CX-307990.4%+ 56.7%1007,7800.4%+ 35.5%8110093Ford Transit, Tourneo7930.4%+ 12.3%846,9380.4%– 13.9%919294Mercedes Vito7670.4%– 6.5%716,5840.4%+ 6.9%9510695Tesla Model 37540.4%+ 93.8%1383,6900.2%– 26.7%13611796Dacia Jogger7410.4%– 29.6%928,8580.5%– 10.7%716697Kia Picanto7360.4%– 17.6%976,2960.3%– 2.0%1009598Renault Austral7250.3%+ 17.1%1035,8400.3%+ 31.7%10611299MG RX66880.3%+ 942.4%1263,5860.2%+ 210.2%137186100Citroen C5 X/Aircross6810.3%+ 17.6%1086,3860.3%– 3.5%9893101Peugeot 30086800.3%+ 43.8%1025,9960.3%– 17.3%10291102Tesla Model Y6780.3%– 65.4%1177,6200.4%– 62.9%8519103Fiat 6006750.3%+ 162.6%1214,7720.3%+ 454.9%123153104Suzuki Swift6740.3%– 4.9%898,0720.4%+ 48.4%79101105Suzuki Vitara6480.3%+ 0.9%1274,5900.2%+ 14.5%125121106Renault Clio6320.3%– 18.5%1097,1510.4%+ 3.2%9087107Mazda CX-606260.3%+ 337.8%1145,8500.3%+ 56.0%105123108Leapmotor T036060.3%new1412,5970.1%new158311109Hyundai i205970.3%– 42.5%866,6520.4%– 24.8%9284110Toyota C-HR5940.3%– 40.4%1116,3580.3%– 9.2%9988111Mercedes GLB5850.3%+ 23.2%1224,5520.2%– 12.0%126111112Renault 55520.3%+ 2108.0%965,5240.3%+ 21996.0%110244113BMW X25490.3%+ 43.7%955,8670.3%+ 82.1%104122114Hyundai i305440.3%– 46.1%1135,3000.3%– 44.7%11471115Audi Q85370.3%+ 122.8%1125,5330.3%+ 99.5%109133116Jeep Avenger5340.3%+ 107.8%1064,8620.3%+ 80.0%120140117MG ZS5310.3%+ 221.8%1493,4970.2%+ 24.3%139158118Hyundai Ioniq55260.3%– 32.4%1044,8940.3%– 15.4%119113119Ford Transit Connect5160.2%+ 13.2%1103,7780.2%– 3.2%133128120VW ID.Buzz5100.2%+ 151.2%1075,7270.3%+ 165.6%108141121Porsche 9115070.2%+ 113.0%817,6510.4%+ 0.9%8396122Volvo XC905070.2%– 5.8%986,2820.3%+ 15.1%10199123Renault Captur4960.2%– 21.4%1245,1720.3%+ 22.1%116115124Mercedes CLE4770.2%– 39.0%937,1940.4%+ 54.4%89114125MG 44760.2%+ 153.2%1394,2080.2%– 60.9%13083126Citroen Jumper4750.2%– 37.3%1205,7700.3%– 20.1%10797127Porsche Cayenne4720.2%– 38.1%1364,7760.3%– 34.2%12298128Mercedes EQB4560.2%– 25.1%1015,0590.3%+ 16.5%117110129Mazda34430.2%+ 113.0%1613,0240.2%+ 29.5%147156130Skoda Scala4410.2%– 18.8%1184,8610.3%– 24.0%121102131BYD Seal U4360.2%+ 868.9%1233,4430.2%+ 1244.9%141273132Mercedes G-Klasse4330.2%+ 10.5%1254,3720.2%+ 9.5%127124133Peugeot 50084310.2%+ 114.4%1632,9750.2%– 18.0%149131134Peugeot 3084250.2%– 58.4%1325,5160.3%– 33.3%11179135Mercedes Citan4020.2%+ 226.8%1343,7650.2%+ 34.9%134146136Mercedes EQE3910.2%– 25.4%1303,9180.2%– 28.2%132104137Nissan Juke3890.2%– 22.0%1424,6230.2%– 1.0%124120138Mitsubishi ASX3740.2%+ 132.3%1602,3560.1%– 41.6%164137139Ford Capri3640.2%new1461,9290.1%new173281140Toyota bZ4X3600.2%+ 252.9%1054,3470.2%+ 280.6%128214141Mazda23580.2%– 48.6%1653,2560.2%– 48.4%143107142Peugeot 4083550.2%+ 104.0%1472,8660.2%+ 112.0%150188143Toyota RAV43540.2%– 8.5%1802,4880.1%– 36.2%160127144Ford Transit Courier3470.2%– 2.5%1532,7340.1%+ 20.9%155154145Kia Niro3460.2%– 40.3%2261,4380.1%– 68.1%191129146Peugeot Expert3460.2%+ 2206.7%1831,5890.1%+ 719.1%185294147Renault Kangoo3460.2%+ 36.8%1352,8110.1%– 22.0%152136148Volvo S/V603450.2%– 42.1%1583,1980.2%– 40.0%144109149Porsche Macan3360.2%+ 102.4%1294,0280.2%– 1.6%131118150Land Rover Defender3300.2%+ 142.6%1332,7630.1%+ 29.7%154164151VW Touareg3210.2%– 15.7%1164,3100.2%– 5.6%129119152Jeep Compass3200.2%– 2.4%1522,6610.1%– 10.0%156147153Audi Q73180.2%+ 59.0%1403,4920.2%+ 87.9%140150154Dacia Spring3150.2%+ 31400.0%1313,5650.2%+ 42.9%138157155Mitsubishi Colt3100.1%– 12.4%1763,0160.2%– 24.5%148139156Honda CR-V2960.1%+ 69.1%1941,4570.1%+ 42.0%190208157MG 32930.1%+ 103.5%1373,4160.2%+ 791.9%142185158Toyota Proace2870.1%– 29.1%1442,8250.2%– 23.5%151126159Citroen Jumpy2820.1%+ 252.5%1503,1650.2%+ 165.3%145189160BYD Seal2800.1%+ 250.0%1821,1410.1%+ 183.1%205265161Alfa Romeo Junior2780.1%+ 355.7%1512,7950.1%+ 4482.0%153289162Hyundai Bayon2760.1%– 24.4%1562,0190.1%– 36.1%169145163Fiat Grande Panda2560.1%new1816820.0%new239 –164Renault Symbioz2560.1%+ 11.3%1662,1790.1%+ 633.7%167218165BMW iX2530.1%– 0.8%1452,4180.1%– 9.2%163155166BMW X62520.1%+ 12.0%1681,8500.1%– 22.9%179159167Mercedes S-Klasse2520.1%+ 3.3%1881,9790.1%– 17.3%170168168Kia EV62510.1%– 49.6%1672,2790.1%– 35.7%165132169Kia Stonic2510.1%– 40.5%1542,5200.1%– 33.5%159130170Mitsubishi Outlander2470.1%n/a1731,3100.1%n/a198 –171Citroen Berlingo2340.1%+ 43.6%1772,4540.1%+ 66.0%161173172Nissan X-Trail2340.1%– 19.9%1593,0420.2%– 17.0%146134173BMW X42310.1%– 19.8%1721,9160.1%– 38.2%175144174Renault Espace2270.1%+ 31.2%1871,6560.1%+ 9.7%183181175Leapmotor C102190.1%new1919330.0%new219375176Renault Rafale2190.1%+ 72.4%1642,2430.1%+ 278.2%166206177BMW X72120.1%+ 13.4%1691,9020.1%– 14.5%177163178Suzuki SX42060.1%– 56.3%1981,6630.1%– 24.4%181162179Polestar 42030.1%+ 383.3%1431,4770.1%+ 1036.2%189257180VW Crafter2020.1%– 45.4%1622,4510.1%– 20.1%162149181Range Rover Evoque1940.1%+ 28.5%1841,5850.1%+ 13.1%186190182Mazda CX-801890.1%new1971,9200.1%new174247183Nissan Townstar1890.1%+ 15.2%1712,0320.1%+ 29.1%168183184Mercedes GLS1870.1%– 12.2%1921,3940.1%– 47.0%195160185Porsche Taycan1870.1%– 51.3%1701,9100.1%– 8.2%176151186Xpeng G61820.1%new2078710.0%new222318187Smart #51780.1%new2145290.0%new256 –188Hyundai Santa Fe1770.1%– 25.9%1481,9770.1%+ 129.9%171202189BMW Z41720.1%– 15.7%1742,6130.1%+ 2.5%157165190Renault 41680.1%new1856230.0%new247 –191Kia Sorento1670.1%– 29.5%1781,3060.1%– 51.7%199161192Range Rover Sport1610.1%+ 34.2%1551,9310.1%+ 27.9%172193193BYD Sealion 71550.1%new2278460.0%new223350194Peugeot Boxer1540.1%– 37.1%1931,6260.1%– 24.8%184174195Man TGE1530.1%+ 51.5%2089950.1%+ 4.2%214229196Mazda61530.1%+ 75.9%2785540.0%– 73.8%253172197Lexus LBX1500.1%– 10.7%2009540.1%+ 30.3%217226198Volvo EX301500.1%– 79.8%1573,6930.2%– 46.3%135103199Mazda MX-51430.1%+ 0.0%2109540.1%– 21.7%218209200Smart #11430.1%– 72.3%1951,4830.1%– 71.6%187116201Renault Arkana1380.1%– 56.5%1861,6580.1%– 25.8%182152202Mercedes EQS1370.1%– 14.4%2359990.1%– 41.5%213179203BMW 7er1360.1%– 17.6%1791,4330.1%– 29.1%192171204BYD Dolphin Surf1360.1%new2771,0270.1%new211 –205DS 71250.1%– 29.0%1891,4800.1%+ 9.4%188182206Subaru Forester1250.1%+ 0.0%2121,0090.1%+ 21.3%212215207Renault Trafic1240.1%+ 19.2%2019650.1%– 54.5%215166208Range Rover 1210.1%– 16.6%2061,1510.1%+ 6.7%204219209Alfa Romeo Stelvio1180.1%– 21.9%1901,1380.1%– 33.4%207187210Subaru Crosstrek1160.1%+ 52.6%2347280.0%+ 72.9%231255211Honda Jazz1140.1%+ 44.3%1961,1990.1%+ 66.3%203234212Audi A81130.1%+ 41.3%2398360.0%– 21.4%224212213Nissan Primastar1120.1%+ 0.0%2091,4210.1%+ 30.5%194213214Volvo EX901120.1%new2178810.0%new221330215Hyundai Ioniq91110.1%new2731560.0%new302 –216Polestar 21080.1%– 5.3%2111,0620.1%– 45.8%210184217Renault Scenic1060.1%– 6.2%2191,2200.1%+ 53.7%201201218Hyundai Staria1050.1%– 22.8%2206760.0%– 68.3%240177219Porsche Panamera1050.1%– 32.3%1751,3790.1%– 1.6%196195220Mercedes AMG GT1010.0%+ 26.3%2387030.0%– 26.7%237227221Suzuki Swace970.0%+ 142.5%2136250.0%+ 50.6%246260222KGM Tivoli960.0%+ 242.9%2256660.0%+ 52.4%241259223Smart #3920.0%– 30.8%2377570.0%– 42.2%229196224BMW 8er890.0%+ 45.9%2046590.0%– 37.5%243231225Alfa Romeo Tonale880.0%– 4.3%2365850.0%– 63.6%250192226Ford Mustang880.0%– 36.7%2031,1390.1%+ 3.0%206221227Range Rover Velar880.0%– 43.6%2241,0750.1%– 22.4%208200228Xpeng G9880.0%+ 203.4%2286390.0%+ 1001.7%244302229Kia EV9870.0%– 20.2%2189640.1%+ 6.2%216223230Lexus NX860.0%– 33.8%2408850.0%– 7.7%220205231MG S5860.0%new2442350.0%new290 –232Opel Zafira Life860.0%– 3.4%2228240.0%– 42.6%226197233Alfa Romeo Giulia850.0%+ 39.3%2417040.0%– 38.8%236220234Audi A7850.0%– 24.1%2021,2050.1%+ 35.9%202207235Fiat Panda840.0%+ 20.0%2291,4310.1%– 48.5%193142236Alpine A290750.0%new2434470.0%new268371237Audi e-Tron GT710.0%+ 97.2%2657780.0%– 22.3%228228238BMW XM690.0%– 22.5%2634490.0%– 45.2%265232239Audi A4680.0%– 96.0%2211,7750.1%– 92.8%18020240Lamborghini Urus660.0%+ 88.6%2306870.0%+ 37.1%238263241Honda ZR-V650.0%– 30.9%2056100.0%+ 5.5%248248242MG Cyberster640.0%new2472900.0%new281376243Subaru Outback630.0%– 33.7%2457140.0%– 15.6%235233244Honda HR-V610.0%– 56.1%2231,0730.1%– 2.4%209204245Fiat Ulysse600.0%+ 5900.0%2851000.0%+ 334.8%316364246Honda Civic590.0%– 40.4%2166620.0%– 7.0%242243247Opel Combo570.0%– 1.7%2895660.0%– 58.7%252203248BYD Atto 2550.0%new2527830.0%new227 –249Lexus RX550.0%– 53.4%2464490.0%– 28.6%266238250Genesis G90540.0%+ 980.0%2921090.0%+ 445.0%314355251Mazda MX-30540.0%– 40.0%2993150.0%– 68.5%278222252Hyundai Ioniq6530.0%– 64.7%2497260.0%– 61.8%233180253Iveco Daily530.0%– 20.9%2426300.0%– 14.9%245242254Volvo S/V90530.0%– 54.3%2557150.0%– 52.4%234199255Renault Master490.0%– 49.0%2515060.0%– 53.3%258225256Land Rover Discovery Sport440.0%– 15.4%2325310.0%– 22.9%255241257Fiat Tipo420.0%+ 68.0%2762840.0%– 79.6%283217258Ferrari 12Cilindri380.0%new2841990.0%new296395259Jeep Renegade360.0%– 26.5%2685370.0%– 59.2%254210260Lexus UX350.0%– 7.9%2584090.0%+ 2.0%271254261Nissan Ariya350.0%– 5.4%2488260.0%+ 165.6%225249262Renault Megane350.0%– 56.3%2913200.0%– 86.1%277175263Jeep Wrangler330.0%– 52.2%2697270.0%– 14.3%232235264Porsche Cayman330.0%– 57.1%2574610.0%– 49.7%263237265Ferrari Roma320.0%+ 39.1%2872300.0%– 24.3%292290266BYD Atto 3300.0%– 33.3%2667540.0%+ 58.7%230236267Mercedes SL300.0%– 47.4%2704940.0%– 44.9%262230268Ferrari 296 GTB290.0%– 12.1%2644090.0%– 8.9%270266269Genesis GV60290.0%+ 222.2%3191100.0%+ 59.4%313326270KGM Rexton290.0%+ 93.3%2562780.0%– 8.3%284286271Peugeot Rifter290.0%+ 222.2%2603890.0%+ 60.1%273285272Ferrari Purosangue280.0%– 22.2%2802620.0%– 1.9%287284273KGM Actyon270.0%new2722330.0%new291 –274KGM Torres270.0%+ 68.8%2503600.0%+ 12.9%275261275Maserati Grecale270.0%+ 92.9%2713120.0%+ 54.5%279296276Polestar 3270.0%– 15.6%2333830.0%+ 268.3%274300277KGM Korando250.0%+ 66.7%2755240.0%+ 102.3%257277278DS 4220.0%+ 57.1%2865010.0%– 14.9%259245279GWM Wey 05220.0%– 63.9%2905830.0%+ 4.1%251256280Lamborghini Coupe range210.0%– 58.8%2982350.0%– 42.0%289269281Opel Movano200.0%– 58.3%2972930.0%– 32.2%280267282Toyota Prius200.0%+ 33.3%3161270.0%– 13.0%309303283Toyota Land Cruiser190.0%– 20.8%2824950.0%– 3.9%261216284Bentley Continental180.0%+ 1700.0%2622890.0%– 23.9%282274285Ferrari SF90/Stradale180.0%– 35.7%3001730.0%– 25.1%300298286Genesis G70180.0%+ 500.0%301710.0%+ 20.3%327325287Jeep Grand Cherokee180.0%+ 260.0%293970.0%+ 27.6%318331288Lexus RZ180.0%+ 63.6%2963300.0%+ 358.3%276314289Lynk & Co 01170.0%+ 750.0%3154950.0%+ 931.3%260344290Subaru Impreza170.0%+ 21.4%312720.0%+ 44.0%326340291GWM Wey 03160.0%+ 23.1%2612470.0%+ 194.0%288309292Togg T10X160.0%new –170.0%new358 –293Land Rover Discovery150.0%+ 36.4%2942120.0%– 36.3%294276294Alpine A110140.0%– 6.7%3061540.0%– 54.4%303282295Lucid Gravity130.0%new –130.0%new364 –296Lynk & Co 08130.0%new326180.0%new355 –297Volvo C40130.0%– 78.0%2744120.0%– 51.1%269239298Xpeng P7130.0%+ 225.0%3131040.0%+ 593.3%315358299Bentley Bentayga120.0%+ 50.0%3021110.0%– 22.4%312307300NIO ET5120.0%– 33.3%329480.0%– 47.3%336324301Ford Mustang Mach-E110.0%– 94.1%2532670.0%– 83.6%285194302Ineos Grenadier100.0%– 76.2%2314060.0%+ 10.0%272271303BYD Dolphin90.0%– 79.5%2544560.0%+ 58.3%264280304BYD Tang90.0%n/a332970.0%+ 125.6%317349305Honda E:NY190.0%+ 0.0%308750.0%– 90.3%324252306Lexus LM90.0%+ 0.0%2951500.0%+ 154.2%304305307Lotus Eletre80.0%– 42.9%304950.0%– 8.7%320306308Maserati GranTurismo80.0%+ 33.3%281710.0%+ 86.8%328348309Tesla Model X80.0%– 33.3%372680.0%– 72.0%330295310Lexus ES70.0%– 72.0%310970.0%– 52.9%319292311NIO EL670.0%+ 133.3%347290.0%– 39.6%347339312Togg T10F70.0%new –70.0%new376 –313Lotus Emeya60.0%+ 100.0%322300.0%+ 100.0%346359314Cadillac Escalade50.0%+ 0.0%321620.0%– 21.5%331328315Lynk & Co 0250.0%new344240.0%new349 –316Toyota Supra50.0%– 61.5%353520.0%– 66.2%334301317DS No 840.0%new303230.0%new351 –318Genesis GV7040.0%– 89.5%3364480.0%+ 28.4%267264319GWM Ora 0740.0%– 77.8% –380.0%– 47.2%340337320Lucid Air40.0%– 69.2%2671230.0%+ 43.0%310287321Peugeot 50840.0%– 96.3%3111280.0%– 90.8%308191322Vinfast VF640.0%new324190.0%new354382323Iveco Stralis30.0%n/a36170.0%n/a372 –324NIO Firefly30.0%new –40.0%new383 –325Audi Q8 e-Tron20.0%– 99.1%3092620.0%– 93.1%286148326Fiat Scudo20.0%n/a325170.0%+ 70.0%356384327Iveco Eurocargo20.0%– 50.0%36080.0%– 73.3%371360328Man TGL20.0%n/a363120.0%+ 100.0%365389329Mercedes Actros20.0%n/a345150.0%+ 50.0%359383330MG 520.0%– 92.9% –2220.0%– 71.4%293251331Mitsubishi Space Star20.0%– 99.8%1996,6340.4%– 35.0%9372332Rolls-Royce Spectre20.0%– 60.0%342460.0%– 27.0%338336333Toyota Mirai20.0%– 84.6%373340.0%– 58.0%342312334VW Arteon20.0%– 99.0%3055910.0%– 84.7%249135335Dacia Logan10.0%– 97.4%355300.0%– 89.8%345272336DS 310.0%+ 0.0%343730.0%– 44.3%325299337Genesis G8010.0%– 80.0%335500.0%+ 38.9%335347338Lada Niva10.0%– 83.3% –10.0%– 96.3%407363339Lancia Ypsilon10.0%new –20.0%new393 –340Maserati Levante10.0%– 80.0%288610.0%– 14.1%332329341Mercedes Atego10.0%– 66.7%36870.0%– 63.2%373369342Mercedes Unimog10.0%n/a34660.0%+ 100.0%378391343NIO ES810.0%n/a348170.0%– 41.4%357354344Porsche Boxster10.0%– 98.1%340890.0%– 93.3%322224345Rolls-Royce Cullinan10.0%– 50.0% –20.0%– 96.1%395345346Tesla Model S10.0%– 91.7%351610.0%– 77.2%333291347Toyota Camry10.0%n/a –20.0%– 95.8%396351348Vinfast VF810.0%– 95.7%333690.0%+ 19.0%329310
Source: KBA


More Stories
Mazda MX-5 Miata Could Go Electric Eventually but Lightweight Fun Still Comes First
The Mazda MX-5 Miata has survived because Mazda understands what makes it special: low weight, rear-wheel-drive balance, simple controls, and...
Ford CEO Warns Chinese Automakers Could Enter the U.S. Within the Next Decade
Ford CEO Jim Farley is once again sounding the alarm on Chinese automakers, but this time with a more specific...
2027 Kia Seltos Invoice Price, Dealer Cost, and How to Get the Best Deal Near You
If you are shopping for a 2027 Kia Seltos and want to know what dealers are actually paying, what a...
2026 Kia Sportage Hybrid Invoice Price, Dealer Cost, and How to Get the Best Deal Near You
If you are shopping for a 2026 Kia Sportage Hybrid and want to know what dealers are actually paying, what...
2026 Toyota GRMN Corolla Pushes Track Focus to the Limit With a $65,655 Price
Toyota has taken the GR Corolla to its most extreme point yet with the 2026 GRMN Corolla, a limited-run hot...
Ferrari Luce EV Reportedly Sells Out as Controversial Electric Supercar Finds Its Buyers
Ferrari’s first all-electric vehicle may be one of the most controversial cars the brand has ever launched, but that has...