
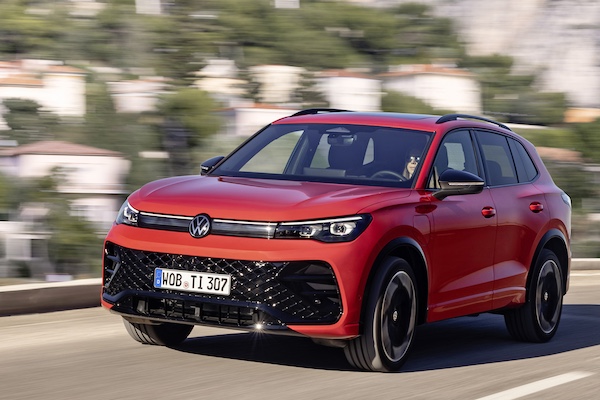
Switzerland November 2024: VW Tiguan repeats at #1 in struggling market (-10.5%)
The VW Tiguan is the most popular vehicle in Switzerland again.
New car sales in Switzerland are down a tough -10.5% year-on-year in November to 19,698 units, leading to a year-to-date tally off -4.9% to 214,181. 4×4 registrations fall -12.6% to 9,833 and 49.9% share vs. 51.1% a year ago and are down -3% year-to-date to 110,926 and 51.8% vs. 50.8% over the same period in 2023. Petrol sales freefall -25.2% to 5,092 and 25.9% share vs. 31% last year, Diesel sinks -25.2% to 5,092 but HEVs soar 17% to 7,298 and 37% share vs. 28.3% in November 2023. PHEVs drop -23.4% to 1,657 and 8.4% vs. 9.8% and BEVs skid -12.6% to 4,151 and 21.1% share vs. 21.6%.
Year-to-date, petrol is off -17.2% to 63,197 and 29.5% vs. 33.9% over the same period in 2023, diesel edges down -4.4% to 20,295 and actually improves its market share at 9.5% vs. 9.4% last year. HEVs are up 16% to 71,614 and 33.4% vs. 27.4%, PHEVs drop -9.3% to 18,538 and 8.7% vs. 9.1% and BEVs are off -10.9% to 40,517 and 18.9% vs. 20.2%.
In the brands charts, the Top 6 are all in negative, Volkswagen (-12.2%) falls faster than the market but keeps the lead at 11.1% share, distancing Skoda (-5%), BMW (-13.6%) and Audi (-5.9%) all up one spot on last month. Mercedes (-0.4%) is stable but drops three ranks on October to #5 with Toyota (-6.7%) staying at #6. Volvo (+31.4%), Dacia (+4.5%) and Renault (+3.7%) all defy the negative market in the remainder of the Top 10. Below, Cupra (+46.6%) outsells sister brand Seat (-32%) with Porsche (+16.7%) and Suzuki (+13.5%) also dynamic. Tesla is off -32.3% to #12 vs. #8 year-to-date.
Model-wise, the VW Tiguan (-3.5%) repeats at #1 with 2.1% share, illustrating once again how fragmented the Swiss market is. The Skoda Enyaq (-25.3%) is up five spots on last month to #2 but drops heavily on November 2023 when it ranked #1. The Tesla Model Y (-7.7%) beats the market at #3 and tightens its grip year-to-date as the #2, the Skoda Octavia (-41.7%) being down to #12 for the month. The Dacia Duster (+74.4%), Skoda Karoq (+35.4%), VW Golf (+24.7%) and Toyota Yaris (+20.3%) all impress in the remainder of the Top 10 with the Mercedes GLC (+5.3%) also managing a positive result at #5.
Previous month: Switzerland October 2024: VW Tiguan best-seller, sales off -7.9%
One year ago: Switzerland November 2023: Skoda 1-2 with Enyaq and Octavia
Full November 2024 Top 60 All brands and Top 350 All models below.
Switzerland November 2024 – brands:
PosBrandNov-24%/23Oct2024%/23PosFY231Volkswagen2,18211.1%– 12.2%120,9829.8%– 14.0%112Skoda1,8809.5%– 5.0%319,1969.0%+ 0.9%333BMW1,7679.0%– 13.6%419,8319.3%+ 5.1%224Audi1,6638.4%– 5.9%515,7977.4%– 13.3%545Mercedes1,5998.1%– 0.4%217,8438.3%+ 0.2%456Toyota1,0775.5%– 6.7%611,9735.6%– 2.8%667Renault8774.5%+ 3.7%107,7243.6%+ 0.4%1098Volvo8114.1%+ 31.4%88,4103.9%+ 17.7%7129Dacia7703.9%+ 4.5%97,2433.4%+ 2.4%111110Hyundai7153.6%– 10.4%77,8813.7%+ 2.1%91011Ford5762.9%– 14.4%116,8163.2%– 25.3%12712Tesla5362.7%– 32.3%198,0383.8%+ 4.8%8813Kia5292.7%– 13.8%126,0562.8%– 2.9%131414Peugeot4822.4%+ 8.1%134,8392.3%– 3.4%151515Cupra4312.2%+ 46.6%172,7891.3%– 33.6%211616Suzuki3862.0%+ 13.5%164,1131.9%+ 7.1%172017Seat3631.8%– 32.0%145,6732.6%– 10.6%141318Mazda3511.8%+ 7.0%183,7561.8%– 4.8%181919Porsche3081.6%+ 16.7%154,7812.2%+ 10.7%161820Fiat2891.5%– 36.9%203,1881.5%– 15.3%192121Mini2621.3%– 12.7%212,7611.3%– 22.3%222222Opel2241.1%– 66.1%232,9981.4%– 27.9%201723Citroen2161.1%– 37.9%242,4881.2%– 6.8%242424Honda1961.0%+ 2.1%222,7311.3%+ 28.7%232625Land Rover1800.9%+ 1.1%252,2261.0%+ 27.1%252826Mitsubishi1320.7%– 49.2%272,2221.0%+ 20.0%262727Subaru1020.5%– 25.5%331,3690.6%– 12.4%282928MG1010.5%new284730.2%new34 –29Nissan910.5%– 49.7%302,1071.0%– 21.9%272330Alfa Romeo830.4%+ 1.2%347730.4%– 44.8%323031Jeep800.4%– 67.6%261,2390.6%– 44.6%292532Smart770.4%– 13.5%298150.4%+ 15.6%313333Lexus760.4%– 35.6%318990.4%+ 16.5%303234Polestar590.3%+ 28.3%355190.2%– 31.8%333135KGM/SsangYong280.1%– 9.7%384250.2%+ 52.3%363936Maserati260.1%+ 4.0%413150.1%– 37.9%383637Genesis230.1%– 59.6%323260.2%– 48.6%373438Ferrari200.1%– 25.9%394400.2%– 4.8%353739Jaguar200.1%– 47.4%402890.1%– 21.9%393840DS150.1%– 72.2%362670.1%– 57.9%403541Aston Martin140.1%+ 100.0%431810.1%+ 27.5%424342Lamborghini100.1%– 33.3%422420.1%+ 9.5%414043Bentley90.0%– 40.0%441300.1%– 13.9%434244Lotus80.0%+ 100.0%47810.0%+ 8.0%464745Dodge80.0%+ 0.0%50470.0%+ 46.9%504946Rolls-Royce60.0%+ 50.0%51430.0%– 2.3%515047Alpine30.0%– 72.7%461030.0%– 9.6%444448Ineos30.0%– 80.0%55610.0%– 29.1%494649BYD30.0%new48370.0%new52 –50Chevrolet30.0%– 66.7% –350.0%– 60.7%534551Cadillac20.0%– 66.7%451020.0%+ 50.0%454852JAC20.0%– 84.6%37760.0%– 44.9%474153Aiways20.0%– 84.6%53620.0%+ 34.8%485154Lucid20.0%– 60.0%49220.0%+ 15.8%565355McLaren10.0%– 66.7% –350.0%– 2.8%545256Voyah10.0%new52270.0%new55 –57Man10.0%– 80.0%54150.0%– 6.3%585458Leapmotor10.0%new –10.0%new64 –59Iveco10.0%n/a –10.0%+ 0.0%6660 –Others150.1%– 42.3% –2170.1%+ 141.1% – –
Switzerland November 2024 – models:
PosModelNov-24%/23Oct2024%/23PosFY231VW Tiguan4092.1%– 3.5%14,0691.9%+ 22.2%352Skoda Enyaq4022.0%– 25.3%72,8791.3%– 32.0%1023Tesla Model Y3942.0%– 7.7%295,9522.8%+ 8.6%114Skoda Karoq3751.9%+ 35.4%33,2831.5%+ 10.2%7125Mercedes GLC3601.8%+ 5.3%43,8671.8%+ 18.8%486VW Golf3581.8%+ 24.7%102,7781.3%– 7.1%11107Dacia Duster3471.8%+ 74.4%62,5981.2%+ 10.8%14228BMW X13411.7%– 11.4%93,8061.8%+ 19.6%599VW Polo3281.7%– 12.3%412,3311.1%– 30.4%16610Toyota Yaris3201.6%+ 20.3%23,0801.4%+ 21.8%81911Skoda Kodiaq3171.6%+ 1.9%83,0191.4%+ 13.7%91712Skoda Octavia2991.5%– 41.7%55,0092.3%+ 10.1%2313Audi Q42951.5%– 32.0%112,2981.1%– 27.1%17714Audi Q32891.5%+ 5.5%153,5361.7%– 5.3%6415Skoda Fabia2691.4%+ 118.7%132,4571.1%+ 37.3%153516Peugeot 2082431.2%+ 158.5%161,4730.7%– 1.9%475117Hyundai Ioniq 52401.2%+ 336.4%191,4030.7%+ 20.0%516818Dacia Sandero2381.2%– 20.1%142,7071.3%– 6.3%131519Audi Q62341.2%new217210.3%new99 –20Mercedes GLA2161.1%+ 56.5%181,8320.9%+ 6.9%273821Volvo XC602151.1%– 0.9%232,1981.0%+ 8.9%192822VW T-Roc2111.1%– 7.0%392,0421.0%– 18.0%231823Toyota Corolla2061.0%+ 174.7%281,5050.7%+ 8.0%465424BMW 3 Series1961.0%– 14.0%202,0461.0%+ 8.7%222925Mercedes A Class1961.0%+ 35.2%121,6880.8%– 5.0%353226Audi A11901.0%+ 29.3%381,4320.7%– 9.8%494427Volvo EX301901.0%new342,7361.3%new1237828Cupra Formentor1810.9%+ 29.3%401,6230.8%– 33.0%412129BMW 5 Series1730.9%+ 133.8%989270.4%+ 30.6%7510230Renault Captur1700.9%+ 84.8%641,1540.5%+ 19.8%628231BMW 1 Series1670.8%+ 7.1%321,8000.8%+ 18.7%304332Fiat 5001630.8%– 35.8%531,7010.8%– 38.5%331633Toyota Yaris Cross1570.8%– 32.6%221,8990.9%– 12.3%242534Hyundai Tucson1570.8%– 23.8%331,6100.8%+ 0.8%423935BMW X51530.8%– 8.4%311,6930.8%+ 7.8%344036Citroen C31520.8%+ 123.5%921,1610.5%+ 86.4%6111437Dacia Jogger1480.8%– 15.9%571,6750.8%+ 16.0%384138BMW X31460.7%– 58.4%462,1361.0%– 23.8%201339BMW 2 Series1440.7%– 40.2%241,6760.8%– 16.2%372740Porsche Macan1440.7%+ 46.9%171,7370.8%+ 12.2%324941Audi Q51380.7%+ 16.0%351,5260.7%– 18.7%443342Volvo XC401360.7%– 36.2%431,3580.6%– 55.0%521143VW Touran1350.7%+ 51.7%1129090.4%+ 7.1%778144Renault Clio1320.7%– 13.2%591,8120.8%+ 62.2%287445Ford Puma1290.7%– 9.2%471,6380.8%– 18.2%403046Suzuki Swift1290.7%+ 11.2%491,4450.7%+ 18.1%485747Mercedes GLE1280.6%+ 10.3%361,4190.7%– 3.6%504848Kia Sportage1270.6%– 29.8%262,0731.0%+ 19.4%213449BMW ix11250.6%– 10.1%5512270.6%– 3.0%585650Ford Kuga1240.6%– 30.3%301,8080.8%– 6.5%293151VW T-Cross1220.6%+ 45.2%521,1200.5%+ 15.6%658052Mazda CX-301220.6%+ 139.2%1156340.3%– 11.3%10510653Seat Ibiza1200.6%+ 62.2%371,8660.9%+ 62.3%256154Mini Hatch (incl Cabrio, Clubman)1170.6%– 38.4%481,7880.8%– 27.9%312055VW ID.31160.6%– 45.8%581,5140.7%– 30.5%452356Audi Q21140.6%– 26.5%541,3400.6%+ 16.2%536457Audi A31130.6%– 61.8%272,2301.0%– 19.7%181458Mercedes V Class1130.6%– 26.1%451,2190.6%+ 2.3%596259Renault R51130.6%new2571320.1%new235 –60Toyota RAV41110.6%+ 29.1%251,2400.6%+ 6.3%566761Seat Ateca1090.6%– 48.1%441,6830.8%– 25.2%362462Mercedes C Class1050.5%– 6.3%651,3220.6%– 9.1%545063Skoda Kamiq1030.5%+ 0.0%691,1250.5%– 15.9%645964Volvo XC901020.5%+ 9.7%569020.4%+ 14.3%789465Tesla Model 31000.5%– 65.3%801,6700.8%+ 22.8%394766Mini Countryman1000.5%– 9.1%609270.4%– 13.8%767067Hyundai Kona980.5%– 58.5%501,8610.9%+ 17.3%264268Cupra Tavascan980.5%new682710.1%new176 –69VW Passat950.5%– 33.1%511,0180.5%– 14.4%706070Kia Niro950.5%– 20.8%737980.4%– 11.5%879071Opel Corsa920.5%– 22.0%1257270.3%– 26.9%987872Seat Leon900.5%– 29.1%811,1290.5%– 16.1%635373Mercedes Vito890.5%+ 41.3%1077350.3%+ 45.5%9712874VW Caddy860.4%+ 50.9%421,0660.5%+ 13.6%678775Volvo V60830.4%+ 144.1%1055880.3%+ 77.6%11016576Cupra Terramar820.4%new1301270.1%new237 –77Ford Focus810.4%+ 11.0%869870.5%– 36.2%734578Suzuki Ignis810.4%+ 32.8%629620.4%+ 32.3%7410579Mercedes E Class800.4%– 4.8%838600.4%+ 29.7%8310880Mitsubishi Space Star770.4%– 38.9%881,0200.5%– 8.4%696381Renault Austral760.4%– 20.8%1197900.4%– 27.5%897282Audi A5760.4%+ 442.9%2192690.1%– 10.0%17717283Renault Arkana740.4%+ 39.6%1544480.2%– 40.5%12710384Suzuki Vitara730.4%– 12.0%957720.4%+ 3.8%9210185Audi A6730.4%– 5.2%905740.3%– 11.7%11411086Mazda2720.4%– 14.3%661,0600.5%+ 13.7%688687Skoda Superb720.4%+ 38.5%728420.4%– 1.3%859588Peugeot 308710.4%– 48.9%961,5470.7%+ 21.6%435889Cupra Born700.4%– 54.5%1007680.4%– 56.8%932690VW ID.4700.4%– 52.1%1018980.4%– 42.6%793791Toyota C-HR700.4%– 47.4%611,2000.6%+ 8.1%607392VW ID.7690.4%+ 187.5%1423280.2%+ 1266.7%16025093BMW X2690.4%+ 392.9%777170.3%+ 184.5%10020194Audi Q8680.3%– 47.3%828430.4%– 40.4%844695Suzuki SX4 S-Cross680.3%+ 36.0%997130.3%– 23.8%1018896Kia Cee’d670.3%– 20.2%1376220.3%– 13.9%10610497Fiat Panda660.3%– 35.9%786800.3%+ 135.3%10316398Mazda CX-5610.3%– 31.5%851,0670.5%– 3.1%667199Porsche Cayenne610.3%+ 84.8%1039930.5%+ 52.5%72119100Kia EV3610.3%new328630.0%new283 –101Honda Jazz580.3%+ 87.1%1095390.3%– 17.8%118115102Ford Explorer580.3%+ 5700.0%1063380.2%+ 263.4%157249103Ford Custom570.3%+ 58.3%1482950.1%– 36.7%167141104Hyundai i30540.3%+ 100.0%1216610.3%+ 0.2%104112105Peugeot 3008530.3%+ 23.3%1364860.2%– 16.8%122126106Renault Rafale530.3%new713280.2%new159 –107MG 3520.3%new1651670.1%new206 –108Mercedes EQA510.3%– 48.5%898700.4%– 35.8%8155109Smart #3510.3%new1263650.2%new153 –110Land Rover Defender500.3%+ 16.3%1813800.2%– 23.5%150135111Hyundai i20490.2%– 55.9%948410.4%– 25.8%8669112VW Taigo490.2%– 35.5%1273980.2%– 52.6%14297113Renault Symbioz490.2%new1601940.1%new199 –114Opel Astra480.2%– 50.5%671,2340.6%+ 62.8%57100115Renault Scenic480.2%+ 700.0%705920.3%+ 294.7%109224116Renault Mégane460.2%– 74.2%757920.4%– 50.4%8836117Peugeot 2008460.2%– 30.3%1226000.3%– 4.6%108122118Renault Espace460.2%– 28.1%1395770.3%+ 101.7%113167119BMW 4 Series460.2%+ 64.3%1147480.3%– 23.8%9483120Hyundai i10450.2%– 52.6%637800.4%+ 31.3%90123121VW T6450.2%– 27.4%1331,0090.5%+ 1.7%7179122Subaru Forester450.2%+ 18.4%2592840.1%– 15.5%170164123Kia EV6450.2%+ 181.3%1943920.2%– 34.6%145124124Alfa Romeo Junior450.2%new183780.0%new271 –125Mini Aceman450.2%new –450.0%new304 –126VW T7440.2%– 29.0%978810.4%– 1.7%8085127Mercedes GLB440.2%– 27.9%766880.3%– 9.2%10298128Toyota Proace440.2%+ 25.7%1175480.3%+ 3.2%117130129Hyundai Santa Fe440.2%+ 266.7%1412470.1%– 37.3%183153130Skoda Scala430.2%– 29.5%935810.3%– 8.2%112117131Ford Connect430.2%+ 34.4%1514680.2%+ 10.9%125149132Range Rover Sport430.2%+ 95.5%1247380.3%+ 127.1%96168133Porsche 911420.2%– 37.3%1101,2500.6%+ 2.5%5565134Toyota Aygo420.2%– 25.0%1405860.3%– 11.6%111111135Audi Q7420.2%+ 133.3%1343270.2%+ 35.1%161196136Mercedes CLA410.2%– 4.7%1134310.2%– 27.9%134120137Honda ZR-V410.2%+ 17.1%744320.2%+ 191.9%131222138Mercedes G Class410.2%+ 51.9%1283830.2%– 18.7%149139139Mazda CX-60400.2%– 41.2%1533960.2%– 31.5%143116140Kia Picanto400.2%– 2.4%876030.3%+ 11.5%107129141Range Rover 400.2%+ 53.8%1314880.2%+ 44.0%120159142Fiat 600390.2%new1443100.1%new163313143BMW X7380.2%+ 35.7%1184100.2%+ 8.2%139156144Honda HR-V370.2%– 46.4%1807760.4%+ 44.0%91125145Dacia Spring370.2%– 42.2%1462630.1%– 34.1%180140146Subaru Crosstrek370.2%new1294460.2%new128 –147Mercedes CLE360.2%+ 50.0%1023690.2%+ 1376.0%152303148Vovlo EX90360.2%new238450.0%new305 –149Jeep Avenger340.2%– 20.9%797380.3%+ 196.4%95190150Opel Mokka330.2%– 82.5%1732690.1%– 71.7%17876151Nissan Qashqai330.2%– 52.9%1328700.4%– 23.5%8266152Renault Trafic330.2%+ 83.3%2202270.1%– 9.2%191194153Kia Stonic320.2%+ 28.0%844690.2%+ 21.5%124152154Toyota bZ4X310.2%– 42.6%1673500.2%– 47.0%154113155Kia Sorento310.2%– 8.8%1563850.2%+ 25.0%147171156Nissan Juke310.2%– 6.1%1574310.2%+ 55.0%135178157Peugeot 5008310.2%+ 14.8%1202330.1%– 14.7%188182158Mitsubishi Colt300.2%– 63.4%1764500.2%+ 448.8%126246159BMW i4300.2%– 48.3%1474290.2%– 25.3%137121160Citroen C5 Aircross290.1%– 60.3%1043870.2%– 10.0%146136161Tesla Model S290.1%– 54.7%2222070.1%– 55.9%197137162BMW X6290.1%– 9.4%1552710.1%– 2.5%175184163Volvo EX40290.1%new1592250.1%new192 –164Ford Mustang Mach-E280.1%– 50.0%1354020.2%– 50.2%14091165Honda CR-V280.1%+ 33.3%1523830.2%+ 40.3%148185166Suzuki Across280.1%+ 86.7%247930.0%– 23.8%258232167Lexus LBX280.1%new1492760.1%new174 –168MG ZS280.1%new1431440.1%new220 –169Polestar 4280.1%new1631410.1%new224 –170Opel Combo270.1%+ 22.7%2031490.1%– 34.1%219205171Smart #1260.1%– 61.2%1164220.2%– 11.9%138132172Ford Courier250.1%new1981350.1%new231 –173Mazda CX-80250.1%new145710.0%new274 –174Renault Kangoo240.1%– 68.8%1113390.2%– 19.9%156146175Seat Tarraco240.1%– 68.0%1665600.3%– 43.0%11677176Toyota Land Cruiser240.1%– 31.4%914000.2%+ 14.0%141162177BMW i5240.1%+ 33.3%1843000.1%+ 400.0%166273178Porsche Taycan230.1%– 36.1%1382830.1%– 42.7%172131179Mercedes EQB230.1%+ 9.5%1752540.1%– 8.3%182179180Polestar 2220.1%– 52.2%2093100.1%– 59.3%16496181Mitsubishi ASX220.1%– 33.3%1885210.2%+ 75.4%119175182Maserati Grecale220.1%– 4.3%1952070.1%– 40.0%196170183BMW IX210.1%– 53.3%1703700.2%+ 3.4%151145184Peugeot Rifter210.1%+ 16.7%2411570.1%– 43.5%214186185Alfa Romeo Tonale200.1%– 62.3%2264310.2%– 53.5%13389186Seat Arona200.1%– 58.3%1744350.2%– 24.6%129127187Range Rover Evoque200.1%– 35.5%1613110.1%+ 11.5%162180188Toyota GR86200.1%+ 25.0%1872920.1%+ 87.2%169221189Ford Capri200.1%new –200.0%new341 –190Fiat 500X190.1%– 42.4%3302320.1%– 28.2%189161191Honda Civic190.1%– 13.6%1773310.2%– 4.1%158169192Mazda3190.1%+ 72.7%1892590.1%– 8.5%181177193Opel Grandland X180.1%– 84.2%2273930.2%– 36.3%144107194Kia EV9170.1%– 76.7%1923070.1%+ 298.7%165237195VW ID.5170.1%– 73.0%2701260.1%– 76.2%238118196Audi A4170.1%– 72.6%1085640.3%– 34.5%11592197Jeep Wrangler170.1%– 26.1%1691250.1%– 58.3%239176198Range Rover Velar170.1%+ 0.0%2641350.1%– 4.3%232226199Porsche Boxster170.1%+ 466.7%2242220.1%+ 204.1%193276200BMW ix2170.1%new1794340.2%new130 –201BMW X4160.1%– 59.0%2232930.1%– 33.1%168147202Toyota Highlander160.1%– 42.9%2121650.1%+ 94.1%209247203Citroen Berlingo150.1%– 75.8%1862420.1%– 39.2%186157204VW Touareg150.1%– 62.5%1582810.1%– 34.7%173144205Hyundai Ioniq 6150.1%– 48.3%1712350.1%+ 23.0%187209206Lexus RZ150.1%+ 0.0%286580.0%– 33.3%288260207BMW XM150.1%+ 7.1%1641790.1%+ 30.7%203223208Jeep Compass140.1%– 85.7%2171610.1%– 83.3%21184209Lexus NX140.1%– 67.4%2002830.1%– 1.0%171181210Subaru Outback140.1%+ 0.0%2612430.1%+ 9.5%185204211Jaguar E-Pace140.1%+ 0.0%2621110.1%– 23.4%246229212Nissan X-Trail130.1%– 71.1%2104870.2%– 30.1%121109213Mercedes B Class130.1%– 43.5%1682110.1%– 20.7%194183214Honda e:Ny1130.1%– 7.1%2332640.1%+ 210.6%179259215Tesla Model X130.1%+ 0.0%2322090.1%– 42.4%195160216Mercedes Sprinter130.1%+ 85.7%2061410.1%+ 22.6%223242217Toyota Corolla Cross120.1%– 86.8%1993490.2%– 68.6%15575218Volvo C40120.1%– 72.1%2081870.1%– 78.4%20093219Genesis GV70120.1%– 52.0%1231560.1%– 37.6%215187220Peugeot Traveller120.1%– 20.0%2731650.1%+ 17.0%208228221Mercedes EQE110.1%– 72.5%1504320.2%+ 2.4%132148222Toyota Prius110.1%– 67.6%2392450.1%+ 0.4%184197223Porsche Panamera110.1%– 52.2%2071400.1%– 25.1%225211224Kia Xceed110.1%– 35.3%2481740.1%– 42.8%204174225MG HS110.1%new172550.0%new293 –226Citroen C3 Aircross100.1%– 84.4%2164840.2%+ 10.0%123143227Mercedes S Class100.1%– 37.5%2041740.1%– 32.3%205192228Alfa Romeo Stelvio100.1%– 37.5%1901590.1%– 45.9%212173229VW ID.Buzz90.0%– 88.9%2601360.1%– 66.8%230142230Hyundai Bayon90.0%– 50.0%2021310.1%– 26.0%236213231Ssangyong Torres90.0%+ 0.0%2931230.1%+ 179.5%241292232Citroen Jumpy90.0%+ 28.6%246810.0%– 34.1%268238233Porsche Cayman90.0%+ 125.0%2431550.1%+ 6.2%217234234Aston Martin DBX90.0%+ 200.0%285410.0%– 35.9%308280235Polestar 390.0%new215680.0%new277 –236Renault Twingo80.0%– 82.6%1931440.1%– 56.1%221166237Jeep Renegade80.0%– 80.0%1821580.1%– 69.7%213134238Alfa Romeo Giulia80.0%– 38.5%1961020.0%– 43.0%252216239Mercedes GLS80.0%– 27.3%1781550.1%+ 25.0%216233240Lexus ES80.0%– 20.0%321320.0%– 28.9%319299241Ssangyong Rexton80.0%– 11.1%2751100.1%+ 18.3%247256242Nissan Townstar80.0%+ 60.0%265580.0%– 51.3%289243243Mazda MX-580.0%+ 166.7%2801370.1%+ 20.2%229244244Jeep Grand Cherokee70.0%– 83.7%294570.0%– 72.3%291203245Audi e-tron GT70.0%– 46.2%240570.0%– 67.1%290214246Audi A770.0%– 36.4%256480.0%– 11.1%298291247Mercedes AMG GT70.0%+ 75.0%2131140.1%+ 15.2%243255248Genesis GV6060.0%– 75.0%2181070.0%– 60.5%248188249Lexus UX60.0%– 73.9%197860.0%– 31.7%262236250DS 460.0%– 57.1%272750.0%– 69.3%273198251Lamborghini Urus60.0%– 50.0%2811250.1%– 19.9%240225252Toyota Supra60.0%– 45.5%296400.0%– 44.4%311278253Ferrari Purosangue60.0%– 25.0%2681120.1%+ 833.3%245321254Ssangyong Korando60.0%+ 0.0%2351070.0%+ 32.1%249269255Ferrari 29660.0%+ 20.0%2051320.1%+ 21.1%234248256Lamborghini Huracan60.0%+ 100.0%237820.0%+ 34.4%267285257Dodge Durango60.0%+ 100.0%306210.0%+ 10.5%335322258Toyota Camry60.0%n/a307620.0%+ 40.9%285306259MG 460.0%new269980.0%new256 –260Land Rover Discovery Sport50.0%– 83.9%2251370.1%+ 8.7%227239261DS 750.0%– 79.2%1851420.1%– 40.3%222202262Opel Zafira50.0%– 61.5%278850.0%– 52.2%263215263Mercedes EQV50.0%– 58.3%249510.0%– 42.7%295254264Peugeot 50850.0%– 44.4%254640.0%+ 8.5%280286265Land Rover Discovery50.0%– 37.5%287370.0%– 15.9%314294266Ssangyong Tivoli50.0%– 28.6%236850.0%+ 39.3%264282267Ford Mustang50.0%+ 150.0%2421000.0%+ 8.7%255262268Renault Zoe40.0%– 90.9%2711640.1%– 66.1%210133269Lexus RX40.0%– 82.6%2111370.1%– 36.0%228206270DS 340.0%– 73.3%282470.0%– 66.4%300235271Bentley Continental GT40.0%– 60.0%252690.0%– 18.8%275266272BMW Z440.0%– 55.6%2531120.1%– 25.8%244227273Hyundai Staria40.0%– 55.6%3141060.0%– 49.5%250207274Subaru Soltera40.0%– 55.6%245640.0%– 61.0%281212275Genesis GV8040.0%– 20.0%266310.0%– 35.4%321298276BMW 7 Series40.0%+ 0.0%251820.0%– 2.4%266263277Ford Bronco40.0%+ 100.0%290260.0%+ 766.7%325371278Mercedes Citan40.0%+ 300.0%214920.0%– 14.8%259251279Aston Martin V8 Vantage40.0%+ 300.0% –150.0%– 40.0%351324280Suzuki Jimny40.0%n/a308470.0%+ 1075.0%301355281Lamborghini Revuelto40.0%new310400.0%new309 –282MG Marvel40.0%new277400.0%new310 –283Lotus Emeya40.0%new –90.0%new367 –284Fiat Tipo30.0%– 95.2%2211860.1%– 47.9%201150285Mitsubishi Eclipse Cross30.0%– 84.2%1912280.1%– 35.8%190154286Suzuki Swace30.0%– 80.0%234800.0%– 3.6%270267287Ineos Grenadier30.0%– 80.0%333610.0%– 29.1%286258288Kia Pro Cee’d30.0%– 75.0%2831380.1%– 6.1%226230289Alpine A11030.0%– 72.7%2671020.0%– 10.5%253241290Volvo S6030.0%– 70.0%335300.0%– 21.1%323308291Mercedes T Class30.0%– 66.7%274570.0%– 13.6%292274292Jaguar F-Type30.0%– 57.1% –350.0%– 16.7%316301293Ferrari Roma30.0%– 25.0%229840.0%+ 35.5%265281294Lotus Eletre30.0%– 25.0%288490.0%+ 188.2%297327295Mazda630.0%– 25.0%319430.0%– 77.7%307195296Rolls Royce Cullinan30.0%+ 50.0%338230.0%+ 4.5%331325297Alpina B3 Biturbo30.0%+ 200.0%309230.0%+ 9.5%327326298Bentley Flying Spur30.0%n/a –180.0%+ 0.0%347329299Nissan Ariya20.0%– 88.9%3121650.1%+ 12.2%207208300Aiways U520.0%– 84.6%324620.0%+ 40.9%284305301Jaguar F-Pace20.0%– 83.3%250810.0%– 32.5%269240302Bentley Bentayga20.0%– 60.0%301430.0%– 14.0%306300303Nissan Leaf20.0%– 60.0% –380.0%– 52.5%313265304Lucid Air20.0%– 60.0%276220.0%+ 15.8%334331305Subaru Impreza20.0%– 50.0%2841340.1%+ 191.3%233293306Ferrari 812 Superfast20.0%– 50.0%317480.0%– 53.4%299252307VW Crafter20.0%– 50.0%304210.0%– 19.2%338316308BMW i720.0%– 33.3%302460.0%– 40.3%302272309Dodge Challenger20.0%+ 0.0%337220.0%+ 120.0%333311310Maserati Granturismo20.0%+ 100.0% –320.0%– 5.9%320314311Volvo S9020.0%+ 100.0% –70.0%– 56.3%374334312JAC E-JS120.0%n/a162690.0%+ 6800.0%276394313Ferrari Daytona20.0%n/a –200.0%+ 122.2%340350314Rolls Royce Spectre20.0%n/a305190.0%+ 375.0%343367315Volvo EC4020.0%new231660.0%new279 –316BYD Seal20.0%new291230.0%new328 –317Mercedes AMG one20.0%new –130.0%new359 –318Opel Crossland X10.0%– 99.0% –1040.0%– 70.4%251151319VW Up!10.0%– 96.0%313390.0%– 87.9%312155320Renault Koleos10.0%– 94.7% –150.0%– 93.8%353199321Mazda MX-3010.0%– 94.4%340890.0%+ 217.9%260245322Chevrolet Corvette10.0%– 85.7% –230.0%– 58.9%329287323Volvo V9010.0%– 83.3%228670.0%– 10.7%278271324BMW 8 Series10.0%– 80.0%299630.0%– 38.8%282253325Man TGE10.0%– 80.0%320150.0%– 6.3%352332326Audi A810.0%– 75.0% –80.0%– 70.4%369319327Ferrari SF9010.0%– 66.7%300460.0%– 16.4%303284328Jaguar i-Pace10.0%– 66.7%303210.0%– 47.5%336304329Lexus LM10.0%– 66.7%34380.0%+ 100.0%370379330Nissan Primastar10.0%– 50.0%298530.0%– 13.1%294283331Genesis G8010.0%– 50.0%32360.0%– 85.0%380307332Alpina XD3 Biturbo10.0%+ 0.0%341160.0%+ 77.8%349346333VW Arteon10.0%+ 0.0%342140.0%– 72.5%355290334Rolls-Royce Ghost10.0%+ 0.0% –70.0%– 36.4%373342335Toyota Mirai10.0%+ 0.0% –50.0%– 79.2%387323336McLaren GT10.0%+ 0.0% –30.0%– 40.0%402373337Alpina B8 Biturbo10.0%+ 0.0% –20.0%– 33.3%414385338Cadillac XT610.0%+ 0.0% –20.0%– 60.0%415349339Aston Martin DB1210.0%n/a255600.0%+ 1900.0%287389340Maserati Levante10.0%n/a325310.0%– 56.9%322279341Lotus Emira10.0%n/a297230.0%– 59.6%330289342Maserati Ghibli10.0%n/a –210.0%+ 0.0%337328343Cadillac Escalade10.0%n/a34670.0%– 36.4%372333344Chevrolet Camaro10.0%n/a –60.0%n/a379407345Citroen SpaceTourer10.0%n/a –50.0%n/a386 –346Alpina XD4 Biturbo10.0%n/a –40.0%+ 33.3%394384347Chevrolet Tahoe10.0%n/a –40.0%– 50.0%395338348Iveco Daily10.0%n/a –10.0%+ 0.0%426414349Voyah Free10.0%new327260.0%new326 –350BYD Dolphin10.0%new –10.0%new425 –351Leapmotor T0310.0%new –10.0%new427 –
Source: Auto Suisse

More Stories
Switzerland March 2026: BYD smashes records, VW Golf remains on top
The VW Golf repeats at #1 after not winning for over 7 years. The Swiss new car market is up...
Portugal March 2026: Citroen C3 lodges third ever win in solid market
The Citroen C3 is the most popular vehicle in Portugal in March. Solid month for new car sales in Portugal...
Romania March 2026: Dacia Bigster repeats at record #2, Chery Tiggo 4 cracks Top 10
The Chery Tiggo 4 is inside the Romanian Top 10 in March. After two horrendous months, the Romanian new car...
The Complete Giovanna Wheels Buying Guide: Everything You Need to Know Before You Buy
Giovanna has built a strong name in the U.S. custom wheel market by offering true luxury-inspired design at a price...
2026 Hyundai Palisade Sales Resume After Hyundai Finalizes Rear Seat Safety Fix
Just weeks after we covered Hyundai’s stop-sale order on certain 2026 Palisade models, the story has taken an important turn....
Forza Horizon 6 in Japan Looks Like the Fan Dream That Finally Got It Right
After years of rumors, wishful thinking, and constant fan requests, Forza Horizon 6 looks set to deliver the setting players...