
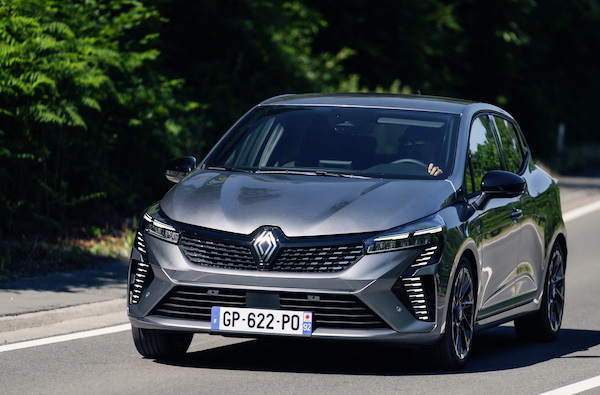
Belgium November 2024: Renault (+50.3%), Dacia (+20.6%) defy market off -15.3%
Renault is up to #5 in Belgium in November.
It’s a catastrophic month for new car sales in Belgium, down -15.3% year-on-year to 31,824 in November. As a result, the year-to-date tally is now off -5.8% to 424,839. BMW (-14.2%) keeps the lead of the brands charts, albeit at a much lower level as the past two record months: 11.9% share. Volkswagen (-24%) and Mercedes (-32.2%) both crash but ensure the podium is identical to October’s. Dacia (+20.6%) and most impressively Renault (+50.3%) defy the plunging market to round out the Top 5, with Dacia equalling its ranking record at #4. Tesla (+15.8%), Skoda (+10.5%) and Peugeot (+6.9%) also gain ground in the remainder of the Top 10. In contrast Volvo (-20.3%) and Audi (-49.8%) freefall. Below, notice BYD (+395.7%), Porsche (+129.6%) and Fiat (+34.7%)
Previous month: Belgium October 2024: BMW (+27.4%) at record heights, Dacia (+28.3%) shines
One year ago: Belgium November 2023: Audi (+64.4%) repeats at #2, Volvo (+56.3%) impresses
Full November 2024 Top 63 All brands ranking below.
Belgium November 2024 – brands:
PosBrandNov-24%/23Oct2024%/23PosFY231BMW3,79911.9%– 14.2%148,52811.4%+ 3.1%112Volkswagen2,9139.2%– 24.0%239,7379.4%– 7.5%223Mercedes2,1766.8%– 32.2%330,3497.1%– 10.0%444Dacia2,1666.8%+ 20.6%822,3525.3%+ 13.9%795Renault2,1496.8%+ 50.3%621,6635.1%– 7.7%866Audi2,0176.3%– 49.8%431,3947.4%– 6.5%337Peugeot2,0166.3%+ 6.9%520,3434.8%– 28.5%958Skoda1,7105.4%+ 10.5%717,7024.2%+ 1.1%11119Tesla1,6915.3%+ 15.8%1119,6734.6%+ 34.5%101310Volvo1,5354.8%– 20.3%923,6845.6%+ 18.9%5811Toyota1,4014.4%– 25.4%1022,4685.3%+ 1.2%6712Kia1,0743.4%– 19.2%1216,8044.0%– 5.1%121013Ford 8952.8%– 22.4%1411,3452.7%– 29.5%151214Hyundai7952.5%– 31.5%1611,5712.7%+ 5.3%131615Citroen7122.2%+ 31.6%1811,4102.7%– 24.4%141416Opel6492.0%+ 25.0%139,4582.2%– 31.6%161517Nissan6091.9%+ 18.9%158,2671.9%– 6.9%171718Porsche4271.3%+ 129.6%174,3261.0%+ 17.9%232619Mini3641.1%– 44.3%195,4241.3%– 29.8%191820Fiat2640.8%+ 34.7%273,4910.8%– 38.1%252121BYD2330.7%+ 395.7%222,3040.5%+ 351.8%273622Suzuki2240.7%– 28.4%214,8571.1%+ 12.8%222523Polestar2240.7%– 56.1%262,1830.5%– 7.5%282824Land Rover2180.7%– 38.8%205,4081.3%– 1.2%202225Seat2150.7%– 55.2%234,8831.1%– 22.1%212026Cupra1920.6%– 49.5%243,0000.7%– 32.0%262427Mazda1540.5%– 66.6%285,8611.4%– 9.7%181928MG1380.4%– 59.4%304,1251.0%+ 5.1%242329Lexus1340.4%+ 24.1%291,4180.3%+ 28.7%313430Jeep1200.4%+ 18.8%252,1210.5%– 22.5%292731Alfa Romeo820.3%– 2.4%348690.2%– 45.7%343032DS770.2%– 14.4%321,0730.3%– 56.8%322933SsangYong/KG Mobility620.2%+ 12.7%331,0660.3%– 2.7%333334Maxus530.2%n/a511510.0%+ 1158.3%415335Honda510.2%– 82.4%311,7300.4%+ 30.5%303136Smart510.2%+ 155.0%357180.2%+ 610.9%354237Xpeng440.1%new371820.0%new407538Lotus350.1%+ 40.0%363630.1%+ 116.1%373839Leapmotor310.1%new38620.0%new51 –40Jaguar170.1%– 70.7%414600.1%– 49.0%363541Maserati120.0%+ 71.4%431370.0%– 3.5%444042Tripod120.0%+ 140.0%421300.0%+ 113.1%454743Lancia110.0%new39530.0%new54 –44Subaru100.0%– 73.0%502520.1%– 31.5%393745Lamborghini80.0%+ 166.7%48990.0%+ 57.1%484846Allied Vehicles70.0%– 41.7%52580.0%– 23.7%534547Ferrari60.0%– 33.3%441450.0%+ 15.1%434348Forthing60.0%– 40.0%401000.0%+ 809.1%465549Bentley50.0%+ 25.0%55610.0%– 39.6%524450Livan50.0%new53100.0%new64 –51Aston Martin40.0%– 42.9%49820.0%+ 54.7%494952Alpine30.0%– 72.7%461480.0%– 10.3%423953SWM30.0%+ 200.0%61130.0%+ 8.3%625654BAIC20.0%– 80.0%47990.0%+ 54.7%474655DFSK20.0%– 71.4%45640.0%– 51.1%504156FAW20.0%n/a –290.0%+ 383.3%576557Omoda20.0%+ 100.0%5780.0%+ 60.0%66n/a58Man20.0%n/a –60.0%– 25.0%716459Rolls-Royce10.0%– 50.0%59220.0%+ 57.1%585860McLaren10.0%n/a60170.0%+ 70.0%595961Morgan10.0%+ 0.0%54130.0%+ 18.2%616162Caterham10.0%n/a6360.0%+ 200.0%706963API10.0%n/a –40.0%– 63.6%7460
Source: FEBIAC
More Stories
Is the GT1R Front Drag Pack the Ultimate Upgrade for Your Nissan GT-R?
If you are a car enthusiast, you know the feeling. You press the gas pedal, the engine roars, and you...
Uruguay November 2025: Chevrolet repeats at #1 with 15.2% share
Chevrolet holds 15.2% of the Uruguayan market in November. New light vehicle sales in Uruguay are off -1.1% year-on-year in...
How Mechanical Design Influences the Feel of a Vehicle
You know that feeling. You slide into the driver’s seat. You press the start button. The vehicle comes alive. It...
Competition Time. Chance to win a Smallest Cog goodies bundle.
The Smallest Cog Unveils Exciting New Merchandise Range Inspired by Richard Hammond’s iconic restoration workshop, The Smallest Cog’s exclusive new...
Florida Tolls Could Vanish for Residents as Tourists Pick Up the Tab
Florida drivers may eventually cruise the Turnpike without paying a cent at the toll gantries if a new idea from...
Extending Vehicle Lifespan Through Proven Engine Technology
We all want our cars to last. A vehicle is a major investment. It gets us to work. It takes...