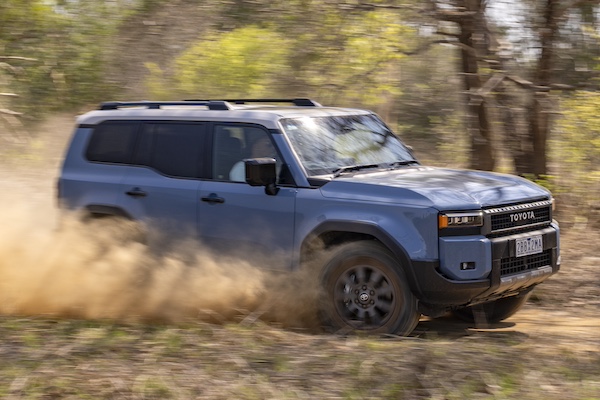
Australia November 2024: New generation pushes Toyota Prado to record #3
The Toyota Prado ranks at a record #3 in Australia in November.
New vehicle sales in Australia are down year-on-year for the 4th consecutive month in November at -9.3% to 101,707 units. The year-to-date volume remains at record levels however at 1,130,083, up 1.1% over the same period in 2023. A reliable indicator of consumer sentiment, private sales are depleted again this month at -16.6% year-on-year to 47,247. This follows drops of -14.2% in October, -17.2% in September and -15.9% in August. Business sales edge down -5.2% to 37,821, rental fleets struggle at -15.9% to 6,631 and government sales drop -2.3% to 3,078. All states and territories are in negative this month, with New South Wales at -10.1% to 31,229, Victoria at -6.9% to 27,569, Queensland at -10.2% to 21,772, Western Australia at -9.3% to 10,590, South Australia at -7.7% to 6,719, Tasmania at -18% to 1,658, Australian Capital Territory at -11.8% to 1,436 and Northern Territory at -20.3% to 734.
Looking at sales by segment, SUVs are stable at -0.1% to 62,306 and 61.2% share vs. 55.6% in November 2023 and 55.1% in 2022. Light Commercials freefall -23.3% to 20,544 and 20.2% share vs. 23.9% in 2023 and 22.6% in 2022 and passenger cars drop -21.3% to 14,543 and 14.3% share vs. 16.5% last year and 17.6% two years ago. Heavy commercials amount to 4,314 and 4.2% share. Petrol sales are down -14.4% to 43,229, diesel is off -17.6% to 30,818 but Hybrid shoots up 47% to 14,171 and PHEV soars 80.1% to 2,590. Lastly BEV sales sink -23.8% to 6,585 due to a Tesla slump. Looking at country of origin, Japan leads the way again at 32,717 (+1%) followed by Thailand at 20,785 (-21.3%), China at 16,808 (-6.8%), South Korea at 12,011 (-9.2%) and Germany at 4,740 (-12.8%).
Toyota limits its fall to -2.1% year-on-year to reach 20.2% share, slightly above the 19.7% it commands year-to-date. Ford (+6.8%) consolidates its 2nd place with a strong 8.6% share, same as last month. Mazda (-12.9%) is in difficulty and rounds out the podium, while Kia (+11.1%) leaps back up to #4, a ranking it also holds year-to-date. Mitsubishi (-1%) is stable at #5 ahead of Hyundai (-16.6%) struggling at #6. MG (-9.5%) follows the market and ensures the Top 7 brands are identical to YTD. GWM (-3.1%) ascends to #8 overall, which is a ranking record also hit in December 2023. In a sea of double-digit declines, Chery (+113.6%), Suzuki (+59.1%), Porsche (+37.8%) and BYD (+23.5%) stand out.
Model-wise, the Toyota RAV4 (+125.6%) scores a 5th straight monthly pole position, its 6th this year so far after April, July, August, September and October. It is the 8th time the RAV4 tops the Australian charts: add July 2020 and August 2020. Again this is not enough to topple the Ford Ranger (-20.9%) from the #1 YTD top spot. In third place and up from #296 last month we have the Toyota Prado (+16.2%) now that the new generation finally hits dealerships. This is simply the nameplate’s highest ever ranking in Australia, eclipsing the #4 it reached back in October 2020. The Toyota Hilux (-39.5%) is relegated to #4 for the month. Excellent score by the MG ZS (+36.5%) up 6 spots on last month to #5 while the Ford Everest (+97%) is down two to #6 but doubles its year-ago volume. The Kia Sportage (+13.3%) and Mitsubishi Outlander (+3.8%) are also up in the remainder of the Top 10.
Previous month: Australia October 2024: Toyota RAV4 #1 for 4th straight month
One year ago: Australia November 2023: Sales up 17.9% to all-time record, Hilux vs. Ranger battle heats up
Full November 2024 Top 48 All brands and Top 40 models below.
Australia November 2024 – brands:
PosBrandNov-24%/23Oct2024%/23PosFY231Toyota 20,56220.2%– 2.1%1222,63919.7%+ 13.6%112Ford 8,7208.6%+ 6.8%291,8658.1%+ 17.8%233Mazda 7,5887.5%– 12.9%388,7317.9%– 4.8%324Kia 6,4106.3%+ 11.1%575,4856.7%+ 7.0%445Mitsubishi6,2056.1%– 1.0%668,7936.1%+ 17.8%566Hyundai 5,6065.5%– 16.6%466,6395.9%– 5.2%657MG5,0725.0%– 9.5%746,3744.1%– 14.9%778GWM3,5663.5%– 3.1%938,7093.4%+ 19.0%10139Isuzu Ute3,3863.3%– 30.2%844,6143.9%+ 7.9%81010Nissan 3,3503.3%– 21.5%1241,0603.6%+ 11.8%91211Volkswagen3,2143.2%– 19.7%1033,7613.0%– 16.0%131112Subaru 3,0023.0%– 21.5%1137,6353.3%– 11.4%11913Tesla2,5402.5%– 35.5%1734,7543.1%– 20.9%12814Suzuki 2,2532.2%+ 59.1%1519,9231.8%+ 25.5%161815BMW2,2152.2%– 17.0%1423,8762.1%– 1.3%141516Mercedes1,9791.9%– 24.0%1322,6752.0%– 14.7%151417Chery1,7621.7%+ 113.6%1810,7180.9%+ 107.7%222918BYD1,5521.5%+ 23.5%1618,4651.6%+ 68.2%172119Audi1,4181.4%– 29.9%2113,7821.2%– 21.6%191720Lexus1,2351.2%– 2.8%1912,3691.1%– 12.0%211921LDV1,2201.2%– 33.6%2014,9351.3%– 24.1%181622Land Rover6630.7%– 12.2%267,3520.7%– 5.5%242323Volvo6220.6%– 12.8%238,2820.7%– 18.8%232224Porsche5500.5%+ 37.8%246,4270.6%+ 11.8%252725Honda 5470.5%– 56.5%2213,0071.2%+ 7.0%202026Renault4740.5%– 12.7%275,1380.5%– 32.2%262427Chevrolet4000.4%+ 6.1%293,8780.3%+ 15.9%293328Skoda3780.4%– 50.7%304,7570.4%– 35.4%282529Ssangyong3580.4%– 24.3%285,1020.5%– 6.8%272830Mini3480.3%+ 10.8%253,6760.3%– 8.3%303131Ram3150.3%– 15.3%313,5320.3%– 45.5%312632Cupra2110.2%– 58.9%332,0160.2%– 42.1%333233Jeep 1820.2%– 44.7%342,2570.2%– 47.6%323034Genesis1350.1%– 28.9%371,2870.1%– 28.6%373735Fiat1270.1%– 16.4%321,9650.2%+ 4.0%343636Peugeot900.1%– 60.9%361,7880.2%– 22.2%353437Polestar760.1%– 60.2%351,5360.1%– 25.4%363538Jaguar470.0%– 30.9%387030.1%+ 39.5%384039Alfa Romeo280.0%– 71.1%425380.0%– 18.4%393840Maserati260.0%– 52.7%433550.0%– 40.9%403941Ferrari220.0%+ 22.2%402350.0%+ 16.3%424442Bentley120.0%– 20.0%451630.0%– 17.7%434243Aston Martin120.0%– 42.9%461390.0%– 1.4%464644McLaren110.0%+ 266.7%47820.0%+ 1.2%474745Lamborghini100.0%– 60.0%412540.0%+ 16.5%414146Lotus90.0%– 59.1%481500.0%– 13.8%444547Citroen70.0%– 36.4%441440.0%– 32.7%454348Rolls-Royce70.0%+ 40.0%49490.0%+ 11.4%4848
Australia November 2024 – models:
PosModelNov-24%/23Oct2024%/23Pos1Toyota RAV45,5265.4%+ 125.6%153,5994.7%+ 95.4%22Ford Ranger4,9814.9%– 20.9%258,1005.1%+ 4.5%13Toyota Prado3,5903.5%+ 16.2%2967,1150.6%– 61.0%454Toyota Hilux3,5723.5%– 39.5%350,1664.4%– 10.4%35MG ZS2,7942.7%+ 36.5%1121,4621.9%– 22.6%86Ford Everest2,7372.7%+ 97.0%424,0182.1%+ 76.9%67Mitsubishi Outlander2,4722.4%+ 3.8%725,6222.3%+ 14.5%58Isuzu D-Max2,1802.1%– 41.0%527,8242.5%– 1.9%49Kia Sportage1,7661.7%+ 13.3%619,9971.8%+ 40.8%1010Mazda CX-51,7271.7%– 23.4%821,2371.9%– 2.0%911Tesla Model Y1,6531.6%– 47.5%2319,3921.7%– 29.3%1112Mazda CX-31,6241.6%+ 35.3%1317,0571.5%+ 17.4%1313Toyota Corolla1,5991.6%– 19.1%1222,5262.0%+ 24.5%714Hyundai Tucson1,5421.5%– 18.8%917,7431.6%– 10.5%1215Mitsubishi Triton1,5051.5%– 10.8%1516,4221.5%+ 7.4%1616Nissan X-Trail1,4951.5%+ 9.8%2415,3981.4%+ 29.2%1817Hyundai Kona1,2791.3%– 4.0%1016,4311.5%+ 61.3%1518GWM Haval Jolion1,2741.3%+ 23.8%3012,5471.1%+ 23.4%2419Mazda BT-501,2631.2%– 16.4%2014,0631.2%– 13.4%2220Isuzu MU-X1,2061.2%+ 3.9%1716,7901.5%+ 29.3%1421Mitsubishi ASX1,1761.2%+ 69.5%2211,3251.0%+ 32.4%2822Toyota Hiace1,1221.1%+ 36.7%1413,5791.2%+ 56.5%2323Suzuki Jimny1,1111.1%+ 349.8%359,0960.8%+ 94.7%3424Toyota Land Cruiser Wagon1,0821.1%– 25.8%1915,4861.4%+ 12.8%1725Hyundai i301,0801.1%– 31.0%1811,6161.0%– 40.7%2726Subaru Forester1,0381.0%– 29.4%2512,3861.1%– 17.1%2527Kia Cerato1,0351.0%+ 32.4%2914,8071.3%+ 187.5%2028Mazda CX-309671.0%– 10.5%2611,7701.0%– 4.4%2629Kia Carnival9090.9%+ 36.7%339,4120.8%– 8.7%3330Subaru Crosstrek8960.9%– 12.8%2810,6680.9%+ 32.5%3031Tesla Model 38870.9%+ 12.6%6315,3621.4%– 6.9%1932Nissan Patrol8580.8%– 8.8%367,5670.7%+ 4.3%4033BYD Sealion 68470.8%new275,0760.4%new6034MG 48210.8%– 1.7%166,0790.5%+ 140.6%5135Toyota Land Cruiser PU/CC8170.8%– 15.3%2111,1711.0%+ 8.1%2936Chery Tiggo 4 Pro7450.7%new681,0990.1%new13537Audi Q37360.7%+ 74.0%544,8640.4%+ 14.3%6438Subaru Outback7340.7%– 29.8%389,5910.8%– 20.5%3239Kia Stonic7150.7%+ 38.8%535,4670.5%– 17.0%5540Kia Sorento7140.7%+ 169.4%459,0930.8%+ 14.4%35
Source: VFACTS

