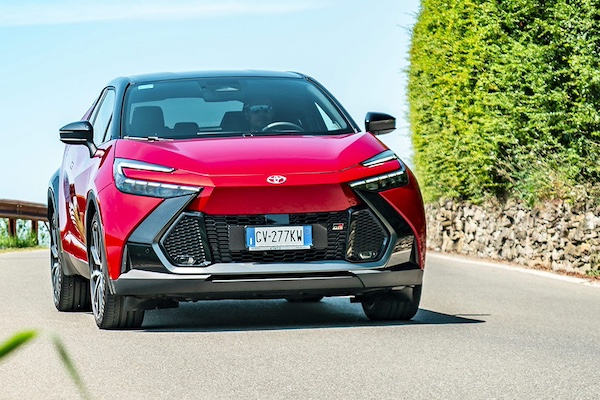
Italy November 2024: Toyota and Volkswagen top Fiat
Toyota is the most popular carmaker in Italy in November.
It’s a fourth consecutive month of decline for the Italian new car market in November at -10.8% year-on-year to 124,251 units. This way, the year-to-date tally tilts into negative territory at -0.2% to 1,452,973. This is -18.2% below pre-pandemic 2019. Private sales drop -6.5% to 75,179 and 59.8% share vs. 56.7% a year ago, self registrations edge down -0.7% to 15,035, long term leases sink -25.3% to 25,903 and short term rentals fall -25.8% to just 1,638. Year-to-date, private sales advance 4% to 851,003 and 57.9% share vs. 55.4% over the same period in 2023, self registrations are up 12.1% to 166,318 but long term leases drop -19% to 292,460 while short term rentals surge 25.1% to 76,706.
Petrol sales are off -12.1% to 34,497 and 27.4% share vs. 27.7% a year ago, diesel is down -23.7% to 15,886 and LPG down -18.8% to 11,319. In contrast HEVs (-0.4%) are stable at 53,551, including 17,729 full hybrid (+9.5%) and 35,822 mild hybrids (-4.6%). PHEVs sales freefall -31.8% to 3,944. Finally EVs struggle at -16.9% to 6,613 and 5.3% share vs. 5.6% in November 2023. Year-to-date, petrol is up 3.1% to 427,533, diesel down -22.8% to 204,546, LPG up 2.3% to 137,757, HEV up 10.2% to 589,946 including 171,992 full hybrids (+17.9%) and 417,954 mild hybrids (+7.3%), PHEVs drop -25.4% to 49,014 and EVs edge up 0.6% to 60,117 and 4.1% share vs. 4% over the same period in 2023.
First Top 50 finish at home for the Alfa Romeo Junior, directly at #29.
For the fourth month in a row, Fiat isn’t the best-seller at home, ranking #3 with just 7.1% share which is its 2nd lowest ever after the 6.9% hit last August. This month and for the 2nd time ever after last August, Toyota (+10.8%) is the most popular carmaker in the country with 9% share, a new record eclipsing its previous best of 8.6% reached last August. Volkswagen (+17.4%) follows in 2nd place and in great shape year-on-year. Only 16 sales below Fiat, Dacia (-2.2%) points its bonnet in 4th position with 7.1% share ahead of sister brand Renault (-2%) at 5.8%. Peugeot (+11.2%) and BMW (+4.3%) also defy the negative market in the remainder of the Top 10. Further down, Cupra is up 16.4%, Volvo up 13.6% and Tesla off -70.2%.
Over in the models charts, the Fiat Panda (-40.9%) stays on course despite a mediocre year-on-year evolution. The Dacia Sandero (+11%) defies the negative market to remain in 2nd place overall. The Citroen C3 (+36.2%) finally benefits from the new generation and climbs back up 12 spots on last month to #3. The Jeep Avenger (+16.4%) is toppled to #4 but remains #3 year-to-date. Outstanding result for the Toyota Yaris (+120.1%) overtaking its sibling the Yaris Cross (-2.6%). The rest of the Top 10 all post positive results: the Peugeot 208 (+67.7%) is the most dynamic followed by the VW T-Roc (+34%), Renault Captur (+16%) and Clio (+5.6%). The Toyota C-HR (+24.5%) lodges a second ever Top 20 finish at #19 while the Dacia Spring (+195.9%) rallies back up to #20, its highest ranking since October 2021. The new Alfa Romeo Junior makes its entrance inside its home Top 50 directly at #29.
Previous month: Italy October 2024: Fiat not #1 for third straight month
One year ago: Italy November 2023: Market up 16.2%, Nissan Qashqai at highest in close to 10 years
Full November 2024 Top 51 All brands and Top 50 models below.
Italy November 2024 – brands:
PosBrandNov-24%/23Oct2024%/23PosFY231Toyota11,1709.0%+ 10.8%2113,6557.8%+ 24.2%232Volkswagen10,6818.6%+ 17.4%1111,0197.6%– 0.9%323Fiat8,7947.1%– 41.7%3137,6729.5%– 16.1%114Dacia8,7787.1%– 2.2%490,7816.2%+ 11.3%445Renault7,2075.8%– 2.0%580,6155.5%+ 11.0%566BMW6,4475.2%+ 4.3%766,3214.6%+ 19.8%7107Peugeot5,9874.8%+ 11.2%673,2175.0%– 2.4%678Ford5,4664.4%– 14.1%964,5034.4%– 15.6%859Audi5,2764.2%– 6.9%1064,4334.4%+ 2.5%9910Jeep4,9784.0%– 14.7%864,4034.4%– 4.6%10811Citroen4,6293.7%+ 7.7%1852,9553.6%+ 7.5%111112Mercedes4,4223.6%– 10.6%1147,3023.3%– 0.4%121213Hyundai4,1553.3%– 10.6%1246,5013.2%+ 3.7%131314Kia3,7943.1%– 1.3%1344,9393.1%+ 1.9%141415Skoda3,3622.7%+ 3.3%1534,8202.4%+ 11.2%181916MG3,1852.6%+ 3.4%1636,4662.5%+ 35.3%162017Suzuki2,8012.3%– 5.2%1734,9272.4%+ 6.6%171818Opel2,6642.1%– 11.9%1441,7192.9%– 1.0%151619Alfa Romeo2,4792.0%– 9.1%2020,8841.4%– 17.4%212120Nissan2,4191.9%– 44.6%1932,5052.2%– 5.5%191721DR Motor1,7671.4%– 27.2%2117,2321.2%– 26.6%232222Cupra1,5931.3%+ 16.4%2415,1561.0%– 2.6%242423Volvo1,3921.1%+ 13.6%2217,7031.2%+ 13.7%222524Mazda1,2151.0%– 5.8%2313,1500.9%– 7.8%262725Mini1,0730.9%– 34.5%2511,4630.8%– 34.1%272326Lancia8120.7%– 79.7%2731,5392.2%– 24.7%201527Tesla8080.7%– 70.2%3414,2881.0%– 8.7%252628Land Rover7530.6%– 20.1%328,8880.6%– 9.4%292929EVO6730.5%– 24.3%296,0730.4%– 6.7%323130Seat6630.5%– 54.6%2810,8850.7%– 10.0%282831Honda6610.5%– 24.2%306,9860.5%+ 8.6%313332Porsche6190.5%+ 0.5%267,5920.5%+ 6.7%303033Lexus6180.5%+ 85.0%315,6130.4%+ 61.0%333634BYD5560.4%+ 1058.3%332,1370.1%+ 1149.7%37n/a35Omoda+Jaecoo4550.4%new361,9720.1%new39n/a36DS4390.4%– 3.7%354,9280.3%– 26.2%343237Subaru2540.2%+ 1.2%381,5420.1%– 37.2%403838Mitsubishi1920.2%+ 380.0%373,0400.2%+ 197.5%354039Smart1570.1%– 73.8%412,6990.2%– 43.2%363440EMC1260.1%+ 7.7%401,2100.1%+ 51.8%41n/a41Maserati1110.1%– 59.3%392,1220.1%– 41.8%383542Sportequipe720.1%– 16.3%478540.1%+ 99.1%44n/a43Polestar570.0%+ 103.6%482910.0%– 65.1%494144Ferrari470.0%+ 46.9%427360.1%+ 19.3%454345Lynk & Co390.0%– 78.3%459790.1%– 72.4%423746Jaguar390.0%– 65.5%448710.1%– 49.1%433947SsangYong250.0%+ 0.0%494520.0%+ 48.2%474548Lamborghini240.0%– 4.0%434740.0%+ 33.9%464449Lotus210.0%+ 0.0%463280.0%+ 160.3%484650Mahindra180.0%– 37.9%502110.0%– 66.7%504251Aston Martin80.0%– 33.3%51940.0%– 5.1%5147 –Others2700.2%+ 1.1% –1,8280.1%– 1.6% – –
Italy November 2024 – models:
PosModelNov-24%/23Oct2024%/23PosFY231Fiat Panda6,6455.3%– 40.9%195,3866.6%– 0.3%112Dacia Sandero5,4024.3%+ 11.0%257,1033.9%+ 23.8%223Citroen C33,9913.2%+ 36.2%1535,6582.5%+ 25.8%484Jeep Avenger3,8303.1%+ 16.4%338,5442.7%+ 87.8%3185Toyota Yaris3,4182.8%+ 120.1%729,9292.1%+ 39.5%8166Toyota Yaris Cross3,0992.5%– 2.6%434,5322.4%+ 6.6%547Peugeot 2083,0652.5%+ 67.7%529,8742.1%+ 32.1%9148VW T-Roc3,0042.4%+ 34.0%1628,2481.9%– 4.2%1169Renault Captur2,7292.2%+ 16.0%1129,4792.0%+ 5.5%10710Renault Clio2,6432.1%+ 5.6%633,2312.3%+ 47.9%61311MG ZS2,4642.0%+ 5.4%1925,1811.7%+ 39.7%142212Ford Puma2,4512.0%– 17.5%1026,3961.8%– 7.6%12913VW Tiguan2,3001.9%+ 99.8%1218,4061.3%+ 21.7%212814VW T-Cross2,1721.7%+ 2.5%922,1101.5%+ 9.9%162015BMW X12,0531.7%– 3.9%1819,4761.3%+ 42.7%203216Opel Corsa1,8951.5%+ 9.0%825,0061.7%+ 14.4%151717Toyota Aygo X1,7831.4%– 31.0%1719,8521.4%+ 38.0%193018Kia Sportage1,7221.4%– 5.4%1321,0721.5%+ 13.8%182319Toyota C-HR1,5671.3%+ 24.5%2214,6291.0%+ 68.5%26n/a20Dacia Spring1,5061.2%+ 195.9%n/a2,9700.2%+ 41.4%n/an/a21Peugeot 20081,4731.2%– 27.0%2122,0131.5%+ 2.7%171522VW Golf1,4621.2%+ 279.7%2011,7180.8%+ 21.5%344523Hyundai Tucson1,4401.2%+ 30.0%3111,1430.8%– 16.3%373424Dacia Duster1,4291.2%– 54.2%1426,1991.8%– 8.9%131025Audi Q31,1941.0%+ 11.9%2816,6201.1%+ 12.9%243126Hyundai i101,1670.9%– 24.7%2314,7141.0%+ 10.8%253327Kia Picanto1,1490.9%+ 37.6%2911,7600.8%+ 6.8%333928Nissan Qashqai1,1460.9%– 60.5%3917,2111.2%– 12.1%222129Alfa Romeo Junior1,1040.9%newn/an/an/anewn/a –30Mercedes GLA1,0880.9%– 22.9%2412,2200.8%+ 11.0%323731DR 5.01,0440.8%n/a448,7230.6%n/a49n/a32Suzuki Swift1,0040.8%+ 69.3%359,3410.6%+ 26.1%45n/a33Fiat 6009930.8%n/a26n/an/an/an/an/a34Ford Focus9630.8%– 16.6%3410,9810.8%– 27.7%392935Nissan Juke9480.8%– 22.9%3011,0910.8%+ 10.0%384036Renault Austral9410.8%– 19.2%50n/an/an/an/a4637Ford Tourneo Courier9170.7%new437,9600.5%newn/an/a38Ford Kuga9020.7%– 27.6%2512,3510.9%– 25.8%312739Alfa Romeo Tonale8770.7%– 55.5%4013,3870.9%– 25.0%282540Skoda Fabia8770.7%+ 34.3%378,8860.6%n/a48n/a41Skoda Kamiq8200.7%+ 1.9%468,9660.6%n/a47n/a42BMW Serie 18130.7%+ 46.8%387,4640.5%– 12.5%n/an/a43Lancia Ypsilon8110.7%– 79.7%n/a31,5332.2%– 24.7%7344Audi A38050.6%– 31.8%4711,2250.8%+ 5.7%364145Suzuki Vitara8010.6%+ 23.8%3610,1570.7%+ 14.4%415046BMW X37900.6%– 30.9%n/a6,6470.5%– 7.8%n/an/a47Audi A17800.6%+ 10.3%n/an/an/an/an/a4748Cupra Formentor7580.6%– 16.2%499,3840.6%– 20.7%433649Peugeot 30087330.6%– 29.6%4110,6120.7%– 43.1%402450Volvo XC406980.6%n/a457,6050.5%+ 15.7%n/an/an/aVW Polo6660.5%– 55.5%2712,5270.9%– 25.4%3026n/aJeep Compass6320.5%– 57.7%4213,5570.9%– 35.3%2719n/aHyundai i206150.5%– 22.4%3210,0970.7%n/a42n/an/aTesla Model Y5520.4%– 21.5%n/a6,7330.5%– 16.0%n/an/an/aSuzuki Ignis5440.4%– 55.3%489,3710.6%– 7.9%4443n/aJeep Renegade5280.4%– 57.6%n/a13,0490.9%– 53.3%2911n/aVW Taigo5090.4%– 27.4%n/a8,6960.6%– 0.7%5049n/aTesla Model 32280.2%– 88.3%n/a7,2940.5%+ 3.8%n/an/an/aFiat 5002040.2%– 85.5%n/a16,9281.2%– 46.5%235n/aFiat 500X210.0%– 98.7%n/a11,2360.8%– 57.3%3512n/aCitroen C3 Aircross130.0%– 98.8%n/a9,2180.6%– 25.9%4635
Source: UNRAE
