
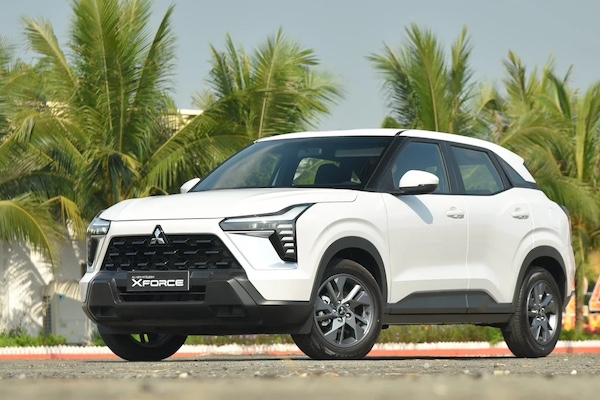
Vietnam March 2024: Mitsubishi Xforce land directly at #3
The Mitsubishi Xforce is an instant blockbuster in Vietnam.
According to data by local association VAMA, the Vietnamese new vehicle market drops -9.2% year-on-year in March to 27,289 sales, leading to a year-to-date tally down -17.4% to 58,165. This is a much better result than the -49.5% of last month. When adding Hyundai figures reported separately from VAMA, the monthly tally climbs to 31,831 (-8.8%) and 68,309 YTD (-18.9%).
In the manufacturers ranking, Hyundai (-21.3%) reclaims the top spot it holds year-to-date off Thaco-Kia (-22.9%) for just 200 sales. Toyota (-31.7%) climbs back up three spots on February but suffers year-on-year. Ford (-5.2%) and Mitsubishi (-5.9%) manage to contain their losses but Honda (+90.2%) ignores the negative market at #6. Suzuki (+8.2%) and Isuzu (+1.4%) also impress.
The Mitsubishi Xpander (-30.9%) is back to pole position despite a dreadful drop but still ranks #2 year-to-date. Leader last month, the Ford Ranger (+4%) falls to #2 but retains the YTD leader. The performance of the month is delivered by the new Mitsubishi Xforce landing directly at #3 with 4.2% of the market. The Honda City (+28.1%) and HR-V (+125.2%) both post fantastic gains in the remainder of the Top 10.
Previous month: Vietnam February 2024: Ford Ranger triumphs in imploding market (-52%)
One year ago: Vietnam March 2023: Ford once again defies struggling market (-20.7%)
Full March 2024 Top 16 All brands and Top 70 All models below.
Note: The brands ranking includes medium and heavy commercial vehicles, the models ranking does not.
Vietnam March 2024 – brands:
PosBrandMar-24%/23Feb2024%/23PosFY231Hyundai4,54214.3%– 21.3%210,14414.9%– 31.2%112Thaco-Kia4,34213.6%– 22.9%19,66414.1%– 23.2%233Toyota3,86512.1%– 31.7%67,32110.7%– 46.0%424Ford3,48611.0%– 5.2%37,82111.4%– 9.8%345Mitsubishi3,43910.8%– 5.9%76,0508.9%– 14.5%666Honda2,8328.9%+ 90.2%56,1199.0%+ 40.1%577Mazda2,3507.4%– 12.3%45,6778.3%– 17.1%758Suzuki1,7505.5%+ 8.2%84,0115.9%+ 12.3%899Isuzu8662.7%+ 1.4%91,7002.5%+ 1.2%91010Hino2830.9%– 3.1%124830.7%– 22.3%111211Peugeot2310.7%– 7.6%106220.9%– 12.0%101112Hyundai Trucks1860.6%+ 190.6%143910.6%+ 77.7%121513BMW+Mini1590.5%+ 17.8%113720.5%– 18.4%131314Lexus1080.3%– 43.8%133000.4%– 2.9%141415Samco240.1%– 14.3%151040.2%+ 197.1%151616Daewoo Bus120.0%– 29.4% –120.0%– 47.8%1618
Vietnam March 2024 – models:
PosModelMar-24%/23Feb2024%/23PosFY231Mitsubishi Xpander1,5825.0%– 30.9%23,5085.1%– 21.1%212Ford Ranger1,5394.8%+ 4.0%13,5625.2%– 2.6%143Mitsubishi Xforce1,3344.2%new –1,3342.0%new12 –4Honda City1,0433.3%+ 28.1%32,1653.2%– 11.7%5105Hyundai Accent9673.0%– 28.6%62,2483.3%– 43.0%426Toyota Vios9342.9%– 11.0%221,7572.6%– 20.0%957Mazda CX-59122.9%– 10.7%42,3193.4%– 5.5%338Ford Everest8992.8%– 17.4%72,0353.0%– 18.9%699Honda HR-V7592.4%+ 125.2%81,8422.7%+ 201.5%82810Kia Sonet7512.4%– 25.8%51,8892.8%– 5.8%7611Toyota Yaris Cross7022.2%new301,1551.7%new163412Suzuki XL76772.1%+ 114.2%151,3462.0%+ 75.5%103913Honda CR-V6492.0%+ 185.9%231,0801.6%+ 15.9%181914Ford Territory6021.9%– 22.4%141,2121.8%– 34.7%131315Hyundai Grand i105981.9%– 9.9%101,3412.0%– 40.3%111416Ford Transit5831.8%+ 100.3%211,0091.5%+ 83.5%212617Toyota Veloz5691.8%– 37.7%269681.4%– 59.5%231218Hyundai Creta5491.7%– 47.0%121,2001.8%– 54.7%14719Suzuki Carry5451.7%+ 33.6%191,1901.7%– 4.4%153220Kia Carnival4981.6%– 7.8%91,1051.6%– 8.4%172121Mazda24531.4%+ 2.7%111,0751.6%+ 3.6%192522Toyota Raize3921.2%– 39.3%208361.2%– 50.2%252423Mazda33501.1%– 16.7%139821.4%– 18.6%221524Kia Seltos3401.1%– 54.7%161,0661.6%– 28.0%201125Kia Carens3321.0%+ 16.1%178371.2%+ 9.1%243026Hyundai Tucson2940.9%– 4.2%316200.9%– 15.2%301827Toyota Wigo2880.9%n/a245200.8%n/a354528Hyundai Custin2840.9%new296551.0%new284629Suzuki Carry Pro2840.9%new186200.9%new316730Honda BR-V2720.9%new287271.1%new263531Kia K32720.9%– 22.3%345520.8%– 37.2%333332Hyundai Venue2640.8%new256070.9%new326933Hyundai Santa Fe2580.8%– 49.8%275200.8%– 61.4%341634Toyota Innova Cross2310.7%new552720.4%new486135Mitsubishi Triton2160.7%– 39.2%414350.6%– 25.5%373836Mazda CX-32140.7%+ 18.9%434220.6%– 15.6%384837Toyota Fortuner2110.7%– 44.8%353600.5%– 62.3%423138Mazda CX-82020.6%– 21.7%324820.7%– 21.5%363639Toyota Avanza1960.6%– 47.6%364080.6%– 52.4%392940Mazda CX-301810.6%+ 9.7%382860.4%– 38.5%464741Mitsubishi Attrage1760.6%– 73.7%423930.6%– 70.9%402242Suzuki Ertiga1670.5%+ 234.0%496320.9%+ 371.6%295443Kia Sportage1530.5%– 49.7%403380.5%– 57.9%444244Hyundai Elantra1490.5%– 38.2%393780.6%– 46.3%413745Toyota Camry1310.4%– 58.4%373150.5%– 60.3%454146Hyundai Palisade1090.3%new452410.4%new496347Honda Civic980.3%– 8.4%462740.4%– 24.3%475348Mitsubishi Outlander910.3%– 59.6%541910.3%– 59.6%514049Toyota Corolla Cross800.3%– 94.5%333570.5%– 89.6%43850Kia Morning730.2%– 57.1%481820.3%– 62.0%534951Toyota Innova640.2%– 74.3%477271.1%+ 29.6%274452Ford Explorer630.2%+ 53.7%502030.3%+ 107.1%506553Kia Sorento490.2%– 73.4%531440.2%– 68.6%555054Isuzu D-Max470.1%– 59.8%62760.1%– 67.7%606255Mitsubishi Pajero Sport400.1%– 66.1%601890.3%– 16.7%525856Mazda6380.1%– 63.8%581060.2%– 65.6%585557Suzuki Jimny380.1%new –380.1%new63 –58Toyota Corolla370.1%– 79.6%511220.2%– 74.7%575259Suzuki Swift320.1%– 13.5%521640.2%+ 69.1%546460Kia Soluto320.1%– 68.9%56920.1%– 67.7%595661Kia K5240.1%– 76.0%59740.1%– 68.8%615762Toyota Land Cruiser190.1%– 32.1%57540.1%– 47.6%626063Honda Accord110.0%+ 175.0%61310.0%+ 158.3%657364Toyota Alphard110.0%+ 0.0%64220.0%– 29.0%667065Isuzu MU-X100.0%– 23.1%63350.1%+ 2.9%646666Suzuki Super Carry Pro60.0%– 99.3%65170.0%– 98.7%672067Suzuki Ciaz10.0%– 66.7% –40.0%– 42.9%707468Hyundai Stargazer00.0%– 100.0%441300.2%– 87.9%562769Toyota Yaris00.0%– 100.0%6680.0%– 88.2%687270Mazda BT-5000.0%– 100.0% –50.0%– 98.1%6959
Source: VAMA, Hyundai
More Stories
Mazda MX-5 Miata Could Go Electric Eventually but Lightweight Fun Still Comes First
The Mazda MX-5 Miata has survived because Mazda understands what makes it special: low weight, rear-wheel-drive balance, simple controls, and...
Ford CEO Warns Chinese Automakers Could Enter the U.S. Within the Next Decade
Ford CEO Jim Farley is once again sounding the alarm on Chinese automakers, but this time with a more specific...
2027 Kia Seltos Invoice Price, Dealer Cost, and How to Get the Best Deal Near You
If you are shopping for a 2027 Kia Seltos and want to know what dealers are actually paying, what a...
2026 Kia Sportage Hybrid Invoice Price, Dealer Cost, and How to Get the Best Deal Near You
If you are shopping for a 2026 Kia Sportage Hybrid and want to know what dealers are actually paying, what...
2026 Toyota GRMN Corolla Pushes Track Focus to the Limit With a $65,655 Price
Toyota has taken the GR Corolla to its most extreme point yet with the 2026 GRMN Corolla, a limited-run hot...
Ferrari Luce EV Reportedly Sells Out as Controversial Electric Supercar Finds Its Buyers
Ferrari’s first all-electric vehicle may be one of the most controversial cars the brand has ever launched, but that has...