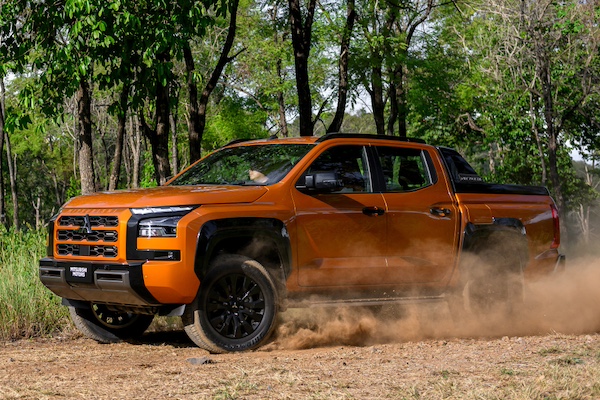
New Zealand March 2024: Mitsubishi (+76.6%) defies devastated market
Mitsubishi Triton sales are back up 124% year-on-year in March.
In March New Zealand new vehicle sales sink -27.3% year-on-year to 11,616 units. This is a particularly poor result given March 2023 was already down -24% on the year prior. The Q1 volume is off -10.7% to 33,878. Passenger Cars are down -34.8% to just 1,509 sales, SUVs are also off -34.8% to 6,048 and lift commercials fare better at -5.9% to 3,367. Year-to-date, Passenger Cars are down -34.6% to 3,937, SUVs off -16.4% to 17,599 and LCVs actually up 14.1% to 10,219.
Toyota (-9.8%) resists much better than the market to 20.6% share, by far the most popular brand in the country. The surprise of the month is Mitsubishi shooting up 76.6% to 12.8% share, overtaking Ford (-22.3%) to snap the 2nd place in the brands ranking. To be fair, its March 2023 sales were down -76.4% on the year prior. GWM (+469.9%) also posts a surreal gain and advances to #8. Kia (-22.9%) and Nissan (-25.7%) manage to keep their losses below the market evolution but it’s not the case for Hyundai (-68.4%), Suzuki (-52.5%), MG (-44.9%) and Honda (-35%).
Model-wise, the Ford Ranger (-24.5%) hold onto the top spot by a fair margin over the Toyota RAV4 (+45.1%) in excellent shape. The Mitsubishi Triton (+124%) makes up for a paltry year-ago score to climb to third place overall, dislodging the Toyota Hilux (-26.7%) down to #4. The Kia Stonic (+55.7%) surges to 5th place overall (31% rentals) ahead of the Kia Seltos (+78.6%) and Mitsubishi Outlander (+89.2%) at 47% rentals. The Mitsubishi ASX shoots up from outside the March 2023 Top 20 directly into 8th place for the month.
Previous month: New Zealand February 2024: Nissan, GWM shine in market up 1.5%
One year ago: New Zealand March 2023: Suzuki, Kia, Hyundai defy market down -24%
Full March 2024 Top 72 All brands and Top 20 models below.
New Zealand March 2024 – brands:
PosBrandMar-24%/23Feb2024%/23PosFY231Toyota2,39020.6%– 9.8%16,99920.7%+ 1.9%112Mitsubishi1,48912.8%+ 76.6%33,97811.7%+ 39.7%333Ford 1,40912.1%– 22.3%24,92314.5%+ 16.8%224Kia9688.3%– 22.9%62,2176.5%– 29.7%445Nissan5564.8%– 25.7%51,5434.6%+ 14.0%596Hyundai3973.4%– 68.4%109992.9%– 60.2%757Suzuki3853.3%– 52.5%41,4124.2%– 34.5%668GWM3192.7%+ 469.6%118922.6%+ 783.2%11259Honda3182.7%– 35.0%79762.9%– 15.9%81310MG3072.6%– 44.9%127262.1%– 44.0%13711Mazda2872.5%– 51.5%89422.8%– 23.8%91012Volkswagen2762.4%– 1.1%99202.7%+ 13.9%101113Mercedes2282.0%– 16.5%146011.8%– 6.4%141414Tesla1991.7%– 77.3%153781.1%– 69.4%17815BMW1941.7%+ 5.4%204521.3%– 5.4%161916Isuzu1921.7%– 40.4%137752.3%+ 7.0%121517Subaru1471.3%– 27.9%164921.5%– 28.6%151618Land Rover1451.2%– 16.7%183631.1%– 12.1%182319Fuso1341.2%+ 4.7%222770.8%– 12.9%222220Lexus1311.1%– 6.4%173591.1%+ 42.5%192121Audi1211.0%+ 6.1%213351.0%– 0.3%202022Skoda1131.0%– 31.5%193010.9%– 31.1%211823Mini890.8%+ 85.4%291870.6%+ 17.6%242724Scania570.5%– 1.7%261740.5%+ 15.2%283025Mahindra530.5%+ 60.6%251570.5%+ 220.4%294226Peugeot520.4%– 34.2%241800.5%– 37.1%262627BYD490.4%– 92.1%321260.4%– 87.3%321228Hino460.4%– 47.1%311310.4%– 37.6%302829LDV390.3%– 78.7%231810.5%– 56.7%252430Fiat360.3%+ 71.4%302090.6%+ 145.9%232931Volvo360.3%– 69.0%39940.3%– 53.2%373232SsangYong/KGM350.3%– 57.3%441010.3%– 35.7%333533Porsche340.3%+ 61.9%281760.5%+ 28.5%273634Iveco300.3%– 36.2%271280.4%+ 15.3%313135DAF300.3%+ 20.0%37960.3%+ 50.0%354436UD Trucks280.2%– 28.2%46730.2%+ 0.0%424037Jaguar280.2%+ 16.7%41630.2%– 6.0%434838Volvo Trucks260.2%– 10.3%351010.3%+ 13.5%344139Cupra250.2%– 21.9%36940.3%– 13.0%363740Kenworth200.2%+ 53.8%38840.2%+ 100.0%394641Ram200.2%– 39.4%40800.2%+ 0.0%404342Jeep170.1%+ 21.4%43540.2%– 11.5%443443Renault160.1%– 68.0%42730.2%– 44.3%413944Foton150.1%– 28.6%45380.1%– 7.3%464945CRRC140.1%n/a33510.2%n/a455846Chevrolet130.1%– 38.1%34920.3%+ 39.4%384547Haval120.1%– 94.6%47340.1%– 93.8%471748Ineos80.1%new49240.1%new485249Aston Martin80.1%+ 100.0%52140.0%– 6.7%525650Polestar70.1%– 95.2%48160.0%– 90.2%513351Opel70.1%– 36.4%71110.0%– 84.3%563852Citroen50.0%– 66.7%50220.1%– 56.0%494753MAN40.0%– 63.6%54160.0%– 66.0%505054Sinotruk40.0%+ 300.0%51120.0%+ 200.0%546555Alfa Romeo40.0%– 33.3%56110.0%– 26.7%555156Ferrari40.0%+ 100.0%61100.0%+ 0.0%586057Western Star40.0%+ 33.3% –40.0%– 20.0%696658Mack30.0%– 57.1%5980.0%– 33.3%625759Omoda30.0%new –30.0%new72 –60Can-Am20.0%– 50.0%57100.0%+ 0.0%575961International20.0%+ 0.0%55100.0%+ 233.3%596462Yamaha20.0%– 60.0%6550.0%– 16.7%676263Higer20.0%n/a –20.0%n/a77 –64Maserati10.0%– 87.5%53140.0%+ 7.7%535365Bentley10.0%– 50.0%5880.0%– 50.0%615566Dennis Eagle10.0%n/a6970.0%n/a63 –67Lamborghini10.0%– 66.7% –60.0%– 25.0%646368Rolls-Royce10.0%+ 0.0%6260.0%+ 20.0%656769Lotus10.0%n/a7050.0%+ 150.0%666170Liebherr10.0%+ 0.0%6040.0%+ 100.0%687171Shacman10.0%new7220.0%new75 –72Morgan10.0%n/a –10.0%n/a7974
New Zealand March 2024 – models:
PosModelMar-24%/23Pos2024%/23PosFY231Ford Ranger 1,0078.7%– 24.5%13,43410.1%+ 14.9%112Toyota RAV47916.8%+ 45.1%31,8765.5%+ 65.7%323Mitsubishi Triton6815.9%+ 124.0%41,4454.3%+ 71.0%4104Toyota Hilux6115.3%– 26.7%21,9605.8%– 21.1%235Kia Stonic3272.8%+ 55.7%n/a5911.7%– 5.3%11216Kia Seltos3252.8%+ 78.6%197592.2%n/a7227Mitsubishi Outlander3162.7%+ 89.2%89642.8%+ 46.3%548Mitsubishi ASX3082.7%n/a99212.7%n/a6n/a9Nissan Navara2922.5%+ 49.0%76892.0%+ 69.7%8n/a10Suzuki Swift1921.7%– 62.4%56832.0%– 48.4%9611MG ZS1851.6%– 60.0%144581.4%– 54.6%16912Toyota Corolla Cross1811.6%n/a175541.6%n/a121713Kia Sportage1661.4%– 27.8%114301.3%– 18.6%18n/a14Toyota Yaris Cross1471.3%– 9.8%n/an/an/an/an/a1115Mitsubishi Eclipse Cross1461.3%– 42.7%154951.5%– 44.4%14716Toyota Yaris1341.2%n/an/an/an/an/an/an/a17Ford Transit1271.1%+ 28.3%163971.2%+ 48.1%20n/a18Tesla Model 31251.1%n/an/an/an/an/an/an/a19Nissan X-Trail1221.1%– 72.9%233601.1%– 45.0%22n/a20Hyundai Kona1211.0%– 49.8%n/an’/an/an/an/a1521Mazda CX-51201.0%– 60.3%183941.2%– 29.4%2123n/aNissan Qashqai1100.9%n/an/a4041.2%n/a19n/an/aFord Everest1080.9%n/a66331.9%n/a1019n/aToyota Hiace1070.9%– 48.3%105231.5%+ 16.7%1318n/aToyota Land Cruiser Ute860.7%#DIV/0!n/an/an/an/an/an/an/aIsuzu D-Max810.7%– 43.8%204331.3%+ 21.6%17n/an/aVW Amarok750.6%n/a272860.8%n/an/an/an/aToyota Highlander330.3%n/a124811.4%n/a15n/a
Source: MIA


