
Greece March 2024: Nissan and Juke up to #2, Toyota Yaris Cross signs 2nd ever win
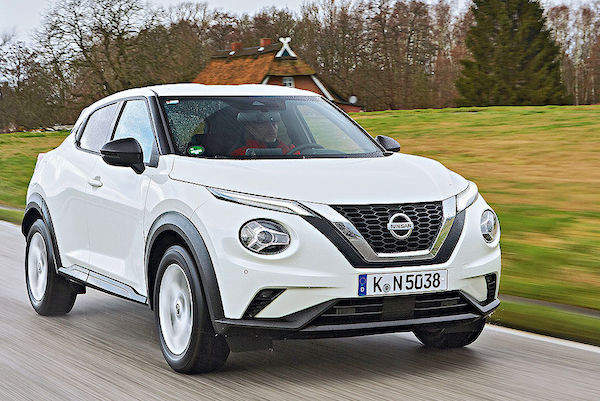
Nissan Juke sales are up 11-fold year-on-year in Greece.
After posting two double-digit gains in a row at the start of the year, the Greek new car market brakes -6.2% year-on-year in March to 12,465 units. The year-to-date tally remains in positive for now at +8.6% and 36,668 sales. Toyota (-6.7%) easily holds onto its traditional pole position with 11.9% share, albeit at a much lower level than year-to-date (14.2%). The surprise of the month comes from Nissan (+229.7%) tripling its sales year-on-year and up 12 spots on last month to #2. Peugeot (-40.1%) also manages a fantastic performance at #3. Suzuki (+54.3%) and Fiat (+53.1%) also shine in the remainder of the Top 10 but Volkswagen (-51.6%), Opel (-39.7%) and Citroen (-14%) are hit hard.
Model-wise, the Toyota Yaris Cross (-7.2%) delivers its second ever monthly win after last June at a solid 4.9% share and despite falling faster than the market. The Nissan Juke (+983.9%) posts a surreal gain to land just 10 sales off the top spot. It is followed by the Citroen C3 (-6.8%) which remains #1 year-to-date. The Fiat Panda (+361.2%) continues to evolve at markedly higher levels than a year ago at #4, ranking above the Peugeot 208 (+54%), Nissan Qashqai (+150%), Peugeot 2008 (+292.3%) and Suzuki Vitara (+92.4%) all posting sensational lifts.
Previous month: Greece February 2024: Suzuki, Fiat shine in sturdy market
One year ago: Greece March 2023: Sales up 58%, Opel Corsa most popular, Crossland up to #4
Full March 2024 Top 40 All brands and Top 220 All models below.
Greece March 2024 – brands:
PosBrandMar-24%/23Feb2024%/23PosFY231Toyota1,47811.9%– 6.7%15,21614.2%+ 30.8%112Nissan1,1219.0%+ 229.7%141,8745.1%+ 118.7%7173Peugeot1,0348.3%+ 40.1%33,3179.0%+ 10.6%234Hyundai8566.9%– 4.5%42,5216.9%– 6.7%445Citroen7876.3%– 14.0%23,0688.4%+ 7.2%356Suzuki7816.3%+ 54.3%52,4706.7%+ 84.5%577Opel7756.2%– 39.7%62,4116.6%– 31.1%628Fiat5944.8%+ 53.1%71,5204.1%+ 85.8%9109BMW5374.3%– 9.0%81,5634.3%+ 19.3%8910Volkswagen4833.9%– 51.6%101,4403.9%– 34.6%10611Skoda4543.6%+ 15.8%161,1923.3%+ 54.2%111612Dacia4173.3%+ 4.3%207071.9%– 16.1%171513Audi3783.0%– 11.1%121,1303.1%+ 15.5%121414Renault3783.0%– 17.6%216931.9%– 36.2%181115Mercedes3472.8%– 21.0%139042.5%+ 5.2%161316Kia3072.5%– 48.4%91,1153.0%– 21.0%13817Ford2962.4%– 54.7%119482.6%– 33.9%141218MG2872.3%new189292.5%new152719Tesla1841.5%– 45.2%155031.4%+ 5.5%202120Cupra1301.0%+ 25.0%252850.8%+ 80.4%252421Mini1261.0%– 36.4%223771.0%+ 3.3%231922Volvo1120.9%– 32.5%243360.9%– 31.7%241823Jeep1100.9%– 44.2%234061.1%– 32.4%222024Mazda1060.9%+ 30.9%195181.4%+ 130.2%192325Seat910.7%– 65.5%174311.2%– 26.7%212226Mitsubishi780.6%+ 7700.0%291060.3%+ 3433.3%283527Land Rover540.4%+ 17.4%261600.4%– 3.6%262628Porsche350.3%+ 59.1%33550.1%– 5.2%323129Honda320.3%+ 77.8%30770.2%+ 57.1%303030DS290.2%– 77.5%281510.4%– 50.3%272531Lexus200.2%+ 17.6%31570.2%+ 39.0%312932Alfa Romeo110.1%– 77.1%27860.2%– 47.6%292833Smart100.1%+ 25.0%34260.1%+ 73.3%333434Jaguar90.1%– 57.1%35230.1%– 46.5%343235BYD60.0%new –60.0%new383936Yudo50.0%new –50.0%new39 –37Subaru20.0%– 80.0%32160.0%– 30.4%353338Seres20.0%new3890.0%new364239Maserati20.0%– 66.7%3940.0%– 60.0%403640Bentley10.0%n/a4020.0%+ 100.0%4238
Greece March 2024 – models:
PosModelMar-24%/23Feb2024%/23PosFY231Toyota Yaris Cross6174.9%– 7.2%51,4203.9%+ 17.0%442Nissan Juke6074.9%+ 983.9%319192.5%+ 301.3%9443Citroen C35884.7%– 6.8%22,3056.3%+ 10.9%134Fiat Panda5584.5%+ 361.2%61,2723.5%+ 241.9%685Peugeot 2085024.0%+ 54.0%89672.6%– 25.4%856Nissan Qashqai4703.8%+ 150.0%228372.3%+ 137.8%10297Peugeot 20084083.3%+ 292.3%31,6394.5%+ 233.8%398Suzuki Vitara3793.0%+ 92.4%41,4103.8%+ 127.1%569Opel Corsa3763.0%– 55.1%71,2413.4%– 48.5%7110Toyota Yaris 3042.4%+ 13.0%11,9545.3%+ 57.2%2211Renault Clio3022.4%+ 88.8%265361.5%– 11.0%181012BMW X12792.2%– 4.5%236241.7%+ 12.8%151213Opel Crossland2592.1%– 33.4%176391.7%– 9.4%131814Skoda Fabia2411.9%+ 315.5%504161.1%+ 311.9%246815MG ZS2331.9%new167442.0%new117016Dacia Duster2041.6%+ 4.6%273621.0%– 13.0%312217Suzuki Ignis1991.6%+ 161.8%493941.1%+ 97.0%283418Toyota C-HR1981.6%– 45.6%117322.0%– 1.5%121619Dacia Sandero1941.6%+ 9.6%552960.8%– 19.6%402720Ford Puma1761.4%– 12.0%126271.7%+ 13.0%141321Hyundai Kona1681.3%+ 342.1%572570.7%+ 23.0%446222Hyundai i201551.2%– 38.2%254881.3%– 37.1%21723Hyundai i301541.2%+ 87.8%96131.7%+ 162.0%165624Audi A31411.1%+ 46.9%284601.3%+ 123.3%223925Mercedes GLA1401.1%– 13.6%303290.9%+ 35.4%373026Toyota Aygo X1391.1%+ 113.8%374151.1%+ 151.5%252327Hyundai Bayon1311.1%– 2.2%293531.0%+ 30.3%333728Audi Q31261.0%– 33.3%343350.9%– 13.7%353529Hyundai i101180.9%– 46.6%244031.1%– 50.4%271730Citroen C3 Aircross1160.9%– 12.8%104891.3%– 12.2%201931Hyundai Tucson1130.9%– 30.2%213761.0%– 2.8%303632Suzuki SX41100.9%+ 0.9%363210.9%+ 26.4%383333Opel Mokka1090.9%+ 147.7%184061.1%+ 49.8%262534VW T-Roc1070.9%– 65.8%383871.1%– 52.3%291135Toyota Corolla Cross1060.9%+ 15.2%412420.7%+ 4.3%466436VW Tiguan1000.8%– 20.6%532730.7%– 11.4%424137Peugeot 3008990.8%– 60.2%335711.6%– 37.0%171438BMW 1-Series970.8%– 23.0%135321.5%+ 104.6%192439Tesla Model 3960.8%– 34.7%192950.8%+ 55.3%416340VW Polo930.7%+ 17.7%512020.6%+ 122.0%514841Suzuki Swift920.7%– 25.8%463440.9%+ 30.3%343242Mazda2900.7%+ 91.5%154511.2%+ 185.4%234643Kia Sportage890.7%+ 93.5%392470.7%+ 52.5%455244Tesla Model Y870.7%– 52.7%322010.5%– 16.9%524045Kia Stonic830.7%– 65.7%203601.0%– 34.3%322046BMW X2810.6%+ 20.9%153890.2%– 57.0%776147Mini Countryman770.6%– 47.6%422080.6%– 17.5%502648Cupra Leon760.6%+ 1420.0%121950.3%+ 1257.1%7312049Kia Picanto700.6%– 59.8%602400.7%– 39.1%471550Mitsubishi Space Star700.6%+ 6900.0%133780.2%+ 2500.0%8115551Skoda Kamiq680.5%– 65.8%433060.8%– 28.3%393852VW T-Cross670.5%– 68.5%352660.7%– 45.6%432853Seat Ibiza640.5%– 52.2%143310.9%+ 9.6%365754Kia Xceed500.4%– 29.6%402230.6%+ 62.8%495455Audi Q2500.4%– 27.5%591580.4%– 17.7%565056Volvo XC40500.4%– 28.6%651160.3%– 63.6%653157Renault Captur500.4%– 64.8%691030.3%– 48.2%714758Skoda Enyaq480.4%+ 860.0%127600.2%+ 215.8%8713159Ford Kuga460.4%+ 2.2%681360.4%+ 76.6%608260Jeep Compass450.4%– 52.1%611510.4%– 49.7%584561Citroen C5 Aircross450.4%– 38.4%581230.3%+ 4.2%638062Toyota Corolla420.3%– 41.7%482010.5%– 18.0%534263Cupra Formentor420.3%– 52.8%521640.4%+ 28.1%544964Skoda Octavia370.3%– 7.5%541640.4%+ 168.9%556765Volvo XC60370.3%– 39.3%671050.3%+ 2.9%706566Toyota Proace City Verso370.3%+ 428.6%86900.2%+ 291.3%7612467MG HS360.3%new841110.3%new6712968Jeep Avenger350.3%new451420.4%new5913469Nissan X-Trail340.3%+ 41.7%76800.2%+ 77.8%799170Fiat 500330.3%– 80.0%632370.6%+ 0.9%482171Mercedes GLC330.3%– 50.7%561060.3%– 18.5%697372Mercedes A-Class320.3%– 57.9%89920.3%– 51.6%756073Toyota RAV4310.2%– 27.9%661300.4%+ 20.4%617774Jeep Renegade300.2%– 69.7%621070.3%– 63.2%685975VW Golf300.2%– 34.8%80980.3%+ 66.1%727476Mercedes GLB270.2%+ 92.9%471530.4%+ 264.3%577877Ford Fiesta270.2%– 89.5%79680.2%– 86.6%854378Mini Cabrio270.2%+ 80.0%115410.1%+ 7.9%979879VW Transporter270.2%n/a113370.1%n/a10117880Opel Grandland260.2%+ 766.7%72890.2%+ 71.2%787981Skoda Kodiaq240.2%– 27.3%70930.3%+ 52.5%748582Porsche Cayenne240.2%+ 140.0%213300.1%+ 25.0%11312883Citroen C4230.2%– 69.3%641120.3%+ 13.1%665184Audi A1230.2%– 34.3%92580.2%– 28.4%908185Audi Q4230.2%+ 27.8%85550.1%+ 34.1%9110686Mini220.2%– 37.1%441280.3%+ 77.8%627287Skoda Scala220.2%+ 0.0%951170.3%+ 207.9%649088VW Taigo220.2%– 82.7%82740.2%– 69.2%825389Renault Arkana210.2%– 82.9%112360.1%– 83.5%1055890Honda HR-V210.2%+ 2000.0%171270.1%+ 1250.0%11915491Mercedes EQA200.2%– 47.4%110390.1%– 43.5%988692MG 4180.1%new90730.2%new8314693DS 7170.1%– 37.0%96730.2%+ 25.9%849394Range Rover Sport170.1%+ 70.0%118370.1%+ 85.0%1029595Mercedes CLA170.1%+ 30.8%97350.1%+ 20.7%10610996Ford Focus160.1%– 88.7%83460.1%– 82.1%947697BMW X3150.1%– 28.6%105420.1%– 30.0%969998Range Rover Evoque150.1%+ 1400.0%117370.1%+ 640.0%10310099Dacia Jogger150.1%– 42.3%122330.1%– 42.1%10887100Seat Leon140.1%+ 366.7%78590.2%+ 321.4%88116101Mercedes EQB140.1%+ 0.0%204190.1%– 32.1%130126102Seat Arona130.1%– 89.8%91390.1%– 85.7%9955103Mercedes C-Class130.1%+ 30.0%106300.1%+ 11.1%114101104Peugeot Expert Traveller130.1%+ 550.0%134190.1%+ 280.0%131162105Cupra Born120.1%+ 20.0%102260.1%+ 13.0%124121106Hyundai Ioniq 5120.1%+ 100.0%157210.1%+ 90.9%127139107Mercedes Citan120.1%+ 1100.0% –150.0%+ 1400.0%146193108Ford Tourneo Connect120.1%n/a197140.0%n/a150198109Alfa Romeo Tonale110.1%– 75.0%71790.2%– 47.3%8083110DS 4110.1%– 80.4%108590.2%– 69.3%8975111BMW ix1110.1%+ 120.0%88470.1%+ 235.7%93105112VW ID.3110.1%– 38.9%128280.1%– 56.3%11789113VW Caddy110.1%– 21.4%144270.1%+ 58.8%120151114Mercedes Vito, Viano110.1%n/a107230.1%n/a126 –115Volvo EX30100.1%new73530.1%new92277116Skoda Karoq100.1%– 67.7%149270.1%– 54.2%121103117Smart Fortwo100.1%+ 25.0%135260.1%+ 73.3%125141118Ford Tourneo Custom90.1%n/a77370.1%n/a104 –119Range Rover90.1%+ 350.0%111320.1%+ 966.7%109148120BMW i490.1%– 60.9%104270.1%– 3.6%122107121Peugeot Boxer90.1%n/a –190.1%+ 1800.0%132191122Mercedes E-Class90.1%+ 350.0%132170.0%+ 112.5%138156123Citroen C4 X90.1%+ 800.0%170140.0%+ 600.0%15169124Kia EV690.1%+ 50.0%177110.0%+ 22.2%160157125Volvo C4080.1%– 46.7%87340.1%+ 21.4%107115126Lexus NX80.1%– 27.3%114300.1%+ 50.0%115125127BMW X580.1%+ 14.3%100290.1%+ 38.1%116132128Audi Q570.1%– 22.2%93310.1%– 20.5%110104129VW ID.470.1%– 53.3%150160.0%– 62.8%143113130BMW 2-Series60.0%– 60.0%74460.1%– 8.0%9594131Kia Niro60.0%– 14.3%81310.1%– 31.1%111117132Mazda CX-560.0%+ 500.0%131270.1%+ 800.0%123143133BMW X660.0%+ 20.0%120180.0%+ 80.0%137176134Ford Mustang Mach-E60.0%+ 0.0%124140.0%– 48.1%152119135Range Rover Velar60.0%– 25.0%216130.0%– 69.8%154142136BMW 3-Series50.0%– 64.3%75390.1%+ 11.4%100118137Opel Astra50.0%– 58.3%94310.1%– 50.0%11284138Land Rover Defender50.0%– 58.3%109280.1%– 34.9%118111139Volvo XC9050.0%– 72.2%99200.1%– 42.9%129102140Nissan Primastar50.0%– 50.0%98190.1%+ 72.7%133177141Audi Q850.0%+ 25.0%129170.0%+ 88.9%139166142BMW IX350.0%+ 400.0%146170.0%– 34.6%140145143Mercedes GLE50.0%– 73.7%140170.0%– 57.5%141140144Lexus UX50.0%+ 66.7%139160.0%+ 23.1%144108145Mitsubishi Colt50.0%new116160.0%new145 –146Jaguar F-Pace50.0%+ 66.7%174120.0%+ 300.0%155149147Skoda Superb50.0%+ 25.0%186100.0%+ 42.9%162185148Mercedes V-Class50.0%– 28.6%16390.0%– 62.5%164112149Nissan Ariya50.0%+ 400.0% –70.0%+ 133.3%176240150Yudo 350.0%new –50.0%new186 –151Mazda CX-3040.0%– 71.4%125190.1%– 26.9%134122152Dacia Spring40.0%+ 100.0%123150.0%+ 650.0%147195153Honda Jazz40.0%– 69.2%130150.0%– 25.0%148127154Honda CR-V40.0%+ 300.0%148140.0%+ 55.6%153190155Lexus RX40.0%+ 33.3%15980.0%+ 14.3%170186156Hyundai Ioniq 640.0%new17370.0%new177253157Citroen Jumpy Spacetourer30.0%+ 200.0%101170.0%+ 325.0%142161158Audi A430.0%+ 0.0%151120.0%+ 20.0%156181159BMW 4-Series30.0%– 62.5%119120.0%– 50.0%157135160Mitsubishi ASX30.0%new141120.0%new158263161BMW X430.0%+ 50.0%154110.0%+ 57.1%161138162Jaguar E-Pace30.0%– 82.4%15880.0%– 76.5%171137163Porsche 91130.0%+ 0.0%21280.0%+ 14.3%172171164Renault Austral30.0%– 50.0%18380.0%– 33.3%173152165Mazda CX-6030.0%– 50.0%20260.0%– 33.3%181158166Porsche Macan30.0%+ 50.0%21440.0%– 42.9%188175167Porsche Taycan30.0%– 57.1% –40.0%– 78.9%189159168BYD Atto 330.0%new –30.0%new200254169BYD Seal30.0%new –30.0%new201 –170Peugeot 40820.0%– 33.3%126210.1%– 51.2%128123171Toyota Proace20.0%– 50.0%103190.1%+ 111.1%135133172VW Up!20.0%– 93.8%165150.0%– 63.4%14992173Land Rover Discovery Sport20.0%– 81.8%138120.0%– 76.0%159130174Subaru Forester20.0%+ 0.0%136100.0%+ 100.0%163165175Fiat 500X20.0%– 60.0%15690.0%– 87.0%16588176Seres 520.0%new18590.0%new166278177Volvo V6020.0%+ 0.0%14380.0%+ 0.0%174184178BMW XM20.0%new16970.0%new178199179BMW 5-Series20.0%+ 100.0%15260.0%+ 100.0%182196180Mazda320.0%– 33.3%16260.0%– 53.8%183169181Mercedes EQE20.0%+ 0.0%20560.0%+ 200.0%184200182VW ID.720.0%new22560.0%new185 –183Citroen C5 X20.0%+ 100.0%19340.0%+ 100.0%190213184Maserati Grecale20.0%+ 0.0%20140.0%– 20.0%191172185Mercedes Sprinter20.0%n/a20740.0%+ 300.0%192197186Porsche Panamera20.0%n/a21530.0%n/a202225187VW Multivan20.0%n/a22730.0%n/a203276188BMW Z420.0%+ 100.0% –20.0%+ 0.0%220219189Lexus RZ20.0%new –20.0%new221234190Mercedes EQC20.0%+ 0.0% –20.0%– 33.3%222205191Ford Tourneo Courier20.0%n/a –20.0%n/a223 –192Peugeot 30810.0%– 97.1%142660.2%– 67.3%8666193DS 310.0%– 97.8%155190.1%– 64.8%13697194Honda Civic10.0%– 66.7%14790.0%– 30.8%167163195Honda ZR-V10.0%new17290.0%new168241196Mazda MX-510.0%– 90.0%16170.0%– 56.3%179136197BMW i510.0%new –40.0%new193242198Tesla Model S10.0%– 66.7%18740.0%– 84.6%194167199BMW 7-Series10.0%n/a16730.0%n/a204232200Honda e:Ny110.0%new –30.0% new205279201Hyundai Santa Fe10.0%– 50.0%19830.0%+ 50.0%206194202Mercedes CLE10.0%new17830.0%new207 –203VW ID.Buzz10.0%– 83.3%22630.0%– 75.0%208173204VW Touareg10.0%– 66.7% –30.0%+ 0.0%209231205Bentley Bentayga10.0%n/a19020.0%n/a224289206Citroen C110.0%n/a19220.0%n/a225236207Ford Explorer10.0%– 50.0%19620.0%– 50.0%226206208Mercedes B-Class10.0%– 83.3% –20.0%– 71.4%227182209Mercedes EQS10.0%+ 0.0%20620.0%+ 0.0%228207210Lexus LBX10.0%new –10.0%new239 –211BMW i710.0%+ 0.0% –10.0%+ 0.0%240259212Fiat Ulysse10.0%n/a –10.0%+ 0.0%241284213Ford Ecosport10.0%n/a –10.0%n/a242267214Jaguar XE10.0%n/a –10.0%+ 0.0%244292215Renault Megane E-Tech10.0%new –10.0%new245223216Renault Trafic10.0%n/a –10.0%– 85.7%246215217Suzuki Across10.0%n/a –10.0%n/a247287218Toyota Verso-S10.0%n/a –10.0%n/a248310219Toyota Supra10.0%n/a –10.0%n/a249 –
Source: SEAA

More Stories
Suzuki earns second Platinum accolade in 2026 NADA DSI Awards
Suzuki Auto South Africa has once again earned Platinum status in the 2026 NADA Dealer Satisfaction Index (DSI) Awards, recognising...
Stellantis Names New Jeep and Ram CEOs as North America Turnaround Push Continues
Stellantis is making another major leadership move in North America, naming new CEOs for two of its most important brands....
2026 Mercedes-Benz E-Class Pricing: What Real Buyers Are Paying on the Luxury Sedan KBB Calls a Favorite
Kelley Blue Book said it plainly in their 2026 E-Class review: if they had the budget, they would probably head...
2026 Hyundai Ioniq 5 Pricing: The EV That Just Got $9,155 Cheaper and Is Still Selling Above Sticker
If you are shopping for a 2026 Hyundai Ioniq 5 and want to know what dealers are actually charging, what...
McLaren P50 Manual Gearbox Rumor Could Signal a Wild Return to Three-Pedal Supercars
McLaren may be preparing one of its most enthusiast-focused surprises in decades, if the latest rumor out of the supercar...
Explore: The cars of Doha, Qatar
Exeed LX in Doha A few months ago I was able to visit Doha in Qatar, and this was a...