
Germany March 2024: Mitsubishi (+225.4%), Citroen (+91.8%) shoot up, VW Golf distant leader
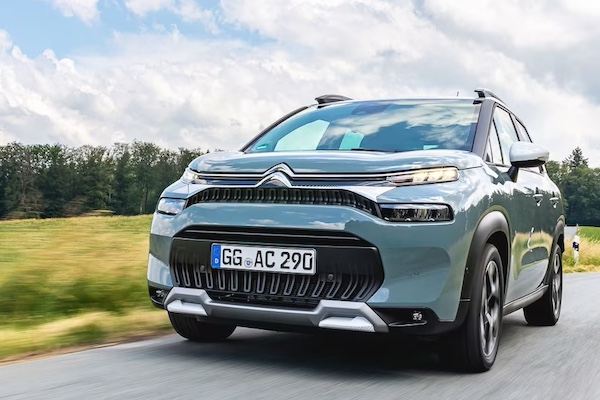
The Citroen C3/Aircross breaks into the German Top 10 in March.
263,368 new cars joined German roads in March, a disappointing -6.4% year-on-year drop. However the Q1 volume manages to stay in positive at +4.1% to 694,309 units. Volkswagen (-3.4%) fares better than the market albeit in negative to 18.3% share. Mercedes (-22.8%) follows in great difficulty ahead of a stable BMW (+0.6%). Audi (-37.9%) freefalls but climbs back up to #4 above Skoda (+1.8%). Seat (+32.4%) and Toyota (+30%) are the only additional gainers in the Top 10 and manage the largest upticks. Indeed Ford (-7.8%), Hyundai (-3.2%) and Opel (-2.7%) all recede. Further down, Citroen (+91.8%) lodges a stellar performance and is up to #11 vs. #21 over the Full Year 2023, with Mitsubishi (+225.4%), Honda (+72.5%), Volvo (+36.9%) and Porsche (+14.8%) also making themselves noticed. Tesla implodes -55.4% to #23.
In the models ranking, Volkswagen spectacularly monopolises the Top 4 with a resurgent Golf (+60.2%) the faraway leader, distancing the T-Roc (-12.2%), Tiguan (-15.4%) and Passat (+15.7%). The Skoda Octavia (-9.1%) is the best of the rest at #5. Another outstanding month for the Opel Astra (+117.7%) at #6, a ranking it also holds year-to-date. The Citroen C3/C3 Aircross (+655.7%) breaks into the Top 10 for the first time at #8, with the Seat Leon (+72.5%) also in great shape at #10. Notice also the Mitsubishi Space Star up 119.6% to #26 and the Mitsubishi ASX up 581.5% to #39.
Previous month: Germany February 2024: VW Golf, Passat, Opel Astra shine in soft market
One year ago: Germany March 2023: VW T-Roc signs third ever win, market up 16.6%
Full March 2024 Top 62 All brands and Top 333 models below.
Germany March 2024 – brands:
PosBrandMar-24%/23Feb2024%/23PosFY231Volkswagen48,18018.3%– 3.4%1130,08918.7%+ 2.8%112Mercedes21,7068.2%– 22.8%263,0999.1%– 11.4%223BMW21,3668.1%+ 0.6%353,5497.7%+ 13.2%344Audi17,2006.5%– 37.9%546,9136.8%– 22.8%535Skoda16,3226.2%+ 1.8%448,8567.0%+ 12.2%456Opel12,9584.9%– 2.7%637,1605.4%+ 22.7%667Ford10,6034.0%– 7.8%825,6803.7%– 10.2%878Seat10,0443.8%+ 32.4%726,0363.7%+ 54.9%799Hyundai9,2923.5%– 3.2%922,6903.3%+ 1.1%9810Toyota8,6493.3%+ 30.0%1021,9683.2%+ 15.6%101111Citroen7,7252.9%+ 91.8%1815,8052.3%+ 65.3%142112Kia6,6912.5%+ 5.0%1317,1962.5%+ 22.3%121213Fiat6,4752.5%– 20.9%1516,1252.3%– 9.7%131014Dacia6,0812.3%+ 2.5%1218,5632.7%+ 13.2%111315Volvo5,8612.2%+ 36.9%1415,3792.2%+ 62.0%152016Mazda5,5982.1%– 3.3%2011,7901.7%– 3.0%191817Mitsubishi5,3952.0%+ 225.4%2310,2981.5%+ 240.0%202618Peugeot5,3382.0%+ 9.4%1614,9282.2%+ 26.7%161719Nissan4,3261.6%– 5.8%259,2101.3%+ 1.8%232320Cupra4,2091.6%+ 2.0%1910,0481.4%+ 16.7%211621Renault4,0911.6%– 32.9%229,6111.4%– 27.6%221422Porsche4,0721.5%+ 14.8%1712,1661.8%+ 32.5%182223Tesla3,8781.5%– 55.4%1113,0681.9%– 36.7%171524Mini3,3601.3%– 34.3%218,1731.2%– 15.6%241925Suzuki3,2141.2%– 2.1%246,8101.0%– 5.6%252426MG Roewe1,5590.6%– 22.4%264,4410.6%+ 16.2%262527Smart1,4970.6%– 17.2%273,8820.6%+ 14.8%272728Land Rover1,2310.5%– 22.8%283,2790.5%– 9.9%282929Jeep1,0660.4%+ 3.3%293,1490.5%+ 28.4%292830Honda8020.3%+ 72.5%301,7890.3%+ 21.1%303031Alfa Romeo5480.2%+ 2.6%311,6150.2%+ 20.8%313232Subaru4360.2%– 9.0%321,1810.2%+ 18.5%323433Polestar3570.1%– 52.8%376310.1%– 39.0%363134Lexus3410.1%+ 32.7%339560.1%+ 78.4%333635Jaguar3170.1%– 26.6%397630.1%– 18.0%343736GWM3070.1%+ 87.2%365630.1%+ 219.9%373337DS2590.1%+ 15.6%346780.1%+ 62.6%353838SsangYong2390.1%+ 62.6%385290.1%– 1.1%394039Ferrari2160.1%+ 2.4%355560.1%+ 21.4%384240BYD1600.1%+ 2185.7%423930.1%+ 514.1%403541Man1370.1%– 59.7%413250.0%– 48.4%424142Lamborghini1210.0%+ 6.1%403460.0%+ 29.1%414743Iveco1140.0%+ 31.0%432600.0%+ 23.8%434844Genesis 890.0%+ 3.5%451900.0%– 36.0%444345Bentley750.0%– 22.7%471840.0%– 21.7%454946Alpine540.0%+ 217.6%461490.0%+ 129.2%475147Maserati480.0%– 64.4%481210.0%– 71.9%484548NIO480.0%– 60.7%511020.0%– 25.0%494449Ineos420.0%n/a441830.0%+ 1730.0%464650Rolls-Royce340.0%– 10.5%50890.0%+ 8.5%505251Aston Martin250.0%– 51.0%52760.0%– 33.3%525052Fisker240.0%new49800.0%new515553Lotus190.0%– 26.9%53630.0%+ 28.6%535354Cadillac110.0%– 45.0%54430.0%– 47.6%545455Vinfast60.0%new55200.0%new55 –56Morgan50.0%– 37.5%58140.0%+ 16.7%565957Lucid 50.0%+ 400.0%59110.0%+ 83.3%585758Maxus30.0%new56140.0%new575859Chevrolet30.0%n/a –30.0%n/a61 –60Lada10.0%– 92.9%5780.0%– 89.2%595661Aiways10.0%– 94.4% –10.0%– 95.7%626062Lynk & Co00.0%– 100.0%6070.0%– 99.4%6039 –Others5340.2%– 61.8% –2,4080.3%– 27.1% – –
Germany March 2024 – models:
PosModelMar-24%/23Feb2024%/23PosFY231VW Golf11,6214.4%+ 60.2%131,7034.6%+ 51.3%112VW T-Roc6,6062.5%– 12.2%415,8232.3%– 11.1%323VW Tiguan5,0831.9%– 15.4%316,6192.4%+ 0.1%234VW Passat4,6771.8%+ 15.7%512,3851.8%+ 23.4%555Skoda Octavia4,5171.7%– 9.1%613,1171.9%+ 2.4%4106Opel Astra3,9391.5%+ 117.7%711,5731.7%+ 182.8%6297Opel Corsa3,8821.5%– 24.2%810,0261.4%– 9.5%948Citroen C3/C3 Aircross3,7561.4%+ 655.7%526,3240.9%+ 284.4%27979BMW 3er3,6641.4%+ 13.5%178,9981.3%+ 26.1%121510Seat Leon3,6251.4%+ 72.5%910,1211.5%+ 127.7%82511Audi A43,4631.3%– 20.0%109,1051.3%– 11.3%111312Mini All3,3601.3%– 34.3%148,1731.2%– 15.6%16713VW Transporter3,2991.3%– 4.2%119,4411.4%+ 10.3%102014Fiat Ducato3,2721.2%+ 17.2%276,2560.9%+ 11.1%284515Tesla Model Y3,2441.2%– 43.1%211,0451.6%– 30.3%7816Cupra Formentor2,9671.1%+ 3.4%187,6361.1%+ 23.7%191917Audi A32,9571.1%– 7.8%217,8661.1%+ 17.2%181418VW Taigo2,8681.1%+ 24.6%456,5010.9%– 0.3%253919Mercedes E-Klasse 2,8631.1%+ 22.8%257,3411.1%+ 27.0%234120BMW X12,7561.0%– 17.4%196,9241.0%+ 2.9%241121Fiat 500 lineup2,7161.0%– 38.0%138,4011.2%– 5.2%14622Skoda Fabia2,6211.0%+ 46.0%167,4391.1%+ 25.0%204923Dacia Sandero2,5941.0%+ 25.7%228,2431.2%+ 35.0%153224Hyundai Tucson2,5891.0%+ 45.7%545,3160.8%+ 62.4%445025Mercedes GLC2,5711.0%– 26.6%207,3731.1%– 13.2%211726Mitsubishi Space Star2,5691.0%+ 119.6%745,1080.7%+ 111.4%457927BMW 4er2,4630.9%+ 9.1%325,8650.8%+ 32.0%342428BMW X32,4400.9%+ 39.0%286,4080.9%+ 32.6%262629VW Polo2,4240.9%– 22.0%238,4851.2%+ 24.8%131630Mercedes GLA2,4220.9%+ 4.1%346,0740.9%+ 7.5%298031VW T-Cross2,3450.9%– 21.5%445,9800.9%– 23.1%322232Seat Ateca2,3420.9%+ 17.9%375,6440.8%+ 29.9%403833Volvo XC602,3270.9%+ 73.7%246,0120.9%+ 75.6%316034Toyota Yaris/Yaris Cross2,2920.9%– 2.8%465,7140.8%– 25.4%382335Kia Ceed/Xceed2,2560.9%+ 6.0%265,8060.8%+ 16.3%364336Opel Grandland X2,2520.9%+ 74.7%596,0310.9%+ 156.6%306537VW ID.4, ID.52,2480.9%– 30.0%674,2260.6%– 37.7%571238Ford Puma2,2470.9%+ 42.8%385,8850.8%+ 17.0%334039Mitsubishi ASX2,2080.8%+ 581.5%1202,8890.4%+ 739.8%8417340Skoda Karoq2,1980.8%+ 8.8%127,9971.2%+ 35.6%174441BMW 2er2,1490.8%– 0.3%435,6500.8%+ 23.1%394742Mercedes C-Klasse 2,1340.8%– 53.4%157,3531.1%– 34.6%22943BMW 5er2,0860.8%– 17.9%425,0200.7%– 18.1%473544Nissan Qashqai1,9800.8%– 33.7%724,1660.6%– 20.3%586345Ford Kuga1,9780.8%+ 20.0%295,8340.8%+ 75.5%353746Skoda Kamiq1,9430.7%+ 17.2%315,7280.8%+ 24.7%375847Skoda Kodiaq1,9040.7%– 15.7%515,0660.7%– 7.9%463448Ford Focus1,8920.7%– 32.1%335,4530.8%– 24.1%412849Toyota Aygo X1,8410.7%+ 132.4%304,9180.7%+ 98.9%498650Seat Ibiza1,8270.7%+ 23.1%574,5520.7%+ 38.1%527351Ford Transit, Tourneo1,7930.7%– 15.5%973,0390.4%– 38.3%825252Audi Q31,7600.7%– 45.6%415,3570.8%– 28.9%422753Toyota Corolla/Cross1,7580.7%+ 44.0%664,0770.6%+ 22.4%607554Audi A61,7490.7%– 47.2%753,8720.6%– 47.7%631855Dacia Duster1,6950.6%– 20.9%504,6740.7%– 19.7%515456Mercedes CLA-Klasse1,6290.6%+ 4.1%633,9620.6%– 11.3%615357Opel Mokka1,6080.6%– 36.1%365,3170.8%– 10.5%432158Seat Arona1,5880.6%+ 17.2%653,7820.5%+ 10.0%647059VW Touran1,5590.6%+ 17.6%354,8070.7%+ 8.2%505960Mercedes A-Klasse 1,5570.6%– 40.9%564,2770.6%– 30.9%544261VW Caddy1,5300.6%– 10.1%534,2490.6%– 8.8%566162Kia Sportage1,4780.6%– 2.8%474,1630.6%+ 47.3%596763BMW 1er1,4760.6%– 21.7%614,2580.6%+ 0.4%554664Hyundai Kona1,4690.6%– 39.6%693,5490.5%– 30.0%693365Mercedes GLE1,3900.5%+ 68.1%404,9290.7%+ 77.9%489166Porsche 9111,3730.5%+ 15.4%683,6420.5%+ 32.5%669867Citroen C4/C4 X/Spacetourer1,3680.5%+ 260.0%1103,6070.5%+ 332.5%6811168Hyundai i201,3400.5%+ 82.8%733,5330.5%+ 100.1%709069Mazda21,3060.5%+ 7.5%1152,4040.3%+ 4.7%9410670Citroen Jumper1,2830.5%– 5.0%1022,3700.3%– 11.4%969971Volvo XC401,2800.5%– 3.3%802,7840.4%+ 1.4%868272Mazda CX-51,2740.5%– 13.9%892,8880.4%– 22.7%858473Cupra Born1,2420.5%– 1.3%792,4120.3%– 1.0%935674BMW X51,2240.5%– 2.9%913,1150.4%+ 15.5%807675Hyundai i301,2230.5%– 9.6%773,0720.4%+ 0.9%818376Citroen C5 X/Aircross1,2080.5%+ 145.5%903,1700.5%+ 114.8%7513277Skoda Enyaq1,2050.5%– 0.2%623,9230.6%+ 43.4%623178Mercedes V-Klasse/EQV1,2020.5%– 27.5%394,3030.6%– 17.6%534879VW ID.31,1860.5%– 54.1%872,5650.4%– 51.5%883680Ford Transit Custom1,1540.4%n/a1092,1910.3%n/a10426281Dacia Jogger1,1230.4%– 6.8%603,7330.5%+ 20.4%656882Audi Q41,1150.4%– 32.4%853,4280.5%– 4.8%725583Audi Q51,0810.4%– 62.9%713,4850.5%– 46.2%713084Mercedes GLB1,0590.4%– 44.5%783,1270.5%– 32.0%7910385Peugeot 30081,0550.4%+ 48.6%763,1290.5%+ 111.3%7710986Hyundai i101,0550.4%– 28.5%812,9720.4%– 32.3%836987Mazda CX-301,0530.4%+ 39.1%1132,1420.3%+ 45.8%10612088Porsche Cayenne1,0480.4%+ 20.5%493,3760.5%+ 67.0%7313589Opel Crossland1,0240.4%– 23.5%583,6230.5%+ 20.8%677790Audi A11,0150.4%– 61.8%1002,2980.3%– 51.1%996491Suzuki Ignis1,0020.4%+ 304.0%1032,0540.3%+ 108.5%10713192Skoda Superb1,0000.4%– 33.8%703,1660.5%– 21.3%766693Peugeot 2089970.4%– 9.4%1222,2230.3%– 18.9%1019294Peugeot 20089890.4%+ 33.8%553,3040.5%+ 55.2%749695Audi Q29810.4%– 50.4%953,1280.5%– 11.3%785796Toyota C-HR9690.4%– 10.3%962,5900.4%+ 23.1%8711297Audi A59670.4%– 18.3%862,3570.3%+ 7.6%978898Porsche Macan9460.4%+ 41.6%882,5640.4%+ 30.2%8911799Skoda Scala9310.4%+ 50.9%1052,3920.3%+ 18.4%95116100Mercedes Sprinter9230.4%– 3.0%992,2000.3%– 1.6%102104101Nissan Juke9080.3%+ 86.1%1241,8490.3%+ 65.7%116141102MG ZS8950.3%+ 255.2%1651,2850.2%+ 121.2%135163103Audi Q88920.3%+ 22.2%842,2400.3%+ 37.6%100122104Mercedes Vito8810.3%+ 21.5%932,5060.4%+ 20.1%9195105Suzuki Vitara8740.3%– 41.3%1361,4070.2%– 52.2%129114106Peugeot 3088730.3%+ 44.5%922,4790.4%+ 73.5%92136107Mazda CX-608720.3%+ 23.0%1121,9160.3%+ 44.6%112125108Kia Picanto8650.3%+ 26.3%1291,7110.2%– 0.5%118101109Suzuki Swift8410.3%+ 68.9%642,5230.4%+ 100.6%90130110Nissan X-Trail7640.3%+ 116.4%1261,7040.2%+ 113.5%119165111Renault Clio7630.3%– 24.2%1061,9220.3%– 29.6%11185112Smart Fortwo7460.3%– 50.1%942,1980.3%– 28.1%10389113Mercedes B-Klasse7260.3%– 44.4%1071,9540.3%– 22.8%109100114Peugeot 50086990.3%+ 48.4%1042,1610.3%+ 112.5%105150115Toyota Proace6830.3%+ 28.1%1251,4860.2%+ 13.0%123145116Volvo XC906710.3%– 18.3%832,3480.3%+ 53.5%98129117Dacia Spring6630.3%+ 29.0%821,9060.3%+ 41.5%11381118Seat Tarraco6580.2%+ 8.2%981,9310.3%+ 97.4%110113119Renault Arkana6420.2%+ 1.9%1939560.1%– 29.9%147123120Smart #16270.2%+ 100.3%1351,3110.2%+ 305.9%134124121Volvo EX306260.2%new1141,6860.2%new120316122Kia Stonic5930.2%+ 51.3%1471,3760.2%+ 15.5%131144123Kia Niro5680.2%+ 93.2%1301,3840.2%+ 165.1%130118124BMW X25630.2%+ 47.0%1817980.1%– 21.5%160153125Volvo S/V605570.2%+ 38.2%1081,6380.2%+ 96.9%121138126VW Arteon5510.2%– 55.2%1171,8990.3%– 39.4%11478127Ford Transit Connect5490.2%+ 135.6%1231,4310.2%+ 172.1%127182128Tesla Model 35450.2%– 78.7%1161,7900.3%– 57.3%11762129VW Crafter5400.2%– 17.8%1371,0790.2%– 18.7%140148130Hyundai Ioniq55210.2%– 25.3%1111,4740.2%– 24.4%12487131Mazda64950.2%– 3.3%1499300.1%+ 16.7%150166132VW ID.Buzz4940.2%+ 41.1%1481,0010.1%+ 44.9%145142133BMW Z44760.2%– 11.2%1568100.1%– 16.2%159168134Toyota RAV44720.2%+ 107.9%1311,6360.2%+ 209.3%122159135Mercedes S-Klasse4720.2%– 50.0%1211,4700.2%– 36.6%125146136Mercedes G-Klasse4710.2%– 28.4%1181,8950.3%– 5.5%115133137VW Touareg4540.2%– 31.1%1321,4230.2%– 38.5%128121138Kia EV64450.2%– 28.9%1191,3190.2%+ 63.4%133110139Suzuki SX44360.2%– 50.8%1726880.1%– 60.6%167155140Peugeot Boxer4300.2%+ 12.9%1677280.1%– 13.2%166179141BMW X44190.2%+ 13.2%1501,0280.1%+ 8.2%144149142Jeep Avenger4130.2%new1581,0720.2%new141127143Hyundai Staria4090.2%+ 59.1%1548980.1%+ 44.6%154178144Toyota bZ4X3840.1%+ 79.4%1806820.1%– 14.1%168170145Fiat Panda3820.1%– 59.4%1341,0800.2%– 60.8%139119146Mercedes Citan3790.1%– 42.6%1401,3360.2%– 24.7%132126147VW Up!3750.1%– 72.5%1381,2310.2%– 43.2%13751148Renault Captur3720.1%– 62.5%1579090.1%– 62.2%15393149Mercedes GLS3630.1%+ 62.8%1281,2380.2%+ 89.0%136201150Renault Kangoo3610.1%– 28.4%1439490.1%+ 21.2%149143151Polestar 23570.1%– 52.8%1746310.1%– 39.0%172128152Renault Twingo3480.1%– 55.2%1597730.1%– 40.6%162107153Mitsubishi Colt3430.1%new1011,4680.2%new126246154Mazda33400.1%– 33.7%1538790.1%– 21.2%155162155BMW iX3350.1%– 18.1%1331,0570.2%+ 49.5%142140156Hyundai Bayon3330.1%+ 166.4%1419930.1%+ 101.4%146176157Renault Trafic3290.1%+ 57.4%1558670.1%+ 71.7%156180158Renault Espace3230.1%+ 976.7%2035320.1%+ 923.1%178251159Land Rover Defender3190.1%– 35.7%1451,0300.1%– 9.0%143151160Nissan Townstar3060.1%+ 19.1%1896640.1%+ 45.3%170185161Jeep Renegade3050.1%– 16.9%1826270.1%– 45.1%173156162Hyundai Ioniq63020.1%– 36.8%1696680.1%– 37.4%169137163BMW X62930.1%+ 25.8%1607500.1%+ 41.2%164181164Porsche Boxster2920.1%+ 46.7%1666550.1%+ 65.8%171224165BMW X72810.1%+ 50.3%1469550.1%+ 74.9%148175166Audi TT2750.1%+ 4.6%1885260.1%– 0.6%179177167Mitsubishi Eclipse Cross2740.1%+ 67.1%1428270.1%+ 210.9%158189168BMW 7er2710.1%– 3.6%1527510.1%– 1.8%163172169Mercedes CLE2680.1%new1448280.1%new157235170Ford Mustang Mach-E2640.1%– 38.2%1994630.1%– 27.8%188164171Ford Transit Courier2620.1%+ 13000.0%1834200.1%+ 4100.0%192356172VW ID.72580.1%new2054950.1%new183234173Honda E:NY12570.1%new2842770.0%new216295174MG 42560.1%– 81.6%482,0090.3%– 16.0%10874175Jeep Compass2510.1%– 55.5%1271,1410.2%+ 11.6%138161176Volvo S/V902450.1%+ 32.4%1755000.1%+ 44.1%182205177Renault Zoe2410.1%– 44.2%1864060.1%– 47.2%196167178Kia Sorento2290.1%+ 16.8%1517840.1%+ 42.8%161154179Alfa Romeo Tonale2280.1%– 12.6%1617300.1%+ 24.4%165195180BMW 8er2220.1%– 2.2%1844670.1%– 0.6%187209181Nissan Primastar2210.1%+ 333.3%2104140.1%+ 167.1%194256182Range Rover Evoque2130.1%– 39.3%2164040.1%– 52.2%197184183MG RX62120.1%+ 133.0%2085260.1%+ 63.4%180214184Renault Megane2070.1%– 71.0%1689190.1%– 35.3%152102185Range Rover Velar2020.1%– 24.1%1625650.1%+ 10.1%174204186Mercedes SL2010.1%– 46.1%1854030.1%– 48.7%198183187Audi A81920.1%+ 8.5%1704940.1%+ 25.7%184187188Range Rover Sport1890.1%+ 45.4%1635240.1%+ 54.1%181213189Renault Master1850.1%+ 3600.0%2512650.0%+ 1666.7%218315190MG 51820.1%– 19.8%1715600.1%+ 58.6%175200191Peugeot 5081740.1%– 22.7%2024290.1%+ 18.5%191212192Porsche Cayman1680.1%+ 24.4%1774540.1%+ 46.0%189229193Mercedes AMG GT1680.1%– 4.0%1873730.1%– 2.6%201226194Renault Austral1640.1%– 62.5%1399240.1%+ 1.5%151105195Honda HR-V1640.1%+ 368.6%1784430.1%+ 48.2%190208196Alfa Romeo Stelvio1620.1%+ 14.1%1904170.1%+ 8.0%193206197Subaru Outback1610.1%+ 62.6%1953590.1%+ 58.8%205225198Alfa Romeo Giulia1580.1%+ 20.6%1964680.1%+ 28.6%186194199Audi e-Tron GT1560.1%– 13.3%1923520.1%– 22.1%207199200Volvo C401550.1%– 24.0%1764110.1%– 32.5%195190201DS 71420.1%+ 49.5%1794020.1%+ 166.2%199231202Audi R81420.1%+ 610.0%2092670.0%+ 352.5%217290203Land Rover Discovery Sport1410.1%– 22.1%2113030.0%– 27.9%213219204Mazda MX-51400.1%– 63.5%2202620.0%– 49.7%221202205Man TGE1330.1%– 60.1%2013100.0%– 49.6%212207206Kia Soul1290.0%+ 193.2%2591910.0%+ 189.4%237266207Lexus NX1270.0%+ 42.7%2133540.1%+ 68.6%206238208Smart #31240.0%new2043730.1%new202333209Audi Q61200.0%new2401920.0%new236 –210Mazda MX-301160.0%– 47.5%1913660.1%– 58.9%203158211Renault Koleos1140.0%– 38.0%2791420.0%– 79.9%251211212Honda Civic1110.0%+ 8.8%2152470.0%– 36.0%225228213Toyota Land Cruiser1100.0%– 16.7%2212320.0%– 55.7%227230214Iveco Daily1080.0%+ 31.7%2262480.0%+ 24.6%224248215Jaguar F-Pace1070.0%+ 16.3%2393510.1%+ 81.9%208227216Honda CR-V1020.0%+ 1.0%1983840.1%+ 18.5%200232217BMW XM1020.0%+ 628.6%2073220.0%+ 238.9%211243218SsangYong Tivoli1020.0%+ 64.5%2381950.0%+ 7.7%235249219Range Rover 1000.0%+ 2.0%1943280.0%+ 18.4%210218220DS 41000.0%+ 42.9%2352460.0%+ 53.8%226241221Audi A7960.0%– 59.3%2232850.0%– 38.3%214193222Honda Jazz960.0%– 52.7%1972630.0%– 37.8%220210223Ford Fiesta960.0%– 94.0%2342500.0%– 93.8%22272224Audi Q7950.0%– 81.3%1735500.1%– 44.3%176152225Kia EV9940.0%new2003400.0%new209272226Subaru Forester900.0%– 51.1%2122490.0%– 40.4%223220227Jaguar F-Type890.0%– 11.9%2761260.0%– 35.1%255270228Jeep Wrangler880.0%– 12.9%2182650.0%– 8.0%219247229Opel Zafira Life870.0%– 64.8%2312000.0%– 78.7%232171230Opel Movano870.0%n/a2411550.0%n/a243320231Ford Mustang850.0%– 22.7%2301990.0%– 18.1%233216232Peugeot 408780.0%– 30.4%2142820.0%– 28.4%215233233Citroen Jumpy770.0%– 34.7%2321870.0%– 24.0%239221234Honda ZR-V720.0%new2361720.0%new241267235Porsche Taycan710.0%– 75.3%1645360.1%– 53.3%177139236Lamborghini Urus700.0%+ 9.4%2192290.0%+ 43.1%228263237Toyota GR86690.0%+ 200.0%2173610.1%+ 211.2%204252238Lexus RX690.0%– 18.8%2292130.0%+ 61.4%230236239Land Rover Discovery660.0%+ 0.0%2641230.0%+ 17.1%257264240Nissan Leaf650.0%– 71.4%2331900.0%– 42.6%238203241Ferrari 296 GTB650.0%+ 54.8%2461520.0%+ 72.7%244279242Fiat Tipo630.0%+ 14.5%2282100.0%– 62.6%231237243Suzuki Swace620.0%– 60.0%2501320.0%– 47.8%253259244Jaguar E-Pace600.0%– 29.4%2571490.0%– 10.2%246261245Porsche Panamera590.0%– 48.7%2064770.1%+ 38.7%185217246Opel Combo590.0%– 88.9%2421720.0%– 88.0%242169247Alpine A110540.0%+ 217.6%2371490.0%+ 129.2%247274248Bentley Continental530.0%– 19.7%2561270.0%– 15.3%254271249SsangYong Korando530.0%+ 60.6%273950.0%– 52.5%266253250Lexus LBX530.0%new333540.0%new280 –251Lamborghini Huracan510.0%+ 2.0%2581170.0%+ 8.3%258278252Hyundai Santa Fe500.0%– 79.3%2271990.0%– 71.2%234188253Ferrari Roma500.0%+ 78.6%2481250.0%+ 119.3%256305254Tesla Model S480.0%– 84.7%2521160.0%– 73.0%260223255Genesis GV70470.0%+ 20.5%2531130.0%+ 1.8%262260256SsangYong Rexton430.0%– 17.3%2541450.0%– 5.8%249268257Ineos Grenadier420.0%n/a2251830.0%+ 1730.0%240239258Tesla Model X410.0%– 68.2%2471170.0%– 37.1%259250259Subaru XV410.0%– 76.0%2551150.0%– 61.5%261215260Ssangyong Torres410.0%new266940.0%new267302261Nissan Ariya380.0%– 28.3%2451500.0%+ 53.1%245240262Ferrari Purosangue350.0%new260960.0%new265337263Subaru BRZ340.0%n/a272900.0%+ 1700.0%268293264Lexus UX330.0%– 15.4%2242180.0%+ 165.9%229254265Citroen Berlingo330.0%– 97.2%2441470.0%– 94.5%248134266Ford Explorer330.0%– 26.7%2491120.0%– 6.7%263281267Ferrari SF90/Stradale330.0%– 5.7%265880.0%+ 22.2%269286268Fiat 600320.0%new2221450.0%new250283269Maserati Grecale290.0%– 62.8%275720.0%– 76.0%271255270Jaguar XF280.0%+ 7.7%283570.0%– 62.3%276289271Toyota Supra260.0%– 52.7%270700.0%– 22.2%272291272Peugeot Rifter250.0%– 94.7%2431420.0%– 88.3%252186273Renault Scenic250.0%– 85.6%324300.0%– 90.0%294222274Fisker Ocean240.0%new262800.0%new270298275Lexus ES230.0%+ 35.3%274610.0%– 1.6%273284276Jaguar i-Pace230.0%– 37.8%288420.0%– 31.1%287303277Bentley Bentayga220.0%– 26.7%287570.0%– 32.1%277285278Subaru Solterra210.0%+ 61.5%269480.0%+ 220.0%284312279Kia Rio200.0%– 95.1%286570.0%– 95.3%278157280Mercedes CLS200.0%– 84.7%289410.0%– 84.6%288244281Toyota Mirai200.0%+ 42.9%295310.0%+ 0.0%292309282Opel Vivaro190.0%+ 850.0%268570.0%+ 1800.0%279322283Genesis GV80190.0%+ 90.0%292330.0%– 34.0%291307284Aston Martin DBX180.0%– 33.3%271610.0%– 6.2%274296285Peugeot Expert180.0%– 72.7%277510.0%– 72.0%282258286Renault Rafale170.0%new –170.0%new302 –287DS 3150.0%– 73.7%313260.0%– 74.8%296287288Toyota Prius130.0%+ 1200.0%2671070.0%+ 494.4%264282289Ford S-Max130.0%– 96.3%285520.0%– 93.8%281197290Rolls-Royce Spectre120.0%new290300.0%new295353291Lexus LM120.0%new –120.0%new312 –292MG Marvel110.0%– 78.4%263580.0%– 66.7%275257293Cadillac Escalade110.0%+ 83.3%280360.0%+ 100.0%290323294Lexus RZ110.0%new315190.0%new300311295Jaguar XE100.0%– 88.9%303380.0%– 77.0%289275296Lexus LC100.0%– 56.5%293200.0%– 50.0%298327297Genesis G70100.0%– 44.4%316170.0%– 67.9%303308298Jeep Grand Cherokee90.0%n/a281440.0%n/a285288299Lotus Eletre90.0%new282310.0%new293321300Suzuki Across90.0%+ 200.0%311140.0%+ 16.7%307280301Genesis GV6090.0%+ 12.5%307130.0%– 74.5%309294302Rolls-Royce Cullinan80.0%– 33.3%294230.0%– 4.2%297319303Ford Galaxy80.0%– 94.8%314170.0%– 94.2%304245304Fiat Doblo80.0%– 55.6%322130.0%– 76.8%310297305Subaru Impreza80.0%– 33.3%326120.0%– 64.7%313313306Toyota Highlander70.0%n/a278490.0%+ 390.0%283328307Lotus Emira70.0%– 72.0%296190.0%– 60.4%301300308Kia Stinger60.0%– 91.4%261440.0%– 72.5%286269309Aston Martin V860.0%– 66.7%299130.0%– 62.9%311310310Iveco Eurocargo60.0%+ 20.0%308120.0%+ 20.0%314342311Maserati Levante50.0%– 77.3%291200.0%– 59.2%299314312Toyota Camry50.0%+ 0.0% –150.0%+ 150.0%305331313Lucid Air50.0%+ 400.0%305110.0%+ 83.3%315318314Maserati GranTurismo40.0%– 55.6%318100.0%+ 11.1%316339315Maxus Mifa 930.0%new297140.0%new308347316Ferrari F830.0%– 93.3%30180.0%– 92.4%318299317Genesis G8030.0%– 72.7%30280.0%– 75.0%319325318Maserati Ghibli30.0%– 62.5%32060.0%– 81.8%322326319Lexus RC30.0%+ 200.0% –40.0%+ 0.0%330 –320MG 330.0%new –30.0%new333 –321Fiat Ulysse20.0%n/a312150.0%n/a306334322BMW 6er20.0%– 95.5%32750.0%– 95.7%326277323DS 920.0%n/a –20.0%n/a334335324Man TGL0220.0%+ 0.0% –20.0%– 33.3%335n/a325Man TGM10.0%– 75.0%298100.0%+ 11.1%317n/a326Ferrari Portofino10.0%– 96.3%30470.0%– 87.3%320304327Genesis G9010.0%new30960.0%new323360328Opel Insignia10.0%– 99.8%30660.0%– 99.6%324196329Mercedes Actros10.0%– 75.0%31950.0%– 28.6%327345330Nissan Micra10.0%– 99.4%32840.0%– 99.5%331242331Aston Martin DB1110.0%– 83.3% –20.0%– 85.7%336336332Hyundai Nexo10.0%– 83.3%33220.0%– 88.2%337329333Maserati Quattroporte10.0%– 83.3% –10.0%– 91.7%341343
Source: KBA

More Stories
Days-on-Market for RV Dealers: How to Catch an Overpriced Unit Before It Sits
An overpriced RV does not announce itself. It just sits, quietly, while the dealer assumes it will move any week...
Bugatti W16 Era Ends With the Final Mistral Roadster and a 1,578 HP Farewell
Bugatti has officially reached the end of one of the most outrageous engine chapters in automotive history. After years of...
Honda Prologue EV Killed Off After 2026 as Brand Steps Back From U.S. Electric SUV Push
Honda is pulling the plug on the Prologue after just three model years, bringing an early end to the brand’s...
Germany private sales June 2026: Tesla Model Y distant leader, Leapmotor T03 in Top 10
The Leapmotor T03 is among the 10 best-selling cars with private buyers. German private customers bought 108,474 new cars in...
Aston Martin Dreadnought Brings V12 SUV Mayhem to Call of Duty Modern Warfare 4
Aston Martin is stepping into the gaming world with something that looks more ready for a war zone than a...
Israel June/Q2 2026: Kia Sportage #1, Jaecoo places 5, 8 and 7 inside Top 5
The Jaecoo 8 is #4 in Israel over Q2. According to our local partner cartube.co.il, the Israeli new car market...