
Ireland March 2024: Nissan (+35.6%), BMW (+29.6%) shine in negative market
The Nissan Juke ranks #3 in March in Ireland.
The Irish market falls a steep -15.5% year-on-year in March to 14,936 units, in what is shaping up to be a poor month across Europe. As a reminder though, March 2023: was up a smashing 36.8% on the year prior. The Q1 volume remains in positive at +8% to 62,807 sales. Toyota (-0.2%) is stable and returns to the pole position it holds year-to-date with a strong 15.7% share. Skoda (-20.3%) is bumped down to #2 at 10.5% share, close to its Q1 level of 10.9%. Nissan (+35.6%) climbs up five spots on February to #3, distancing a freefalling Volkswagen (-43.5%) and Kia (-8.7%). BMW (+29.6%) is the second and only remaining Top 10 brand in positive. Tesla is down -37.6% to #11 and BYD down one rank to #22.
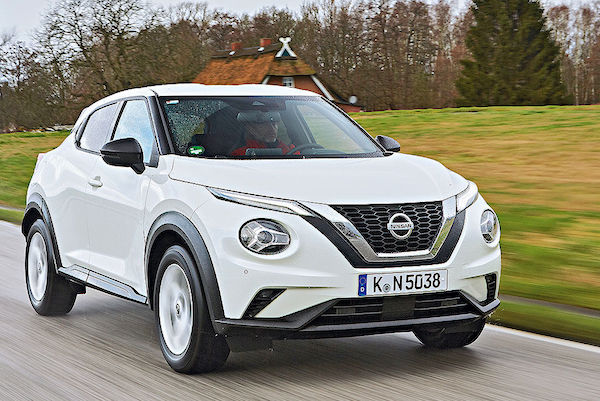
The Skoda Octavia (+74.3%) repeats at #1 with 5.6% share and ranks #2 year-to-date at 3.9%. The Toyota Yaris (+72.9%) is up 21 spots on last month to land in 2nd place above the Nissan Juke (+256.3%) surging to #3 vs. #14 in February. The Nissan Qashqai (-16.7%) and Kia Sportage (-16.3%) both fall faster than the market as does the Toyota Corolla (-43.8%) below. In contrast the Toyota RAV4 (+60.4%), Yaris Cross (+19.1%) and Hyundai Tucson (+13.1%) all manage significant year-on-year lifts, the latter staying #1 year-to-date. The best-selling recent launch is the BYD Seal at #60.
Previous month: Ireland February 2024: Skoda and Octavia tower above competition
One year ago: Ireland March 2023: Nissan Qashqai snaps first #1 spot in 4.5 years, market up 36.8%
Full March 2024 Top 37 All brands and Top 230 All models below.
Ireland March 2024 – brands:
PosBrandMar-24%/23Feb2024%/23PosFY231Toyota2,34515.7%– 0.2%29,62015.3%+ 13.1%112Skoda1,56510.5%– 20.3%16,82310.9%+ 29.8%243Nissan1,3559.1%+ 35.6%83,6405.8%+ 59.4%6114Volkswagen1,3198.8%– 43.5%35,9599.5%– 5.2%325Kia1,1707.8%– 8.7%54,4647.1%+ 7.6%556BMW7885.3%+ 29.6%102,2523.6%– 0.4%1087Hyundai7735.2%– 11.0%45,8169.3%– 2.8%438Audi5994.0%– 27.9%62,7184.3%+ 5.0%779Ford5233.5%– 51.8%142,2593.6%– 31.2%9610Peugeot4282.9%– 19.5%92,5464.1%+ 15.4%81011Tesla4222.8%– 37.6%168351.3%+ 23.2%171312Mercedes4012.7%– 3.8%131,6422.6%+ 7.2%131413Seat3952.6%– 7.3%121,4812.4%+ 3.6%151614Renault3802.5%– 37.8%72,0363.2%+ 8.3%111215Dacia3052.0%– 36.7%111,8422.9%– 26.2%12916Opel2932.0%– 18.6%171,4812.4%+ 10.5%141517Suzuki2821.9%– 4.4%151,1531.8%+ 16.5%161818Volvo2601.7%– 27.8%188161.3%– 15.8%181719Mazda2581.7%– 3.0%227571.2%+ 3.4%202220Cupra1751.2%+ 10.8%197601.2%+ 26.0%192021Citroen1741.2%+ 29.9%256141.0%+ 12.2%222122BYD1501.0%new217281.2%new212723Lexus1190.8%+ 63.0%264080.6%+ 50.0%252524Land Rover1130.8%+ 105.5%235420.9%+ 90.2%242325MG1040.7%– 5.5%206021.0%+ 142.7%231926Mini540.4%– 34.9%272030.3%– 39.2%272427Porsche480.3%+ 108.7%281700.3%– 25.1%282828Fiat330.2%– 29.8%242380.4%+ 20.8%262629DS250.2%– 30.6%31790.1%– 37.8%293130Polestar210.1%– 70.4%29740.1%– 50.3%302931Honda200.1%– 37.5%32640.1%– 44.3%323032Jeep130.1%– 27.8%30680.1%+ 74.4%313333Alfa Romeo90.1%+ 80.0%37350.1%+ 20.7%333434GWM Ora80.1%+ 300.0%34260.0%+ 100.0%353735Jaguar40.0%– 75.0%33310.0%– 36.7%343236SsangYong40.0%– 90.5%36180.0%– 62.5%363537Subaru10.0%– 83.3%3990.0%– 50.0%3736
Ireland March 2024 – models:
PosModelMar-24%/23Feb2024%/23PosFY231Skoda Octavia8335.6%+ 74.3%12,4763.9%+ 112.7%292Toyota Yaris6954.7%+ 72.9%231,4552.3%– 7.5%963Nissan Juke6204.2%+ 256.3%141,4652.3%+ 330.9%8484Nissan Qashqai6154.1%– 16.7%91,4992.4%+ 12.7%785Kia Sportage4563.1%– 16.3%22,1273.4%+ 15.1%326Toyota Yaris Cross3992.7%+ 19.1%171,8262.9%+ 5.1%547VW Tiguan3642.4%– 4.0%71,0421.7%+ 17.2%14148Hyundai Tucson3282.2%+ 13.1%32,8174.5%+ 6.1%119Toyota Corolla3262.2%– 43.8%131,5702.5%– 2.4%6310Toyota RAV43242.2%+ 60.4%51,9233.1%+ 76.6%41211Toyota C-HR2431.6%– 54.2%161,2191.9%– 29.4%11712BMW 5-Series2291.5%+ 77.5%314980.8%+ 6.6%365513Hyundai Kona2171.5%+ 1.4%391,2071.9%+ 29.2%121014Skoda Karoq2161.4%– 4.8%88481.4%+ 22.2%172915Tesla Model 32141.4%+ 13.8%154650.7%+ 144.7%373216Tesla Model Y2081.4%– 57.4%543700.6%– 24.2%511117VW Golf1971.3%– 29.9%61,2252.0%+ 149.0%102118Kia Niro1941.3%+ 0.5%265760.9%– 14.9%312219Ford Focus1901.3%– 43.3%336671.1%– 22.2%251920Ford Puma1651.1%– 32.7%298521.4%+ 2.4%161821VW ID.31601.1%– 33.3%754160.7%+ 10.6%445022Suzuki Vitara1581.1%+ 35.0%354510.7%+ 6.1%404523Toyota Corolla Cross1581.1%+ 2157.1%101,0061.6%+ 1496.8%152624Kia Picanto1571.1%+ 112.2%972670.4%+ 35.5%687225VW Arteon1491.0%+ 136.5%386021.0%+ 74.5%275326Ford Kuga1431.0%– 46.6%346561.0%– 15.8%262027VW T-Roc1431.0%+ 34.9%207941.3%– 8.2%191328Kia Ceed1410.9%+ 35.6%285050.8%+ 31.2%354429Renault Arkana1370.9%– 42.4%127751.2%+ 7.5%212430Mazda21330.9%+ 150.9%1052280.4%+ 86.9%7711731Dacia Sandero1280.9%+ 6300.0%258321.3%+ 5.6%181532Skoda Enyaq1250.8%– 50.0%823650.6%– 24.0%522733Audi Q31250.8%– 4.6%275630.9%+ 40.8%335434Dacia Duster1230.8%– 61.0%197521.2%– 29.1%221735Toyota Aygo/X1200.8%– 18.4%892470.4%– 30.8%727436Skoda Kodiaq1180.8%– 72.7%41,1991.9%+ 19.5%131637Seat Ibiza1180.8%+ 181.0%693130.5%+ 46.9%569838VW Polo1140.8%– 35.6%186891.1%+ 29.0%242539Volvo XC601130.8%– 31.1%792350.4%– 49.8%753840Seat Arona1070.7%– 5.3%245350.9%– 15.2%343441Peugeot 50081020.7%+ 2.0%535690.9%+ 47.4%325242Cupra Formentor1020.7%+ 88.9%463580.6%+ 34.1%535943Skoda Superb1010.7%– 56.5%225981.0%– 24.1%282344BMW X11010.7%+ 114.9%612790.4%+ 55.0%629945Audi A31000.7%– 21.9%374240.7%+ 25.1%435646Peugeot 3008960.6%– 7.7%367061.1%+ 7.3%233347Mercedes E Class960.6%+ 209.7%722430.4%+ 42.9%7312048Skoda Fabia920.6%+ 58.6%594500.7%+ 51.5%416849Seat Tarraco910.6%– 15.0%623050.5%+ 46.6%587350Audi Q4900.6%– 28.0%482670.4%– 10.4%676551Opel Mokka890.6%– 39.0%444580.7%– 35.7%383752Kia Stonic890.6%– 36.0%493770.6%+ 34.2%476653Opel Corsa890.6%+ 147.2%564090.7%+ 205.2%455854Renault Captur840.6%– 7.7%304270.7%+ 29.0%424755BMW X3840.6%– 2.3%1011940.3%+ 79.6%898756VW T-Cross800.5%– 53.2%1082730.4%– 57.3%644157Hyundai i20790.5%– 58.9%117791.2%+ 27.5%203558Renault Clio770.5%– 51.6%633020.5%– 44.4%593959Audi A4770.5%– 35.3%503710.6%– 10.6%504660BYD Seal770.5%new583750.6%new4824361Audi A6750.5%– 42.7%513740.6%– 3.4%496062MG4710.5%+ 51.1%414030.6%+ 170.5%463163Kia EV6700.5%– 31.4%942700.4%– 33.2%654064BMW 3-Series700.5%+ 52.2%663180.5%+ 30.9%557965BMW IX1680.5%n/a882050.3%+ 20400.0%8313966Peugeot 2008660.4%– 62.5%325950.9%+ 57.0%293067Peugeot 208650.4%+ 38.3%472420.4%– 38.6%746468Suzuki SX4 S-Cross630.4%– 11.3%552980.5%+ 53.6%607769VW ID.4620.4%– 90.7%1364570.7%– 68.7%39570Opel Crossland X610.4%+ 74.3%961830.3%+ 88.7%959071Skoda Kamiq570.4%– 72.2%215920.9%+ 1.2%304272Dacia Jogger540.4%– 67.3%522580.4%– 60.1%703673Mercedes GLC540.4%+ 20.0%702330.4%+ 37.9%769374Volvo XC90530.4%+ 10.4%682070.3%+ 1.5%828075Hyundai Bayon520.3%+ 73.3%452540.4%+ 27.6%719576Peugeot 408510.3%– 26.1%832650.4%+ 32.5%698577Renault Austral510.3%new403530.6%new5411278Lexus LBX500.3%new231510.1%new151 –79Toyota bZ4X490.3%– 60.2%781590.3%– 38.1%1006280Mercedes CLA490.3%– 29.0%842010.3%– 6.1%857881Mercedes GLA470.3%– 43.4%762240.4%– 28.9%798382Range Rover Sport470.3%+ 213.3%742790.4%+ 310.3%6313183BYD Atto 3450.3%new1162000.3%new867584Volvo EX30440.3%new1191150.2%new119 –85Citroen C5 Aircross430.3%– 36.8%1061510.2%– 35.2%1027686Nissan Ariya420.3%– 8.7%1171400.2%+ 10.2%11015587Mazda CX-5420.3%+ 5.0%911860.3%+ 5.1%9310088BMW i4420.3%+ 23.5%1131110.2%– 65.2%1207189Nissan X-Trail420.3%+ 147.1%873120.5%+ 352.2%579190BMW X5410.3%– 50.6%1501400.2%– 22.2%1095791Hyundai Ioniq 5410.3%+ 36.7%862690.4%– 72.6%662892Seat Ateca400.3%– 75.5%672210.4%– 40.4%815193Lexus NX390.3%+ 8.3%811800.3%+ 33.3%9611994Porsche Cayenne390.3%+ 254.5%103980.2%+ 18.1%12312995Mazda CX-30360.2%– 60.4%1101280.2%– 37.3%11510296Nissan Leaf360.2%– 37.9%1282240.4%– 26.8%808497Kia EV9350.2%new1251480.2%new10522998Seat Leon340.2%+ 3300.0%99790.1%+ 1028.6%13417899Volvo XC40330.2%– 70.8%651880.3%– 8.7%9270100Cupra Born330.2%– 52.9%801500.2%– 40.9%10363101Mercedes GLE330.2%– 15.4%1121320.2%+ 63.0%112124102BMW iX3330.2%– 5.7%151640.1%– 60.0%140109103BMW 1-Series330.2%+ 73.7%981260.2%+ 113.6%117146104Citroen C4320.2%+ 300.0%1181430.2%+ 155.4%107118105Opel Astra300.2%– 47.4%772270.4%+ 12.4%78104106Suzuki Swift300.2%– 36.2%432020.3%+ 23.2%8497107Citroen Berlingo300.2%+ 400.0%124810.1%+ 523.1%132137108Suzuki Ignis290.2%– 35.6%641840.3%+ 8.9%9492109Kia Sorento280.2%– 24.3%1301940.3%+ 23.6%9043110BYD Dolphin280.2%new1041530.2%new101198111Audi Q2270.2%– 15.6%921400.2%+ 42.9%108114112Mercedes EQE SUV270.2%new207650.1%new139217113Audi A5250.2%– 30.6%951390.2%– 3.5%111103114Cupra Leon250.2%– 26.5%731980.3%+ 141.5%87105115Hyundai i10250.2%+ 8.7%901750.3%– 47.0%9761116Mercedes CLE Coupe250.2%new126770.1%new136 –117Renault Megane240.2%– 78.6%601610.3%– 27.8%9969118Skoda Scala230.2%– 71.6%422950.5%+ 20.4%6181119Opel Grandland X230.2%– 71.3%1151980.3%+ 8.2%88106120Mini Hatch230.2%– 56.6%129840.1%– 56.5%12988121Peugeot 308230.2%+ 53.3%127830.1%– 38.5%130121122Polestar 2210.1%– 70.4%120740.1%– 50.3%137108123Mazda CX-60210.1%– 46.2%1141030.2%– 11.2%121122124Citroen C3210.1%– 30.0%165640.1%– 45.8%141123125Mazda3210.1%– 27.6%141890.1%+ 30.9%126147126Range Rover 210.1%+ 40.0%140540.1%+ 0.0%149142127Land Rover Defender210.1%+ 950.0%135850.1%+ 962.5%128149128Audi A1200.1%– 50.0%109930.1%– 33.1%125116129DS 7200.1%+ 33.3%147540.1%+ 12.5%148159130Lexus ES200.1%+ 42.9%132770.1%– 9.4%135135131Toyota Camry190.1%– 9.5%1311030.2%+ 35.5%122127132BMW 2-Series180.1%– 59.1%1021310.2%– 37.0%11382133Mercedes GLB180.1%– 25.0%155590.1%– 40.4%144111134Hyundai Ioniq 6170.1%– 51.4%1591440.2%+ 311.4%10696135Fiat 500170.1%– 32.0%145670.1%– 48.9%13894136Peugeot Rifter170.1%+ 183.3%168350.1%+ 84.2%167154137MG ZS170.1%+ 1600.0%1001160.2%+ 625.0%118113138Audi Q8 E-Tron170.1%new143610.1%new143158139Citroen E-C4 X170.1%new208380.1%new161210140Audi Q5160.1%– 61.9%851690.3%– 11.5%9889141BMW 4-Series150.1%– 63.4%161390.1%– 78.5%160115142Cupra Ateca150.1%new148540.1%new147226143Hyundai i30140.1%– 66.7%1331490.2%– 3.2%104110144Mercedes EQE140.1%– 53.3%711270.2%+ 28.3%116136145VW Taigo130.1%– 88.4%931890.3%– 42.7%9167146Fiat Panda130.1%– 35.0%571300.2%+ 550.0%114138147Mini Countryman130.1%– 18.8%162340.1%– 57.0%170133148VW Touareg130.1%+ 225.0%163410.1%+ 310.0%158196149MG5120.1%– 58.6%154490.1%+ 63.3%153126150BMW iX120.1%– 42.9%166350.1%– 59.8%165145151Citroen C3 Aircross120.1%+ 20.0%153560.1%+ 7.7%146157152BMW X7110.1%+ 57.1% –130.0%– 7.1%200187153Volvo C40100.1%– 68.8%138580.1%– 30.1%145144154Mercedes C Class100.1%– 52.4%137530.1%– 51.8%150125155Mercedes EQB100.1%– 33.3%139820.1%+ 54.7%131148156Mini Convertible100.1%– 16.7%122500.1%+ 13.6%152152156BMW 7 Series100.1%+ 11.1%156300.0%+ 42.9%172175157Audi e-Tron GT100.1%+ 11.1%216200.0%– 68.3%183156158BMW X2100.1%+ 900.0%183150.0%+ 114.3%195223159Lexus RX90.1%– 57.1%121800.1%+ 100.0%133143160Citroen C5 X90.1%+ 80.0%157370.1%+ 19.4%163164161Land Rover Discovery Sport90.1%+ 125.0%123630.1%+ 65.8%142166162Range Rover Evoque90.1%+ 350.0%142400.1%– 36.5%159150163VW ID.Buzz90.1%new192130.0%new206 –164Porsche Taycan80.1%+ 166.7%214450.1%– 54.5%156128165Mini Clubman80.1%+ 300.0%134350.1%+ 94.4%166182166Toyota Prius80.1%n/a146940.1%n/a124140167GWM Ora 0380.1%new164260.0%new177194168Peugeot 50870.0%– 50.0%194440.1%+ 33.3%156172169Honda Civic70.0%– 41.7%158300.0%+ 11.1%173167170Ford Tourneo70.0%– 12.5%167130.0%– 48.0%202186171VW T770.0%+ 0.0%176130.0%+ 30.0%207192172Volvo V6070.0%+ 133.3%206130.0%+ 116.7%205209173BMW i570.0%new178360.1%new164206174Renault Kangoo70.0%n/a210180.0%n/a187 –175Audi Q860.0%– 50.0%160280.0%+ 27.3%175176176Range Rover Velar60.0%– 50.0%202160.0%– 66.0%194169177Honda E60.0%– 14.3% –70.0%– 22.2%220218178Ford Ecosport60.0%n/a179220.0%n/a180260179Citroen C4 X60.0%new180120.0%new208 –180VW Up!50.0%– 76.2%107890.1%+ 206.9%127141181Audi Q750.0%– 73.7%156320.1%– 27.3%171163182Jeep Renegade50.0%– 28.6%190160.0%+ 33.3%193214183Mercedes S Class50.0%+ 0.0%170300.0%+ 66.7%174185184Seat Altea50.0%n/a144280.0%n/a176233185Ford Fiesta40.0%– 97.4%213230.0%– 96.3%17949186MG HS40.0%– 87.9%169340.1%– 35.8%169151187Mercedes A Class40.0%– 76.5%174190.0%– 73.2%186153188Mercedes EQA40.0%– 63.6%152450.1%+ 40.6%155161189Jeep Compass40.0%– 63.6%171140.0%– 48.1%199179190Honda Jazz40.0%– 33.3%215190.0%– 60.4%185156191Alfa Romeo Stelvio40.0%– 20.0%22780.0%– 38.5%217235192BMW X440.0%+ 100.0%204100.0%– 28.6%215211193Jeep Avenger40.0%new177380.1%new162225194Toyota Highlander40.0%n/a185180.0%+ 63.6%189200195Alfa Romeo Giulia40.0%n/a224100.0%– 37.5%213219196Ssangyong Korando30.0%– 92.9%187120.0%– 73.9%210173197DS 430.0%– 80.0%193160.0%– 75.0%192160198Mazda MX-530.0%– 62.5%205120.0%– 29.4%209181199Honda CR-V30.0%– 57.1% –30.0%– 90.3%238177200Audi A730.0%n/a181200.0%+ 185.7%182204201Suzuki Swace20.0%– 86.7%195180.0%– 52.6%188168202Jaguar i-Pace20.0%– 85.7%175130.0%– 64.9%203170203Citroen Spacetourer20.0%– 66.7% –110.0%– 38.9%211193204Audi A820.0%– 60.0%19960.0%– 40.0%223216205Mazda MX-3020.0%– 50.0% –110.0%– 31.3%212202206DS 320.0%– 33.3%22170.0%– 41.7%219208207Fiat 500X20.0%+ 100.0%111340.1%+ 161.5%168207208Citroen Dispatch20.0%+ 100.0% –150.0%+ 650.0%196 –209Ford Mustang Mach-E20.0%new189130.0%new201165210Mercedes GLS20.0%n/a –50.0%+ 0.0%228234211VW ID.510.0%– 98.5%201440.1%– 76.1%157107212Ford Transit Custom10.0%– 98.0% –10.0%– 98.7%253162213VW Caddy10.0%– 97.6%149240.0%– 80.3%178132214Ford Galaxy10.0%– 87.5% –20.0%– 92.3%242188215Mercedes AMG GT10.0%– 66.7%19770.0%– 12.5%221215216Lexus UX10.0%– 50.0%184200.0%+ 66.7%184171217Jaguar F-Pace10.0%– 50.0%186140.0%+ 27.3%198212218Audi e-Tron10.0%– 50.0%182100.0%– 64.3%214190219VW ID.710.0%new198480.1%new154 –220Alfa Romeo Tonale10.0%new226170.0%new190184221Mercedes V Class10.0%n/a188170.0%+ 750.0%191221222Mercedes EQS SUV10.0%new209130.0%new204199223Peugeot Partner10.0%n/a19170.0%n/a222 –224Fiat 500C10.0%n/a –40.0%n/a232 –225Ssangyong Rexton10.0%n/a –30.0%n/a235262226Jaguar E-Pace10.0%n/a –20.0%n/a244250227Porsche Cayman10.0%n/a23020.0%+ 0.0%245232228Subaru Outback10.0%n/a –10.0%+ 0.0%254256229Opel Vivaro10.0%n/a –10.0%n/a255 –
Source: SIMI

More Stories
FixGo Expands to San Diego County with 20 New Tire-Installation Partners
LOS ANGELES, CA — July 6, 2026 — FixGo, an online tire retailer that pairs web-based purchasing with local installation,...
Ford Recalls 565,691 Bronco and Bronco Raptor SUVs Over Engine Bay Fire Risk
Ford is recalling 565,691 Bronco and Bronco Raptor SUVs in the United States because of a potential fire risk tied...
2027 Toyota Crown Gets Updated Hybrid Power and a Subtle Styling Refresh
Toyota is giving the 2027 Crown a light but meaningful update, keeping its unusual sedan-meets-crossover formula while adding a new...
Why a VIN Search Should Be Your First Step Before Buying a Used Car
Buying a used vehicle involves more than comparing prices and inspecting the exterior. A car may look well-maintained while still...
Test Drive: The Renault Twingo E-Tech
After the Renault Clio VI, we stay with the French manufacturer to now test drive the new Twingo E-Tech. The...
Our Review of the Goodwood Festival of Speed 2026
As we do most years, we attended this year’s Goodwood Festival of Speed 2026 on Sunday, 12 July. The weather...