
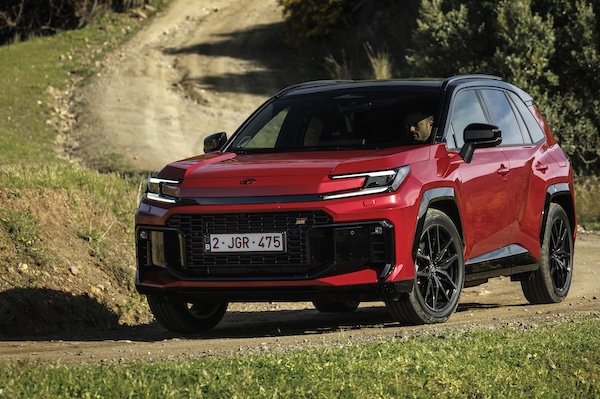
Ireland May 2026: Toyota RAV4 repeats at #1 in market up 38.3%
The Toyota RAV4 is the most popular vehicle in Ireland for the 2nd month running.
New car sales in Ireland surge 38.3% year-on-year in May to 8,054 units. This leads to a year-to-date tally up 4.7% to 83,024. Four of the Top 5 brands register fantastic YoY gains. Volkswagen (+70.3%) jumps into pole position for the first time since last February with a splendid 18.5% share to be compared with 11.4% year-to-date. Toyota (+180.4%) drops to #2 but delivers the biggest YoY increase in the Top 8. Skoda (+119.7%) is also down one spot on April to #3 while Audi (+74.8%) surges to #5. Kia (-4.1%) can’t follow the crazy pace just as Hyundai (-51.1%) implodes at #6. Tesla (+190.1%), BYD (+157.9%) and Renault (+66.4%) also impress below.
The Toyota RAV4 (+377.7%) repeats at #1 with 5.6% share but still ranks at a low #13 year-to-date given the small footprint of this month over the YTD tally. The VW ID.4 (+396.9%) climbs up to #2 with the VW Golf (+122%) rounding out the podium above the Skoda Octavia (+75%) and Toyota Yaris Cross (+102.8%) still #1 year-to-date. The Toyota C-HR (+280.5%), Skoda Kodiaq (+151.4%), Toyota Corolla (+127.1%) and VW T-Roc (+112.8%) also post surreal gains in the remainder of the Top 10.
Previous month: Ireland April 2026: Toyota RAV4 surges to record 8.4% share
One year ago: Ireland May 2025: VW Tiguan #1, Hyundai Inster inside Top 10
Full May 2026 Top 39 All brands and Top 227 All models below.
Ireland May 2026 – brands:
PosBrandMay-26%/25Apr2026%/25PosFY251Volkswagen1,49218.5%+ 70.3%39,42411.4%+ 5.5%222Toyota1,30416.2%+ 180.4%111,70614.1%+ 3.8%113Skoda99312.3%+ 119.7%28,1989.9%+ 10.7%334Kia5346.6%– 4.1%46,4517.8%+ 3.8%555Audi4115.1%+ 74.9%83,2884.0%+ 9.7%676Hyundai3574.4%– 51.1%57,2978.8%– 4.6%447BMW3374.2%+ 1.8%73,1103.7%– 4.8%768BYD2943.6%+ 157.9%92,6953.2%+ 100.1%11159Tesla2643.3%+ 190.1%241,1951.4%+ 20.2%221410Seat2132.6%+ 27.5%131,4601.8%– 10.0%171811Renault1832.3%+ 66.4%102,7673.3%– 6.0%101112Mercedes1682.1%– 8.7%191,9732.4%+ 9.6%151313Ford1642.0%– 44.0%63,0323.7%+ 7.4%8914Peugeot1421.8%+ 9.2%122,6923.2%– 8.2%12815Citroen1271.6%+ 122.8%141,3281.6%+ 106.5%192216Dacia1271.6%– 36.5%112,4182.9%– 1.4%131017Opel1271.6%+ 32.3%162,0782.5%+ 34.2%141718Cupra1111.4%+ 101.8%181,5281.8%+ 29.5%161919Suzuki1101.4%– 3.5%201,2901.6%– 22.2%201620Volvo1001.2%– 19.4%171,3411.6%+ 7.8%182021MG961.2%+ 41.2%151,2751.5%+ 36.9%212122Nissan680.8%+ 65.9%252,8673.5%– 10.2%91223Mini630.8%+ 80.0%234260.5%– 5.5%262624Mazda460.6%+ 142.1%276920.8%– 32.2%242425Lexus390.5%– 30.4%227070.9%– 12.8%232326Leapmotor380.5%new262560.3%new293827Land Rover310.4%– 47.5%214810.6%– 20.1%252528Porsche230.3%– 36.1%291860.2%– 35.6%312829Xpeng210.3%+ 162.5%283280.4%+ 337.3%273330Honda200.2%+ 5.3%312660.3%+ 4.3%282931Fiat150.2%– 75.4%301050.1%– 76.7%322732Jeep140.2%– 44.0%33890.1%– 20.5%333133KGM/SsangYong80.1%+ 60.0%32580.1%+ 93.3%343634Polestar80.1%– 11.1%341860.2%+ 215.3%303235DS20.0%+ 100.0%35500.1%– 53.7%353436Alfa Romeo10.0%– 50.0%37210.0%– 25.0%363537Alpine10.0%– 80.0%36180.0%+ 100.0%373738Lamborghini10.0%n/a –10.0%n/a41 –39Skywell10.0%new –10.0%new43 –
Ireland May 2026 – models:
PosModelMay-26%/25Apr2026%/25PosFY251Toyota RAV44495.6%+ 377.7%11,3501.6%– 43.8%1352VW ID.43183.9%+ 396.9%91,5501.9%+ 34.3%12133VW Golf2823.5%+ 122.0%41,5631.9%+ 0.5%11104Skoda Octavia2312.9%+ 75.0%21,9312.3%– 11.7%625Toyota Yaris Cross2212.7%+ 102.8%302,7403.3%+ 15.5%146Toyota Corolla1932.4%+ 127.1%242,0132.4%+ 10.4%467Skoda Kodiaq1862.3%+ 151.4%32,0072.4%+ 11.7%578VW T-Roc1832.3%+ 112.8%181,0291.2%– 16.6%20159Kia Sportage1712.1%– 14.5%72,3792.9%+ 3.1%3310Toyota C-HR1561.9%+ 280.5%51,6081.9%+ 18.8%101211VW Tiguan1521.9%– 27.3%61,6652.0%– 3.0%9812VW Tayron1471.8%+ 93.4%178421.0%+ 90.5%243113VW Polo1461.8%– 13.6%169371.1%– 10.1%212214Tesla Model 31451.8%+ 281.6%1565580.7%– 20.1%451915Hyundai Tucson1371.7%– 29.4%122,5153.0%– 24.1%2116Toyota bZ4X1361.7%+ 1033.3%547070.9%+ 139.7%337817Skoda Elroq1341.7%+ 306.1%157300.9%+ 282.2%275318Skoda Enyaq1291.6%+ 360.7%87370.9%+ 89.0%265119Tesla Model Y1191.5%+ 124.5%606370.8%+ 115.2%382720Cupra Leon1121.4%+ 918.2%1192580.3%+ 29.6%9811721Skoda Karoq1121.4%+ 69.7%108891.1%– 1.1%222122Opel Frontera1031.3%new201,0781.3%new1720123Toyota Yaris961.2%+ 77.8%511,2341.5%– 8.6%151424VW ID.3921.1%+ 228.6%275160.6%+ 44.9%506225VW T-Cross911.1%+ 468.8%375220.6%– 17.8%494426Hyundai Kona841.0%– 1.2%111,7882.2%+ 4.3%7927Skoda Fabia811.0%+ 161.3%266170.7%+ 11.4%404628Audi A5760.9%+ 162.1%484480.5%+ 5.4%565429Renault Captur750.9%+ 134.4%536840.8%– 13.6%366130BYD Seal U740.9%+ 1.4%131,1361.4%+ 62.8%162631BYD Sealion 7650.8%+ 364.3%436030.7%+ 548.4%417532Audi A3640.8%+ 68.4%393210.4%– 41.8%784033Audi A6630.8%+ 65.8%364110.5%– 12.4%605534Kia Stonic600.7%+ 9.1%556170.7%+ 38.3%394735Audi Q5540.7%+ 68.8%523660.4%+ 44.1%679236BMW 5-Series540.7%+ 5.9%285490.7%– 14.9%463637Seat Ateca540.7%+ 22.7%893170.4%– 17.7%816538Suzuki Vitara540.7%+ 92.9%593650.4%– 9.0%695939BMW X5520.6%+ 62.5%404790.6%– 27.9%543940Ford Puma520.6%+ 20.9%141,0501.3%+ 12.2%182441Kia EV3520.6%– 5.5%297210.9%– 2.2%302542MGS5520.6%new474340.5%new5916343Audi Q3500.6%+ 316.7%357210.9%+ 32.1%284144Kia EV5490.6%new225700.7%new4426745Dacia Sandero460.6%– 48.3%257180.9%– 31.7%311746Skoda Superb460.6%+ 2.2%415370.6%– 14.6%483547BYD Dolphin Surf440.5%new682680.3%new9620648Ford Tourneo430.5%– 60.2%452450.3%+ 16.1%1037649BMW X3420.5%– 32.3%693040.4%– 19.4%866050Skoda Kamiq420.5%+ 7.7%424970.6%+ 6.4%515751Audi Q6 e-tron410.5%+ 310.0%671440.2%+ 41.2%13515052BMW iX3410.5%+ 925.0%331950.2%+ 747.8%11822753Citroen C3410.5%+ 4000.0%773610.4%+ 8925.0%7011854Hyundai Inster410.5%– 66.4%197030.8%+ 134.3%343255Seat Ibiza410.5%+ 272.7% –2900.3%– 34.7%926756Suzuki Swift410.5%+ 0.0%576870.8%+ 39.6%355257Hyundai i20400.5%– 47.4%217130.9%– 11.9%322858Mercedes CLA390.5%+ 143.8%1291000.1%– 46.2%15410859Nissan Qashqai390.5%+ 116.7%1321,2701.5%+ 1.1%141860Volvo XC60380.5%– 26.9%764010.5%– 1.5%635861Dacia Bigster370.5%+ 54.2%727210.9%+ 1101.7%298262BYD Seal 6350.4%new1591340.2%new139 –63Peugeot 3008350.4%– 12.5%648651.0%– 26.1%231664BMW IX1330.4%+ 0.0%1142840.3%+ 27.9%939765BMW X1330.4%– 44.1%444430.5%– 4.5%575066BYD Sealion 5330.4%new108600.1%new176 –67Citroen C3 Aircross330.4%n/a503660.4%+ 18200.0%6827568Kia Sorento330.4%– 50.7%464740.6%– 22.2%553069Toyota Corolla Cross330.4%– 44.1%651,7262.1%+ 28.2%81170Dacia Duster320.4%– 54.3%387540.9%– 23.1%252071Ford Kuga320.4%– 64.0%236690.8%+ 3.2%373472Kia EV2320.4%new78690.1%new169 –73Skoda Scala320.4%+ 700.0%622520.3%– 14.9%1009074VW Taigo310.4%– 58.1%663070.4%– 17.0%847475Kia Picanto300.4%+ 42.9%922590.3%– 9.4%978576Mini Cooper290.4%+ 26.1%911860.2%– 38.8%1228677BYD Seal280.3%+ 180.0%632960.4%+ 2.4%918778Peugeot 5008270.3%– 28.9%816000.7%– 18.6%422979Kia EV6260.3%– 39.5%743980.5%– 35.2%643380Kia Niro260.3%– 42.2%1053100.4%– 49.7%834281Mercedes E Class260.3%+ 62.5%1423750.5%+ 7.8%657382Mini Countryman260.3%+ 420.0%941630.2%+ 120.3%12913583Peugeot 2008260.3%+ 13.0%1035820.7%+ 33.5%433884BMW 3-Series250.3%+ 25.0%862210.3%+ 15.7%1119985Cupra Terramar250.3%+ 177.8%843410.4%+ 105.4%739586Seat Arona250.3%– 56.1%884110.5%– 29.5%614987Cupra Tavascan240.3%+ 700.0%873000.4%+ 53.8%899688Mazda2240.3%n/a1541270.2%+ 27.0%14214489Renault 5240.3%+ 118.2%583190.4%+ 246.7%8010390Peugeot 308230.3%+ 475.0%1452030.2%+ 269.1%11517891Renault Megane230.3%+ 666.7%852550.3%+ 138.3%9912992Renault Symbioz230.3%+ 228.6%1164870.6%– 18.7%534893VW ID.7230.3%+ 155.6%1222040.2%– 9.7%1149394Citroen C5 Aircross220.3%+ 83.3%933020.4%+ 36.0%8710795Cupra Born220.3%+ 46.7%1092460.3%+ 39.8%10210296Leapmotor C10220.3%new1251200.1%new14425397Mercedes GLC220.3%+ 37.5%1263200.4%+ 10.3%798098Audi Q2210.3%+ 90.9%991880.2%+ 33.3%11912599Xpeng G6210.3%+ 162.5%833280.4%+ 337.3%76149100Kia EV4200.2%new1152220.3%new109176101Mercedes C Class200.2%+ 25.0%1512280.3%+ 39.9%108112102Hyundai Ioniq 6190.2%+ 137.5%613580.4%+ 184.1%71162103Mercedes GLE190.2%+ 35.7%1341640.2%+ 76.3%128142104Toyota Aygo X190.2%+ 137.5%1073000.4%+ 44.2%90105105Volvo XC90190.2%– 5.0%1443020.4%+ 12.7%8889106Audi Q4180.2%– 14.3%1131490.2%+ 12.9%133115107Cupra Formentor180.2%+ 12.5%1103720.4%– 6.3%6663108Kia PV5180.2%new106900.1%new157 –109Hyundai Ioniq 5170.2%– 70.2%564910.6%+ 77.9%5268110Lexus NX170.2%– 5.6%1023050.4%+ 3.4%8579111MG S6170.2%new150430.1%new193 –112Ford Explorer160.2%+ 33.3%314400.5%+ 66.0%5884113Renault 4160.2%new1331730.2%new126219114Volvo XC40160.2%– 27.3%1381130.1%+ 14.1%148154115BMW i4150.2%+ 87.5%1711110.1%– 31.9%149136116Suzuki SX4 S-Cross150.2%– 59.5%1122380.3%– 64.6%10645117Citroen Berlingo140.2%– 33.3%971240.1%+ 3.3%143121118MG HS140.2%– 26.3%1621840.2%+ 29.6%123119119Fiat Panda130.2%– 62.9%111610.1%– 74.5%174124120Leapmotor B10130.2%new981100.1%new150273121Mercedes GLA130.2%– 23.5%1313150.4%+ 18.9%8294122Nissan X-Trail130.2%+ 333.3%1822510.3%– 26.8%10183123BMW IX2120.1%+ 33.3%167830.1%+ 232.0%161164124Dacia Jogger120.1%– 14.3%1241970.2%– 31.4%11781125Ford Focus120.1%– 58.6%704100.5%– 35.3%6237126Hyundai Santa Fe120.1%– 45.5%1172450.3%– 39.7%10469127Jeep Compass120.1%+ 1100.0%160360.0%+ 260.0%199233128Peugeot 408120.1%+ 500.0%1741620.2%+ 35.0%130148129VW ID.5120.1%+ 140.0%961830.2%+ 147.3%124151130Audi Q7110.1%– 52.2%1181010.1%– 35.7%153128131BYD Dolphin110.1%+ 37.5%1231190.1%+ 56.6%146157132Mazda CX-80110.1%+ 266.7%2011410.2%+ 110.4%138165133Volvo EX30110.1%– 31.3%1041060.1%– 63.4%151111134Volvo EX40110.1%+ 37.5%1472830.3%+ 211.0%94110135Lexus LBX100.1%– 58.3%1012060.2%– 15.9%11388136Porsche Macan100.1%– 9.1%152610.1%– 29.1%175156137Range Rover Sport100.1%– 67.7%732000.2%– 22.5%116100138VW Touareg100.1%n/a186500.1%+ 47.1%184194139Kia EV990.1%– 35.7%120980.1%– 32.4%155130140Opel Grandland X90.1%– 55.0%1213250.4%– 1.5%7772141Peugeot 20890.1%– 30.8%492220.3%– 35.1%110113142Range Rover Velar90.1%+ 800.0%170370.0%+ 105.6%197224143Renault Scenic90.1%+ 28.6%1351300.2%– 18.2%141126144BMW 1-Series80.1%+ 0.0%1391040.1%– 32.9%152122145Kia K480.1%new1282420.3%new105 –146Nissan Juke80.1%+ 60.0%1641,0351.2%– 6.7%1923147Peugeot Rifter80.1%+ 14.3%146550.1%+ 1.9%180169148Porsche Cayenne80.1%– 42.9%184640.1%– 42.9%171138149Range Rover 80.1%+ 33.3%153960.1%– 17.2%156146150Ssangyong Torres80.1%+ 300.0%136540.1%+ 184.2%181200151BMW 2-Series70.1%– 58.8%791860.2%+ 10.1%120123152Citroen C470.1%– 30.0%1301320.2%– 24.6%140114153Lexus UX70.1%+ 600.0%179600.1%+ 9.1%177175154Mercedes A Class70.1%– 30.0%191750.1%– 34.2%168145155MG ZS70.1%– 72.0%802800.3%+ 13.4%9598156Nissan Micra70.1%new127790.1%new167 –156Polestar 270.1%n/a165620.1%+ 77.1%173192157Renault Austral70.1%+ 250.0%325450.7%+ 139.0%47106158Audi A6 e-tron60.1%new196560.1%new179188159BMW XM60.1%+ 100.0%168370.0%– 2.6%195196160Citroen C260.1%n/a188140.0%n/a223 –161Honda Civic60.1%+ 100.0%172520.1%+ 2.0%182187162Hyundai Bayon60.1%– 25.0%1401860.2%– 12.3%121101163Mercedes CLE Coupe60.1%– 14.3%1611200.1%+ 3.4%145140164Mercedes V Class60.1%+ 500.0%214320.0%+ 0.0%202202165Mini Aceman60.1%+ 200.0%181510.1%+ 59.4%183208166Opel Astra60.1%– 57.1%143850.1%– 62.7%159104167Ford Capri50.1%– 28.6%901440.2%+ 121.5%136168168Ford Transit Custom50.1%+ 400.0%75580.1%+ 286.7%178246169Honda Jazz50.1%+ 0.0%199800.1%+ 8.1%164160170Mazda CX-3050.1%+ 150.0% –1410.2%– 10.2%137127171Mercedes AMG GT50.1%+ 150.0%192430.1%+ 48.3%191204172Opel Corsa50.1%+ 66.7%1833330.4%– 24.8%7470173Renault Clio50.1%– 73.7%951650.2%– 56.9%12743174BYD Atto 340.0%– 55.6%158790.1%– 58.6%165120175Honda HR-V40.0%– 42.9%166930.1%+ 5.7%156152176Land Rover Defender40.0%– 66.7%148490.1%– 41.0%186147177VW T740.0%– 55.6%205370.0%– 38.3%198174178Audi A130.0%– 66.7%1561180.1%+ 7.3%147132179BMW i530.0%– 72.7%222190.0%– 62.0%213186180BMW X730.0%n/a177180.0%+ 38.5%215228181Honda ZR-V30.0%+ 50.0%230140.0%– 17.6%224231182Leapmotor T0330.0%new189260.0%new206264183Lexus RX30.0%– 57.1%149790.1%– 10.2%166156184Mazda CX-6030.0%+ 50.0%2341450.2%+ 66.7%134158185Mazda330.0%+ 50.0%1903290.4%+ 301.2%75161186MG330.0%– 40.0%711570.2%+ 34.2%131137187Opel Combo30.0%– 76.9%169370.0%– 28.8%196170188Seat Leon30.0%– 92.3%343530.4%+ 89.8%7291189Volvo EX9030.0%– 25.0%185170.0%– 50.0%218190190Audi e-Tron20.0%n/a22050.0%n/a241 –191Audi Q820.0%– 77.8%187350.0%– 54.5%200166192BMW 4-Series20.0%+ 0.0%207240.0%– 46.7%208193193Fiat 60020.0%– 50.0%229440.1%– 32.3%188177194Lexus RZ20.0%n/a178440.1%+ 214.3%189225195Mercedes G Class20.0%n/a202140.0%+ 40.0%225243196MG420.0%– 87.5%1551760.2%– 53.2%12577197Mini Convertible20.0%– 50.0%23770.0%– 46.2%238230198Porsche Panamera20.0%– 71.4%203210.0%– 57.1%211183199Porsche Taycan20.0%+ 0.0%176150.0%– 31.8%221217200Volvo C40/EC4020.0%+ 0.0%137860.1%+ 126.3%158179201Alfa Romeo Junior10.0%+ 0.0% –110.0%+ 57.1%230211202Alpine A29010.0%new195170.0%new217237203BMW X210.0%– 66.7% –110.0%– 42.1%231221204Citroen Ami10.0%n/a22530.0%– 84.2%249229205Citroen Jumper10.0%n/a –10.0%n/a270 –206Citroen Multispace10.0%– 66.7%22720.0%– 33.3%260 –207Citroen Spacetourer10.0%+ 0.0%22890.0%+ 125.0%235265208DS 710.0%+ 0.0%209260.0%– 61.2%204180209DS 910.0%new198120.0%new229 –210Honda CR-V10.0%– 50.0%210260.0%+ 4.0%205198211Honda Prelude10.0%new –10.0%new272 –212Hyundai i3010.0%– 96.0%231820.1%– 45.3%162131213Jeep Avenger10.0%– 95.8%173490.1%– 42.4%185143214Jeep Grand Cherokee10.0%n/a21230.0%n/a250 –215Lamborghini Unidentified10.0%n/a –10.0%n/a274 –216Mercedes EQA10.0%– 50.0%193430.1%+ 34.4%192199217Mercedes EQS10.0%– 75.0% –20.0%– 81.8%262242218Mercedes S Class10.0%– 66.7% –240.0%– 14.3%209205219MG Cyberster10.0%– 50.0% –10.0%– 87.5%277247220Nissan Ariya10.0%– 93.3%1632320.3%+ 27.5%107116221Opel Mokka10.0%– 97.7%1572180.3%– 48.2%11266222Polestar 410.0%– 87.5%175840.1%+ 300.0%160172223Porsche 911/Carrera10.0%– 50.0%215250.0%+ 25.0%207223224Renault Trafic10.0%n/a –10.0%n/a282 –225Skywell BE1110.0%new –10.0%new283 –226Toyota Prius10.0%– 66.7% –210.0%– 77.7%212159227VW ID.Buzz10.0%– 75.0%194170.0%– 5.6%219189
Source: SIMI

More Stories
FixGo Expands to San Diego County with 20 New Tire-Installation Partners
LOS ANGELES, CA — July 6, 2026 — FixGo, an online tire retailer that pairs web-based purchasing with local installation,...
Ford Recalls 565,691 Bronco and Bronco Raptor SUVs Over Engine Bay Fire Risk
Ford is recalling 565,691 Bronco and Bronco Raptor SUVs in the United States because of a potential fire risk tied...
2027 Toyota Crown Gets Updated Hybrid Power and a Subtle Styling Refresh
Toyota is giving the 2027 Crown a light but meaningful update, keeping its unusual sedan-meets-crossover formula while adding a new...
Why a VIN Search Should Be Your First Step Before Buying a Used Car
Buying a used vehicle involves more than comparing prices and inspecting the exterior. A car may look well-maintained while still...
Test Drive: The Renault Twingo E-Tech
After the Renault Clio VI, we stay with the French manufacturer to now test drive the new Twingo E-Tech. The...
Our Review of the Goodwood Festival of Speed 2026
As we do most years, we attended this year’s Goodwood Festival of Speed 2026 on Sunday, 12 July. The weather...