
Sweden May 2026: Tesla (+70.6%), Kia (+23.7%) strong in stable market
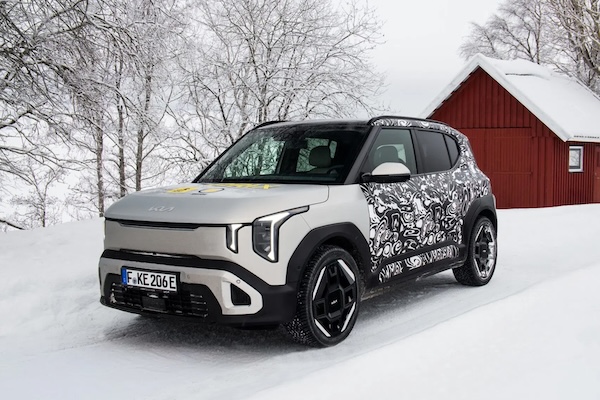
The new EV2 helps Kia up in Sweden this month.
25,985 new cars hit Swedish roads in May, a small 1.2% year-on-year improvement. The year-to-date tally is now down -1.2% to 112,092. BEV sales advance 13.2% to 10,718 and 41.2% share vs. 36.9% in May 2025 while PHEVs are down -1.8% to 6,645 and 25.6% share vs. 26.4% a year ago. This means rechargeable cars hold 66.8% of the Swedish market in May vs. 63.2% last year.
Local behemoth Volvo (+3%) remains by far the most popular carmaker at home wit 19.8% share, well above the 17% it commands year-to-date. Volkswagen (-8.5%) struggles but manages to stay in 2nd place above a surging Kia (+23.7%). Toyota (-2.2%) drops one spot on last month #4 with Skoda (+15%) very dynamic below. Tesla (+70.6%) is the best performer in the Top 10 but remains below its YTD level at 3.3% vs. 3.7%. Further down, Subaru (+542.9%), BYD (+353.9%), Citroen (+100%) and Fiat (+73.7%) all post surreal gains.
Over in the models ranking, the Volvo EX/XC40 (+34.2%) stays strong ahead of the Volvo XC60 (-0.9%) and cements its YTD leadership. The Tesla Model Y (+48%) is up seven spots on April to #3, a ranking it also holds year-to-date. The Volvo EX30 (+22.3%) is also sturdy at #4 thanks to the addition of the Cross Country version, and is also #4 year-to-date vs. #9 over the Full Year 2025. The Fiat Ducato (+70.5%) is the best performer in the Top 10, with the VW Tiguan (+23%), Skoda Kodiaq (+15.4%) and Volvo S/V60 (+12.3%) also solid. The Top 3 best-selling recent launches are Kias: the EV4 at #26, EV5 at #27 and EV2 at #30.
Previous month: Sweden April 2026: Toyota (+23.4%), Kia (+24.4%) stand out, Yaris at record ranking
One year ago: Sweden May 2025: Audi (+59.2%), Skoda (+43.8%) and Polestar (+39%) impress
Full May 2026 Top 57 All brands and Top 289 All models below.
Sweden May 2026 – brands:
PosBrandMay-26%/25Apr2026%/25PosFY251Volvo5,15019.8%+ 3.0%119,03117.0%– 10.0%112Volkswagen3,09911.9%– 8.5%213,43912.0%– 18.8%223Kia 2,2148.5%+ 23.7%48,8927.9%+ 19.6%444Toyota 2,0307.8%– 2.2%39,3208.3%+ 5.3%335Skoda 1,6446.3%+ 15.0%77,1876.4%+ 7.5%666Mercedes 1,4725.7%– 11.4%57,1986.4%+ 5.1%557BMW 1,4405.5%+ 11.6%66,8776.1%+ 13.1%778Audi 9083.5%– 47.5%85,3404.8%– 19.6%889Peugeot 8633.3%– 14.8%93,4683.1%– 16.7%10910Tesla8583.3%+ 70.6%134,1363.7%+ 57.0%91111Polestar6292.4%+ 2.6%122,8692.6%+ 10.1%111012Fiat 5422.1%+ 73.7%101,8491.6%+ 73.8%142013Cupra5192.0%– 10.5%112,7842.5%+ 4.3%121214Renault4361.7%+ 21.1%141,8611.7%+ 12.5%131315Lynk & Co4251.6%+ 17.4%151,1601.0%+ 127.0%192716BYD3451.3%+ 353.9%199050.8%+ 131.5%253317Ford 3201.2%– 34.2%161,5361.4%– 28.5%151418Subaru 3151.2%+ 542.9%211,4161.3%– 47.4%161719Hyundai 3101.2%+ 3.3%201,3001.2%– 8.5%171520Dacia2841.1%+ 9.7%251,0791.0%– 9.3%211821Opel 2350.9%+ 61.0%249460.8%+ 29.6%232222Citroen 2240.9%+ 100.0%229450.8%+ 117.7%242823Lexus2050.8%– 6.4%239990.9%+ 7.4%222124Nissan 1980.8%– 45.8%181,2161.1%– 18.5%181625Porsche1750.7%– 38.6%178180.7%– 35.6%261926Seat1700.7%– 44.1%286620.6%– 7.2%272427Mazda 1580.6%+ 10.5%271,1081.0%+ 47.9%202328Zeekr1140.4%– 4.2%265970.5%+ 26.5%282929Xpeng1080.4%+ 1.9%304040.4%– 0.7%323130Suzuki 1070.4%+ 2.9%334630.4%+ 8.2%293031MG1010.4%– 24.6%294340.4%– 20.7%312532Mini 870.3%– 7.4%314540.4%– 22.5%302633Honda 750.3%– 5.1%323400.3%– 15.6%333234Leapmotor530.2%new351200.1%new364935Land Rover410.2%– 16.3%343210.3%+ 30.5%343436Mitsubishi320.1%– 28.9%361500.1%+ 4.9%353537Smart190.1%+ 533.3%37810.1%+ 268.2%374138Jeep100.0%+ 233.3%46440.0%– 22.8%394039Ferrari80.0%+ 0.0%43330.0%+ 37.5%423940Alpine60.0%+ 500.0% –60.0%+ 200.0%536341Geely60.0%– 60.0%48440.0%+ 57.1%384242DS50.0%+ 150.0%38350.0%+ 133.3%404443Lotus50.0%– 16.7%39260.0%+ 23.8%444644Chevrolet 40.0%– 42.9%42200.0%– 41.2%453745Skywell40.0%new –80.0%new51 –46Alfa Romeo30.0%– 50.0%45260.0%– 51.9%433847Bentley30.0%n/a4790.0%+ 200.0%495548Cadillac30.0%+ 200.0%5290.0%+ 125.0%506549DFSK30.0%– 25.0%53130.0%+ 0.0%485050Lamborghini30.0%+ 0.0%44190.0%– 5.0%464551Iveco20.0%– 50.0%40140.0%+ 27.3%475452Maserati20.0%n/a –20.0%+ 0.0%606153Morgan20.0%+ 0.0% –40.0%– 42.9%555854Omoda20.0%new –20.0%new61 –55Aston Martin10.0%+ 0.0% –30.0%+ 0.0%565956McLaren10.0%+ 0.0%5060.0%– 33.3%545657SsangYong10.0%+ 0.0%5180.0%+ 300.0%5247 –Others60.0%– 45.5% –150.0%– 34.8% – –
Sweden May 2026 – models:
PosModelMay-26%/25Apr2026%/25PosFY251Volvo EX/XC401,6346.3%+ 34.2%16,1285.5%+ 49.9%122Volvo XC601,5656.0%– 0.9%25,5024.9%– 31.4%213Tesla Model Y6722.6%+ 48.0%103,4973.1%+ 61.4%344Volvo EX306582.5%+ 22.3%42,7712.5%+ 38.8%495VW ID.76492.5%– 25.8%82,6102.3%– 29.2%536Volvo S/V605952.3%+ 12.3%141,7241.5%– 23.7%1287Skoda Kodiaq5172.0%+ 15.4%62,3732.1%+ 14.0%668VW Tiguan5021.9%+ 23.0%52,2742.0%+ 29.0%7119Fiat Ducato4981.9%+ 70.5%71,6621.5%+ 72.8%133210Kia EV34961.9%– 14.6%111,8731.7%– 4.9%9511Toyota Yaris4311.7%+ 37.7%31,8471.6%+ 32.8%101912VW ID.44231.6%+ 4.4%151,4891.3%– 24.5%141013Kia Sportage4101.6%+ 78.3%261,3301.2%+ 28.3%171814Polestar 43921.5%+ 3.2%122,0921.9%+ 53.7%81215Peugeot 30083311.3%– 24.6%211,1831.1%– 11.4%222216Skoda Enyaq3181.2%– 13.6%171,3571.2%– 27.2%161417Toyota Corolla3101.2%– 13.6%201,3161.2%– 15.7%181718BMW IX33021.2%+ 1158.3%131,0100.9%+ 637.2%27 n/a19VW Golf2921.1%+ 61.3%251,4221.3%– 17.9%152820Volvo XC902811.1%+ 21.6%657310.7%– 21.4%473821VW Passat2661.0%– 18.4%161,2571.1%– 30.7%201322Toyota Yaris Cross2651.0%– 24.5%91,8321.6%+ 36.0%111523BMW IX12571.0%+ 87.6%181,0280.9%+ 189.6%264924Volvo EC/C402471.0%– 31.6%241,0781.0%– 16.0%252925Peugeot 20082460.9%– 5.0%319840.9%– 28.9%302526Kia EV42360.9%new197490.7%new4414627Kia EV52340.9%new401,2761.1%new1921028Mercedes CLA2170.8%+ 87.1%231,0801.0%+ 80.6%244529Mercedes GLB2150.8%+ 258.3%227420.7%+ 253.3%4511630Kia EV22120.8%new693270.3%new93 –31Lynk & Co 082120.8%new335580.5%new6012232Toyota Corolla Cross2120.8%– 27.9%341,1031.0%– 12.7%232433Mercedes GLC2040.8%+ 13.3%419980.9%+ 66.6%294834Kia EV92000.8%– 3.8%289810.9%+ 22.3%323735Lynk & Co 011990.8%– 22.9%365330.5%+ 40.3%649336Toyota RAV41990.8%– 40.4%465600.5%– 65.4%58737Audi A51970.8%+ 87.6%448830.8%+ 154.5%365538VW T-Roc1960.8%– 35.7%309200.8%– 29.6%341639Cupra Terramar1890.7%+ 9.9%379820.9%+ 12.2%313640Tesla Model 3 1850.7%+ 285.4%1806250.6%+ 39.8%506041Toyota bZ4X1840.7%+ 76.9%391,2381.1%+ 197.6%219542VW Taigo1820.7%+ 145.9%835870.5%+ 33.4%555943Mercedes E Class1810.7%– 38.6%297870.7%– 33.1%422744Skoda Superb1800.7%+ 91.5%528030.7%+ 121.8%406445Peugeot 50081690.7%– 3.4%279620.9%+ 22.4%333446BYD Seal U1670.6%+ 142.0%324790.4%+ 86.4%7010547Skoda Elroq1670.6%+ 9.2%644800.4%+ 12.7%696548Dacia Sandero1590.6%+ 12.0%906050.5%– 6.8%534449Polestar 21590.6%+ 4.6%635040.4%– 47.2%673150Skoda Octavia1580.6%+ 29.5%547410.7%– 15.5%463551Renault 51550.6%+ 28.1%508640.8%+ 274.0%376352BMW 1-Series1540.6%+ 381.3%617840.7%+ 208.7%437853VW Tayron1460.6%– 42.3%358590.8%+ 26.7%384254Skoda Fabia1420.5%+ 129.0%574920.4%+ 41.4%688355Subaru Outback1360.5%+ 13500.0%389090.8%– 45.4%354356Audi A31350.5%– 66.4%479990.9%– 23.2%282357BYD Seal1300.5%+ 4233.3%1532570.2%+ 375.9%10822358BMW 5-Series1280.5%– 25.6%458530.8%– 30.9%393359Cupra Formentor1240.5%+ 55.0%735500.5%+ 65.7%618760Mercedes GLE1230.5%+ 46.4%585590.5%+ 30.9%596661BMW X11200.5%– 0.8%536150.5%– 11.3%526962Cupra Leon1160.4%+ 12.6%626290.6%+ 35.9%495863Toyota C-HR+1160.4%new763180.3%new97 –64Ford Transit1140.4%+ 14.0%603790.3%+ 27.2%839665Audi Q51120.4%+ 250.0%795390.5%+ 64.8%638466Kia EV61110.4%– 35.1%486030.5%– 11.5%544067Skoda Kamiq1090.4%– 19.9%896210.6%+ 30.2%517368Audi A6 e-tron1020.4%– 71.7%665180.5%– 37.9%664169VW ID.Buzz1010.4%+ 40.3%723580.3%– 1.9%897470Zeekr 7X1010.4%+ 17.4%425230.5%+ 444.8%659471Opel Frontera1000.4%+ 614.3%1172730.2%+ 1850.0%10414372VW ID.31000.4%– 42.2%784740.4%– 64.9%712173Subaru Uncharted990.4%newn/a1040.1%new165 –74BMW X5980.4%– 21.0%953620.3%– 24.4%877775Kia Niro980.4%– 10.1%495680.5%– 4.2%574776Mercedes Sprinter970.4%+ 12.8%753080.3%+ 5.8%989977Nissan Qashqai970.4%– 43.6%516510.6%+ 21.7%485678Audi Q6 e-Tron950.4%– 45.1%594660.4%– 39.6%735779Toyota Aygo X930.4%+ 190.6%824100.4%+ 192.9%8113680Toyota bZ4X Touring930.4%new –930.1%new171 –81Seat Arona900.3%– 59.8%1672530.2%– 44.8%1097982Toyota C-HR870.3%– 67.8%854500.4%– 55.0%783083Hyundai Tucson860.3%+ 56.4%684510.4%+ 14.2%768584BMW i4820.3%– 29.9%924460.4%– 26.4%796285Citroen C3 Aircross820.3%+ 82.2%803340.3%+ 581.6%9113186Opel Mokka810.3%+ 2.5%743600.3%– 20.5%887687Mercedes V Class800.3%+ 185.7%1382170.2%+ 14.2%12113288Lexus RZ790.3%+ 229.2%1032520.2%+ 460.0%11019989Hyundai Kona770.3%+ 35.1%1521460.1%– 46.7%14211890Lexus NX770.3%– 27.4%1003290.3%– 30.0%927191BMW X3760.3%– 33.3%1104550.4%– 13.7%755092Mercedes EQA760.3%– 37.7%437980.7%+ 35.9%414693Kia Sorento750.3%– 27.9%874640.4%+ 46.4%748294BMW i5720.3%– 50.3%844500.4%– 24.5%775495Dacia Duster720.3%– 23.4%862830.3%– 32.5%1038896Porsche 911720.3%– 2.7%672990.3%+ 7.6%10011097Xpeng G6720.3%– 7.7%1022390.2%– 11.8%11410898Citroen C5 Aircross710.3%+ 1675.0%983760.3%+ 1780.0%8419299Renault Captur690.3%+ 165.4%1201510.1%– 39.6%139137100Seat Leon690.3%– 11.5%773210.3%+ 34.9%94103101Audi A6680.3%– 70.2%705810.5%– 17.7%5652102Polestar 3660.3%+ 37.5%1212180.2%+ 4.3%120107103BMW 3-Series640.2%– 54.3%933560.3%– 39.9%9061104Audi Q7630.2%+ 162.5%1331830.2%+ 47.6%128167105VW Multivan630.2%– 36.4%1072690.2%– 36.0%10686106Hyundai Ioniq 5610.2%+ 74.3%1311510.1%+ 0.0%138157107Ford Puma 600.2%+ 252.9%1161990.2%+ 0.0%124145108Mercedes C Class600.2%– 52.8%1132380.2%– 50.8%11570109Audi Q4 E-Tron590.2%– 73.5%814710.4%– 55.5%7239110Cupra Tavascan590.2%– 28.9%882100.2%– 61.3%12375111MG 4590.2%+ 126.9%1012520.2%+ 142.3%111133112Kia Stonic580.2%+ 123.1%913700.3%+ 143.4%86111113Renault Scenic570.2%– 5.0%943060.3%– 1.3%9990114VW Touareg570.2%+ 72.7%1082660.2%+ 123.5%107158115Ford Tourneo Custom550.2%+ 0.0%1301360.1%– 36.7%147150116Renault 4550.2%new1261850.2%new126177117Skoda Karoq530.2%+ 15.2%973200.3%+ 27.0%96100118Mazda 6e520.2%new1282880.3%new101165119Audi Q3500.2%– 12.3%565470.5%+ 5.8%6272120Porsche Cayenne500.2%– 45.1%1092330.2%– 38.2%11680121Volvo EX90480.2%– 67.6%553210.3%– 32.7%9551122Suzuki Vitara470.2%+ 62.1%1411790.2%+ 20.1%129123123Mercedes A Class460.2%– 53.5%1054260.4%+ 273.7%80121124Renault Master450.2%+ 73.1%1321410.1%– 5.4%143152125BYD Sealion440.2%new208770.1%new183325126BMW iX430.2%– 10.4%1142160.2%– 1.4%122101127Kia Picanto430.2%– 10.4%962470.2%+ 2.9%112113128Peugeot 208420.2%– 51.7%1551050.1%– 65.5%163102129Subaru Crosstrek420.2%+ 4100.0%1691600.1%– 55.3%135126130VW T-Cross 420.2%– 46.2%1152190.2%– 39.3%11997131Hyundai Ioniq 9400.2%new1541220.1%new151209132Toyota Proace City390.2%new2301070.1%new161363133VW Caddy380.1%+ 22.6%1121850.2%+ 35.0%127127134Renault Clio370.1%+ 12.1%1041240.1%– 50.4%150141135Citroen C4360.1%– 23.4%1451080.1%– 54.2%160115136Lexus LBX350.1%+ 75.0%1232200.2%+ 33.3%118129137Mini Hatch350.1%+ 12.9%1191920.2%– 14.7%125106138Mercedes GLA330.1%– 26.7%1062460.2%– 0.8%113119139Xpeng G9330.1%+ 22.2%1351490.1%+ 14.6%140144140Dacia Bigster320.1%new1561170.1%new153185141Leapmotor B10320.1%new146740.1%new190288142Cupra Born310.1%– 73.3%714090.4%+ 22.8%8268143Hyundai Santa Fe310.1%– 11.4%1661110.1%– 24.0%157151144Ford Explorer300.1%– 66.7%993720.3%+ 29.6%8591145Porsche Macan300.1%– 65.1%1111760.2%– 61.0%13181146Mitsubishi Outlander290.1%n/a1251390.1%n/a144188147Nissan Juke290.1%– 42.0%1291580.1%– 27.2%136120148Mercedes CLE280.1%– 26.3%150730.1%– 57.8%191142149Nissan X-Trail280.1%+ 16.7%1401700.2%+ 6.9%134160150Mazda2270.1%+ 237.5%172680.1%+ 17.2%193206151Mini Aceman270.1%+ 22.7%1611140.1%– 24.0%155112152Nissan Micra270.1%new206920.1%new172 –153Peugeot Expert270.1%+ 285.7%1871010.1%+ 288.5%169232154Mazda CX-60260.1%– 54.4%1602850.3%+ 4.4%10292155Suzuki Swift260.1%– 33.3%174970.1%– 34.0%170140156Kia K4 SW250.1%new274260.0%new233 –157Mini Countryman250.1%– 39.0%1391480.1%– 29.9%141135158Fiat 600240.1%+ 33.3%1221260.1%+ 38.5%149156159Peugeot 408240.1%+ 700.0%216350.0%– 82.0%221174160Subaru Solterra240.1%– 48.9%1641390.1%+ 25.2%145203161Honda CR-V230.1%– 20.7%219530.0%– 65.1%204161162Mercedes EQE230.1%– 73.6%1431740.2%– 72.6%13267163VW Crafter230.1%– 34.3%165830.1%– 22.4%180164164Mercedes GLS220.1%– 12.0%186890.1%– 16.0%174154165Mercedes Vito220.1%– 24.1%1241090.1%+ 23.9%159173166Range Rover 220.1%– 12.0%1341570.1%+ 7.5%137149167Dacia Jogger210.1%– 8.7%171740.1%– 38.8%189168168Ford Capri200.1%– 9.1%1921050.1%+ 56.7%162182169Honda HR-V200.1%– 28.6%1361370.1%+ 21.2%146176170Mazda CX-80200.1%– 63.0%1761770.2%– 20.3%130117171Peugeot 308200.1%– 42.9%163770.1%– 28.7%184193172Suzuki S-Cross200.1%+ 185.7%1701030.1%+ 114.6%167196173Citroen Jumper190.1%+ 171.4%184520.0%+ 79.3%205229174Opel Corsa190.1%+ 18.8%2071030.1%+ 35.5%166153175VW Caravelle190.1%n/a1511150.1%+ 82.5%154175176Fiat Grande Panda180.1%new202540.0%new201 –177MG S5 EV170.1%+ 750.0%227420.0%+ 2000.0%212231178BMW IX2160.1%– 65.2%1491310.1%– 19.6%148138179Kia PV5160.1%new175760.1%new185230180Ford Kuga150.1%– 65.9%1272220.2%– 40.5%11798181Leapmotor C10150.1%new178380.0%new217282182Mercedes G Class150.1%– 37.5%179750.1%– 37.5%188169183Lynk & Co 02140.1%– 86.5%158690.1%– 47.3%192162184Mazda CX-30140.1%– 17.6%1591700.2%+ 42.9%133170185Subaru Forester140.1%n/a1981040.1%– 81.4%164104186Land Rover Defender130.1%+ 8.3%1481220.1%+ 110.3%152200187Mazda CX-5130.1%n/a137830.1%+ 8200.0%177364188MG HS130.1%+ 30.0%220580.1%– 71.1%197166189Honda Jazz120.0%+ 33.3%185540.0%– 14.3%203186190Renault Trafic120.0%+ 100.0%222510.0%+ 24.4%206212191Audi Q2110.0%– 68.6%223660.1%– 35.3%194159192Audi Q8110.0%– 80.4%189750.1%– 75.5%186114193Ford Transit Custom110.0%– 60.7%193540.0%– 38.6%202171194Honda ZR-V110.0%+ 120.0%203390.0%+ 56.0%215221195Seat Ibiza110.0%+ 450.0%168880.1%+ 417.6%175220196Volvo ES90110.0%new1182710.2%new105228197Zeekr 001110.0%– 47.6%183620.1%– 34.0%196181198Mercedes AMG100.0%– 70.6%234250.0%– 56.1%236 n/a199Mercedes EQS100.0%– 23.1%215550.0%– 40.9%200184200Nissan Primastar100.0%+ 900.0%173830.1%+ 361.1%178247201Porsche Panamera100.0%+ 11.1%194460.0%– 29.2%209187202Porsche Taycan100.0%– 9.1%188420.0%– 14.3%213189203Smart #3100.0%+ 400.0%257180.0%+ 100.0%245270204Suzuki e Vitara100.0%new236260.0%new235 –205Citroen C390.0%+ 0.0%233260.0%– 73.2%232197206BMW X780.0%– 52.9%261260.0%– 42.2%230202207Honda Civic80.0%+ 14.3%191500.0%+ 28.2%207211208Hyundai i2080.0%– 52.9%142820.1%+ 24.2%181163209Jeep Compass80.0%n/a273150.0%n/a249 –210Lexus RX80.0%– 68.0%157810.1%+ 15.7%182183211Polestar 580.0%new228300.0%new225 –212Smart #580.0%new229260.0%new234258213Citroen Jumpy70.0%n/a201400.0%n/a214291214MG 370.0%+ 16.7%211420.0%+ 180.0%211179215Nissan Ariya70.0%– 93.9%205620.1%– 88.8%19589216BMW 2-Series60.0%– 89.5%200560.0%– 74.5%199124217Ford Tourneo Connect60.0%– 70.0%218320.0%– 39.6%224215218Leapmotor T0360.0%new –80.0%new267342219Lexus UX 60.0%– 57.1%196890.1%+ 32.8%173190220Mercedes Citan60.0%– 81.8%182750.1%– 22.7%187180221Range Rover Velar60.0%+ 200.0%281170.0%+ 54.5%246256222Renault Rafale60.0%– 83.3%244390.0%– 38.1%216178223BMW 4-Series50.0%– 50.0%212270.0%+ 8.0%228235224DS 750.0%+ 150.0%217290.0%+ 107.1%226240225Hyundai Bayon50.0%– 70.6%2041130.1%+ 91.5%156191226MG S6 EV50.0%new144370.0%new219 –227Alpine A29040.0%new –40.0%new288 –228Audi e-Tron GT40.0%+ 300.0% –60.0%– 40.0%277265229BMW Z440.0%+ 300.0%232120.0%+ 33.3%255284230Ford Mustang40.0%– 20.0%241240.0%+ 26.3%238244231Ford Mustang Mach-E40.0%– 92.7%27090.0%– 90.2%264216232Lotus Emira40.0%– 20.0%24290.0%+ 50.0%265322233Mazda MX540.0%n/a226160.0%+ 300.0%247280234Opel Astra40.0%+ 0.0%279140.0%– 73.1%252222235Opel Movano40.0%n/a243330.0%n/a223251236Polestar YSM40.0%– 87.9%197250.0%– 69.1%237201237Skywell BE1140.0%new –80.0%new270 –238Suzuki Swace40.0%– 83.3%282580.1%+ 3.6%198207239Alfa Romeo Junior30.0%+ 0.0%237260.0%– 31.6%229225240BMW X630.0%+ 200.0%231180.0%+ 50.0%243242241Cadillac Lyriq30.0%+ 200.0%26270.0%+ 600.0%273338242Chevrolet Corvette30.0%+ 0.0% –30.0%– 82.4%303224243Ferrari Purosangue30.0%+ 50.0%26790.0%+ 28.6%263272244Mercedes EQB30.0%– 97.6%2101110.1%– 76.5%15853245Peugeot Rifter30.0%– 50.0% –130.0%+ 0.0%254250246Porsche 71830.0%– 78.6%177220.0%– 56.9%241214247Xpeng P730.0%+ 200.0%199160.0%+ 166.7%248264248Alpine A39020.0%new –20.0%new307 –249Bentley Bentayga20.0%n/a26030.0%+ 200.0%302336250BYD Atto 220.0%new181440.0%new210 –251BYD Atto 320.0%n/a224220.0%+ 2100.0%240324252DFSK 60020.0%new –40.0%new291352253Ferrari20.0%– 33.3%240120.0%+ 33.3%256254254Fiat Ulysse20.0%new –70.0%new275 –255Hyundai i1020.0%– 94.4%252340.0%– 78.1%222109256Iveco Daily20.0%– 50.0%213130.0%+ 30.0%253281257Jeep Avenger20.0%+ 0.0%245180.0%– 66.7%244219258Lamborghini Urus20.0%+ 100.0%246120.0%+ 9.1%257257259Maserati20.0%n/a –20.0%+ 0.0%319307260Mazda320.0%– 66.7%209210.0%– 38.2%242227261Mitsubishi ASX20.0%– 90.0% –50.0%– 90.0%286226262Morgan20.0%+ 0.0% –40.0%– 42.9%297303263Volvo S/V9020.0%– 99.4%195830.1%– 95.2%17920264Zeekr X20.0%– 83.3%284120.0%– 95.7%259147265Aston Martin Valhalla10.0%new –10.0%new322 –266Audi A810.0%– 50.0% –30.0%+ 0.0%301310267Bentley Flying Spur10.0%n/a –20.0%+ 100.0%308349268BMW 7-Series10.0%+ 0.0%24950.0%– 16.7%283293269BMW XM10.0%+ 0.0% –90.0%+ 28.6%262271270CHEVROLET AMBULANS10.0%– 75.0%238140.0%– 6.7%251 –271DFSK 50010.0%– 50.0% –70.0%+ 250.0%274302272Ferrari 29610.0%+ 0.0% –20.0%– 50.0%312267273Ferrari 849 Testarossa10.0%new –10.0%new329 –274Ferrari Amalfi10.0%new –30.0%new304 –275Ford Tourneo Courier10.0%n/a –10.0%n/a331341276Honda Prelude10.0%new –70.0%new276 –277Lamborghini Revuelto10.0%new27520.0%new317 –278Lotus Emeya10.0%n/a –20.0%+ 0.0%318292279McLaren10.0%+ 0.0%25560.0%– 33.3%279295280Mitsubishi Colt10.0%– 95.0%27860.0%– 92.6%280217281Omoda 510.0%new –10.0%new334 –282Omoda 910.0%new –10.0%new335 –283Opel Grandland X10.0%– 96.7%2211020.1%– 20.3%168128284Opel Zafira10.0%– 50.0%28020.0%– 33.3%321304285Peugeot Boxer10.0%– 50.0%24780.0%– 27.3%268255286Smart #110.0%+ 0.0%162370.0%+ 184.6%220283287Ssangyong Torres10.0%+ 0.0%25880.0%+ 300.0%271329288Tesla Model S10.0%n/a –60.0%– 25.0%281259289Toyota Proace Verso10.0%– 94.1%147380.0%– 54.8%218213
Source: Mobility Sweden


More Stories
2026 Ford Ranger Lariat 4×4 FX4 Off-Road Review & Test Drive
The Ford Ranger has, in a way, made a sneaky climb into the mid-sized truck segment to be a formidable...
UK May 2026: Vauxhall Frontera breaks into Top 10
The Vauxhall Frontera ends May in 9th place. New car sales in the UK gain 7.1% year-on-year in May to...
Bulgaria May 2025: Renault Megane surprise leader, Dongfeng Shine up to #6
The Renault Megane is the best-selling vehicle in Bulgaria in May. The Bulgarian new car market are up 11.7% year-on-year...
Romania May 2026: MG and BYD break records
The MG ZS breaks into the Romanian Top 10 for the first time in May. New car sales in Romania...
Russia May 2026: Toyota and Jaecoo surge
Toyota sales more than double year-on-year despite not being officially present in Russia. New car sales in Russia advance 20.5%...
Ford Explorer Invoice Price: What Dealers Pay vs. What They Charge
If you are shopping for a 2026 Ford Explorer, you already know it is one of the most popular and...