
Taiwan May 2026: Toyota Corolla Cross, RAV4 and Tesla Model Y dominate
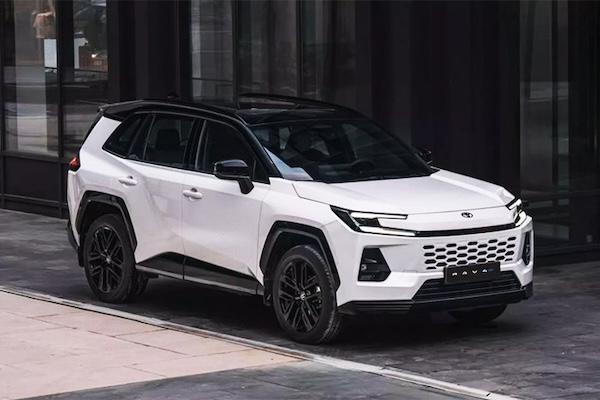
Toyota RAV4 sales are up 49.5% in May.
33,076 new cars hit Taiwanese roads in May, a 3.7% year-on-year improvement. This is still a poor performance as May 2025 was off -23.1% on the year prior. The year-to-date tally is now off -2.3% to 160,917. Toyota (+10.2%) outpaces the market to reach a round 30% share, in line with the 30.9% it commands year-to-date. Sister brand Lexus (-3.9%) stays in 2nd place while Tesla surges (+804.1%) is up 9-fold to land at #3 with 6.4% share. CMC (-21.4%) and Mercedes (-5.2%), both in difficulty, follow. Mazda (+27.2%), Mitsubishi (+19.6%) and Honda (+8.8%) also shine below.
Over in the models charts, the Toyota Corolla Cross (+30%) is a distant leader at 11.8% share ahead of the Toyota RAV4 (+49.5%) now invigorated by its new generation. The Tesla Model Y (+3235.8%) shoots up to #3 and now ranks #4 year-to-date vs. #6 over the Full Year 2025. The CMC J Space (-25.5%) is knocked down to #4 while the Toyota Yaris Cross (+15.8%) rounds out the Top 5. The Honda HR-V (+593.1%) catches up on lost time at #8 but the CR-V (-91.3%) craters and falls outside the Top 70. Finally it’s another Top 10 finish for the new Ford Territory at #9.
Previous month: Taiwan April 2026: Toyota RAV4, Mercedes CLA among best performers
One year ago: Taiwan May 2025: Market off -23.1%, Toyota Alphard cracks Top 10
Full May 2026 Top 10 brands and Top 70 models below.
Taiwan May 2026 – brands:
PosBrandMay-26%/25Apr2026%/24PosFY251Toyota9,90930.0%+ 10.2%149,69730.9%– 3.3%112Lexus2,5007.6%– 3.9%211,5707.2%– 15.5%223Tesla1,7815.4%+ 804.1%n/a7,2204.5%+ 141.0%684CMC1,7735.4%– 21.4%39,0675.6%– 17.6%435Mercedes1,7325.2%– 5.2%47,8294.9%– 29.7%556Mazda1,4744.5%+ 27.2%105,8473.6%+ 17.8%1097BMW1,4404.4%– 12.0%85,3833.3%– 26.7%1178Mitsubishi1,3784.2%+ 19.6%76,8144.2%+ 26.8%8109Honda1,3384.0%+ 8.8%99,3275.8%+ 17.8%3410Hyundai1,3204.0%– 27.7%66,7874.2%– 9.5%96n/aKia9943.0%– 0.7%n/a3,5422.2%– 22.5%n/an/an/aFord9773.0%– 0.5%56,9474.3%+ 34.4%7n/a
Taiwan May 2026 – models:
PosModelMay-26%/25Apr2026%/24PosFY251Toyota Corolla Cross3,91711.8%+ 30.0%118,10011.2%+ 8.1%112Toyota RAV41,8305.5%+ 49.5%29,5395.9%+ 9.8%223Tesla Model Y1,7685.3%+ 3235.8%n/a6,3203.9%+ 283.7%464CMC J Space1,2163.7%– 25.5%36,5334.1%– 16.8%335Toyota Yaris Cross1,0903.3%+ 15.8%55,1733.2%– 20.1%756Lexus NX1,0763.3%+ 18.4%75,3033.3%+ 0.3%677Toyota Town Ace9712.9%– 22.3%64,8953.0%– 31.0%848Honda HR-V9082.7%+ 593.1%84,5392.8%+ 140.4%999Ford Territory8572.6%new45,5793.5%new56310Mazda CX-57732.3%+ 68.4%232,4851.5%+ 58.7%141311Toyota Corolla Altis6462.0%– 1.7%93,1752.0%– 15.7%10812Lexus RX5651.7%+ 39.5%122,5971.6%– 1.0%121413Mitsubishi Delica5091.5%– 12.1%102,5151.6%– 11.2%131114Mitsubishi Xforce4891.5%new132,4591.5%new15n/a15Nissan Kicks4671.4%– 5.3%112,1311.3%+ 13.1%161716Toyota Camry4151.3%+ 30.1%152,1111.3%+ 27.7%172517Lexus ES4141.3%+ 162.0%n/a7740.5%– 9.0%424418Mercedes GLC Class3891.2%– 24.5%171,9461.2%– 47.6%181219Hyundai Porter3771.1%+ 6.8%191,6801.0%+ 4.0%212320Mazda CX-303391.0%+ 79.4%391,3020.8%+ 23.2%283521Kia Sportage3381.0%+ 65.7%411,0850.7%– 16.0%352722Kia Stonic3010.9%n/a57n/an/an/an/an/a23Mercedes GLE Class2940.9%+ 27.8%64n/an/an/an/a5524Nissan Sentra2860.9%+ 12.6%321,2760.8%– 3.7%293225Hyundai Venue2820.9%+ 37.6%261,3040.8%– 0.1%273126BMW X32670.8%– 24.8%201,1830.7%#VALUE!32n/a27Honda Fit2640.8%– 32.3%281,6901.1%– 12.7%202128Suzuki Swift2620.8%+ 24.8%161,3290.8%+ 8.9%252829Foxtron Bria2570.8%new221,3880.9%new24 –30Toyota Vios2390.7%– 15.2%251,5050.9%– 20.5%222231Suzuki Jimny2220.7%+ 2.8%301,2060.7%#VALUE!31n/a32Hyundai Custin2170.7%+ 13.0%291,3070.8%– 8.5%263033Lexus UX2070.6%– 45.4%241,2690.8%– 38.8%301834Mercedes E Class2050.6%– 5.1%378710.5%– 16.8%404135Nissan X-Trail1920.6%+ 19.3%331,1390.7%– 15.4%342436MG HS1890.6%– 10.8%458140.5%– 37.8%413437Toyota Sienna1780.5%+ 4.1%46n/an/an/an/an/a38MG G50 Plus1770.5%n/a361,1440.7%n/a33n/a39Hyundai Mufasa1690.5%– 35.2%389010.6%+ 245.2%384040Fuso Canter1660.5%– 25.6%426930.4%– 30.9%453941VW Tiguan1650.5%– 15.4%506400.4%n/a47n/a42BMW 2 Series1590.5%+ 3.2%584980.3%– 19.2%n/a5243Mercedes CLA Class1550.5%+ 229.8%14n/an/an/an/a6544Hyundai Tucson1510.5%– 77.2%349470.6%– 53.6%361945Lexus LBX1500.5%– 50.0%359290.6%– 26.9%373746Toyota bZ4X1500.5%+ 435.7%181,7881.1%+ 1244.4%19n/a47MG ZS1420.4%– 7.2%407480.5%+ 70.0%434748BMW iX1410.4%n/an/an/an/an/an/an/a49Toyota Alphard1400.4%– 78.4%447380.5%– 60.6%442950BMW X61370.4%n/a43n/an/an/an/an/a51Mazda31340.4%– 50.9%278860.6%– 29.1%393352BMW X11200.4%n/an/an/an/an/an/an/a53VW Golf1180.4%– 61.2%634770.3%n/an/an/a54Mercedes GLA Class1150.3%n/a48n/an/an/an/a3855VW T-Cross1090.3%n/an/an/an/an/an/an/a56Mazda CX-601070.3%– 15.1%31n/an/an/an/a5457Suzuki Carry1060.3%n/a60n/an/an/an/an/a58Honda Civic1050.3%+ 110.0%n/a4760.3%+ 47.8%n/a6259Mitsubishi Colt Plus1030.3%– 41.1%615730.4%– 37.3%494360VW T-Roc990.3%n/a47n/an/an/an/an/a61CMC Veryca960.3%– 20.7%526030.4%+ 12.9%485362Mercedes V Class900.3%– 48.9%694640.3%– 35.5%n/a5863Volvo XC40900.3%n/an/an/an/an/an/an/a64BMW 1 Series880.3%+ 18.9%654660.3%– 33.6%n/a5065Mercedes C Class860.3%– 6.5%684090.3%– 29.7%n/a5966BMW 3 Series820.2%– 13.7%67n/an/an/an/a6067Kia Picanto780.2%– 57.8%544910.3%n/an/an/a68Skoda Octavia760.2%– 39.2%555580.3%– 22.6%n/a4569Volvo EX30750.2%– 68.8%704060.3%n/an/an/a70Toyota Crown730.2%+ 23.7%535710.4%+ 37.9%5061
Source: u-car.com.tw


More Stories
Netherlands May 2026: Kia Picanto, Tesla Model Y and Model 3 on top
The Kia Picanto is the best-selling vehicle in the Netherlands in May. The Dutch new car market edges up 1.1%...
Iceland May 2026: Smart #5 and BMW iX3 inside Top 10
The Smart #5 is up to 6th place in April. It’s another difficult month for the Icelandic new car market,...
Italy May 2026: Leapmotor T03 threepeats at #3, BYD Atto 2 up to #5
The Leapmotor T03 ranks #3 again in Italy. New car sales in Italy grow by a very healthy +7.6% year-on-year...
Spain May 2026: BYD (+85.7%) breaks records at 4% share
The BYD Atto 2 is up to a record 13th place in April. The Spanish new car market is uncharacteristically...
2027 Toyota GR86 Gets Sharper Without More Power and That’s Perfectly Fine
Toyota is giving enthusiasts another reason to appreciate one of the last affordable rear-wheel-drive sports cars on the market. Unveiled...
How Dangerous U.S. Intersection Design Can Lead to Legal Claims Beyond Driver Fault
Image Source When a crash happens at an intersection, the instinct is often to assign blame to one of the...