
Italy May 2026: Leapmotor T03 threepeats at #3, BYD Atto 2 up to #5
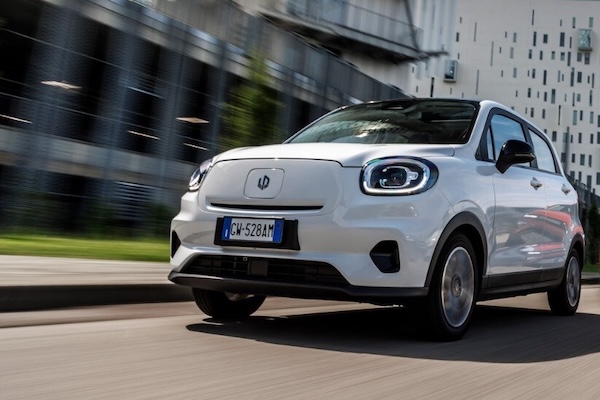
The Leapmotor T03 ranks #3 again in Italy.
New car sales in Italy grow by a very healthy +7.6% year-on-year in May to 150,096. This is the best May result since pre-pandemic 2019 (197,876). The year-to-date tally is now up a robust 9.4% to 790,301. Encouragingly, private sales are up 15.7% to 80,485 and 53.1% share vs. 49.6% a year ago (+11.2% to 52.6% share YTD). Self registrations drop -3% to 16,038 and 10.6% share vs. 11.8% in May 2025 (+13.5% to 9.7% share YTD), long term leases are down -1.6% to 32,213 and 21.2% share vs. 23.3% (down -3.5% to 21.2% share YTD), short term rentals are up 13.6% to 14,843 and 9.8% share vs. 9.3% (up 35.8% to 11.3% share YTD) and company sales are off -4.2% to 8,080 and 5.3% vs. 6% (up 0.3% to 5.1% share YTD).
HEV sales soar 16.5% to 71,392 and 47.1% share vs. 43.7% a year ago, including 24,216 full hybrids (+34.4%) and 47,176 mild hybrids (+9%). PHEVs surge 71% to 15,433 and 10.2% share vs. 6.4% in May 2025 and BEVs shoot up 86.2% to 13,305 and 8.8% share vs. 5.1% last year. As a result rechargeable vehicles are up 77.7% to 28,738 and 19% share vs. 11.5% a year ago. Year-to-date, BEV sales are up 75.4% to 64,720 and 8.1% share vs. 5.1% over the first 5 months of 2025.
Looking at the brands ranking, Fiat (+27.4%) continues to recover year-on-year but at 10.1% share it delivers its lowest level so far this year, to be compared with 11.7% YTD. Volkswagen (+1%) overtakes Toyota (-7%) but the latter stays at #2 year-to-date. Excellent result for Dacia (+18.6%) up one spot on last month to #4 and Audi (+19.7%) up three to #5 for the second time this year after last February. BYD (+209.5%) is up 3-fold year-on-year and breaks into the Top 10 for the second time ever at #9, also hit last December. The Chinese carmaker sports a new volume record (6,019, previous best 5,193 last March) and share record (4%, previous best 3.1% last December). Leapmotor (+1277.2%) is up three spots on April to #13.
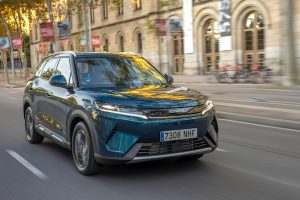
Model-wise, the Fiat Panda (+9.4%) outpaces its home market, climbing back up to 6% share vs. 5.5% last month. The Dacia Sandero (+23.5%) is up two spots to #2 but remains at #5 year-to-date. It’s a third consecutive month at a record third place for the Leapmotor T03 (+1739.8%), available from an incredible €4,900 after subventions and manufacturer rebates. Below a struggling Jeep Avenger (-15.1%), the BYD Atto 2 (+6717.9%) spectacularly breaks into the Top 5 at #5, with a previous best of #16 reached last March and for only its 4th appearance inside the Italian Top 50. The Fiat Grande Panda (+764.5%) recedes once again month-on-month to #9, after reaching #3 last February. It still ranks #3 year-to-date. Finally, notice the Fiat 500 (+1625.8%), not EV-only anymore, back up to #19 which is its highest ranking since June 2024.
Previous month: Italy April 2026: Leapmotor T03 repeats at #3, MG ZS up to record #5
One year ago: Italy May 2025: Jeep Avenger repeats at #2, Peugeot 208 up to record #3
Full May 2026 Top 58 All brands and Top 50 models below.
Italy May 2026 – brands:
PosBrandMay-26%/25Apr2026%/25PosFY251Fiat15,19710.1%+ 27.4%192,67711.7%+ 29.7%112Volkswagen10,8577.2%+ 1.0%353,8686.8%+ 2.4%333Toyota10,3196.9%– 7.0%254,9777.0%– 1.1%224Dacia9,2956.2%+ 18.6%539,5875.0%– 15.2%445Audi7,5355.0%+ 19.7%836,6324.6%+ 18.2%786Peugeot7,2484.8%– 16.1%437,8204.8%– 12.2%557Renault6,9244.6%– 10.9%637,3074.7%+ 5.0%668BMW6,7174.5%– 1.9%734,2474.3%+ 3.7%879BYD6,0194.0%+ 209.5%1423,4463.0%+ 208.5%142110MG5,3603.6%+ 24.7%1126,8603.4%+ 6.8%111311Citroen5,0483.4%– 3.3%1028,9503.7%– 2.0%101112Jeep4,9613.3%– 16.1%930,9343.9%– 3.9%9913Leapmotor4,7653.2%+ 1277.2%1620,9082.6%+ 1584.8%163214Mercedes4,4733.0%– 6.4%1225,5903.2%+ 6.3%121215Kia4,4272.9%+ 27.7%1722,4412.8%+ 15.8%151516Ford4,1322.8%– 40.1%1324,7933.1%– 23.1%131017Omoda+Jaecoo3,9752.6%+ 302.3%1816,8202.1%+ 322.3%202518Opel3,6142.4%+ 0.5%1520,2022.6%+ 6.8%171719Skoda3,3432.2%– 10.1%1918,5042.3%+ 10.5%181620Suzuki2,7441.8%+ 1.5%2113,8661.8%– 5.6%221921Hyundai2,5491.7%– 40.9%2015,7462.0%– 25.1%211422Cupra2,2761.5%– 2.4%2210,5491.3%+ 12.3%242223Nissan2,0971.4%+ 1.3%2417,4962.2%+ 0.7%191824Alfa Romeo1,7891.2%– 27.9%2311,3621.4%– 20.3%232025Mini1,7151.1%+ 22.7%258,1541.0%+ 27.3%252426Volvo1,4741.0%+ 27.1%266,7110.8%+ 8.2%262627Honda1,2440.8%+ 45.7%275,7810.7%+ 46.4%282928DR Motor1,1100.7%– 45.1%285,0560.6%– 33.0%302329Mazda9540.6%– 0.2%306,2440.8%+ 31.0%272830EMC8370.6%+ 183.7%382,6530.3%+ 138.8%363831Tesla6540.4%– 23.5%375,4950.7%+ 15.2%292732Seat6510.4%+ 8.0%313,9050.5%– 9.9%323133Lexus6330.4%+ 3.4%362,8530.4%– 1.7%353634Land Rover5630.4%– 1.1%323,1720.4%– 9.0%333435Porsche5580.4%– 10.3%352,5860.3%– 11.7%373336Geely5530.4%new342,0130.3%new38 –37Lancia5350.4%– 16.3%294,6640.6%+ 0.3%313038EVO5270.4%+ 26.1%333,1040.4%+ 9.6%343539DFSK2950.2%+ 181.0%401,3420.2%+ 184.3%404340DS2300.2%– 58.9%391,7830.2%– 27.8%393741Ich-X2220.1%+ 692.9%535630.1%+ 446.6%46n/a42Subaru1970.1%– 31.4%411,2290.2%+ 15.3%423943KGM1890.1%+ 509.7%439680.1%+ 554.0%435044Lynk & Co1880.1%+ 652.0%448640.1%+ 390.9%444545Sportequipe1340.1%– 31.3%421,2930.2%+ 47.1%414046SWM1140.1%+ 58.3%455780.1%+ 143.9%45n/a47Maserati1110.1%– 20.7%474570.1%– 41.3%494148Ferrari1050.1%+ 36.4%464700.1%+ 25.3%484449Mitsubishi950.1%– 22.8%502640.0%– 64.0%524250Lamborghini600.0%+ 13.2%483430.0%+ 38.3%504851Polestar590.0%+ 84.4%522740.0%+ 75.6%514952Alpine540.0%+ 28.6%492000.0%+ 58.7%53n/a53Smart520.0%+ 0.0%541620.0%– 54.0%544654Tiger370.0%– 11.9%514860.1%+ 291.9%47n/a55Lotus150.0%– 48.3%55800.0%– 34.4%555156Aston Martin100.0%+ 42.9%56580.0%+ 5.5%565357Jaguar10.0%– 90.9% –50.0%– 97.2%575258Mahindra00.0%– 100.0% –10.0%– 99.8%5847 –Others2560.2%+ 120.7% –9080.1%+ 32.9% – –
Italy May 2026 – models:
PosModelMay-26%/25Apr2026%/25PosFY251Fiat Panda8,9656.0%+ 9.4%154,5976.9%– 0.4%112Dacia Sandero4,4042.9%+ 23.5%417,8232.3%– 26.0%523Leapmotor T034,2502.8%+ 1739.8%319,0972.4%+ 1848.6%4n/a4Jeep Avenger4,0042.7%– 15.1%224,7633.1%+ 1.5%235BYD Atto 23,8182.5%+ 6717.9%289,6481.2%+ 6084.6%24n/a6Peugeot 2083,7282.5%– 0.1%714,7121.9%– 22.7%987Citroen C33,4072.3%+ 5.4%817,7152.2%– 24.3%648Toyota Yaris Cross3,3192.2%– 2.4%1115,6112.0%– 2.1%859Fiat Grande Panda2,9742.0%+ 764.5%619,8672.5%+ 2204.8%33710Toyota Aygo X2,8141.9%+ 12.2%915,8742.0%+ 60.9%71411Renault Captur2,6911.8%+ 18.5%1413,2971.7%+ 10.8%121312VW T-Roc2,6441.8%+ 5.9%1013,2451.7%+ 11.3%131113Toyota Yaris2,5561.7%– 15.1%1313,1251.7%– 20.4%14614Renault Clio2,5161.7%– 21.5%1214,5941.8%+ 10.5%10915MG ZS2,3241.5%– 10.4%514,0901.8%– 4.0%111016VW T-Cross2,2871.5%+ 12.2%1511,8241.5%+ 14.5%161717Dacia Duster2,2191.5%– 33.5%1912,8731.6%– 25.0%15718Audi Q32,1681.4%+ 183.0%2310,3951.3%+ 89.4%234019Fiat 5002,1401.4%+ 1625.8%317,8221.0%+ 764.3%29n/a20Kia Sportage2,1021.4%+ 39.1%2110,5641.3%+ 20.0%212021Ford Puma2,0991.4%– 31.3%1611,5951.5%– 9.3%171222MG 32,0961.4%+ 140.6%388,3731.1%+ 13.2%283123VW Tiguan2,0501.4%– 9.6%2510,7801.4%+ 0.8%191524BMW X11,8381.2%– 8.1%2410,7271.4%+ 11.0%201625Opel Corsa1,7581.2%+ 0.8%1711,0471.4%– 9.5%181826Peugeot 20081,7431.2%– 24.5%189,2931.2%– 13.3%252127Dacia Spring1,4471.0%+ 510.5%n/a3,4980.4%+ 40.6%n/an/a28Audi A31,4250.9%– 13.8%n/a5,6210.7%– 21.8%402529VW Golf1,4190.9%+ 16.2%336,9170.9%– 1.1%332930Omoda 51,3660.9%n/a306,9060.9%n/a34n/a31Suzuki Swift1,2980.9%+ 30.3%426,3830.8%+ 35.9%373532Kia Picanto1,2530.8%– 0.2%326,9880.9%+ 22.1%313033Toyota C-HR1,2140.8%– 2.2%297,5341.0%– 7.2%302434Hyundai Tucson1,1360.8%– 11.9%376,7850.9%+ 11.9%353235Mercedes GLA1,1020.7%– 1.6%355,5620.7%– 0.9%413336Nissan Qashqai1,0810.7%– 0.6%3910,4441.3%+ 16.3%222237Citroen C3 Aircross1,0790.7%n/a266,6430.8%n/a36n/a38Audi Q51,0640.7%+ 146.9%504,2090.5%+ 48.7%n/an/a39BMW X31,0560.7%+ 11.7%404,8690.6%+ 40.5%474740Peugeot 30081,0320.7%– 43.5%348,3951.1%+ 6.8%272341Skoda Fabia1,0120.7%– 4.2%n/a5,3580.7%+ 5.5%423642Alfa Romeo Tonale9620.6%+ 7.2%43n/an/an/an/a3943Jeep Compass9610.6%+ 59.9%225,7750.7%+ 47.6%39n/a44Jaecoo 79400.6%n/a41n/an/an/an/an/a45Suzuki Vitara9060.6%+ 8.4%n/a4,8920.6%– 0.2%464146Opel Mokka8910.6%+ 4.3%n/an/an/an/an/an/a47MG HS8750.6%n/an/an/an/an/an/an/a48Fiat 6008680.6%– 69.1%208,7691.1%– 25.8%261949Hyundai i208380.6%n/an/an/an/an/an/an/a50Cupra Leon8350.6%n/an/an/an/an/an/an/an/aMercedes GLC8300.6%n/a494,5690.6%+ 556.5%50n/an/aFord Kuga7730.5%– 25.6%365,0300.6%– 6.9%4543n/aBYD Seal U7690.5%– 52.4%276,9740.9%+ 22.8%3226n/aSkoda Kamiq7560.5%– 26.1%n/a4,7490.6%– 3.1%4838n/aNissan Juke7550.5%– 1.8%n/a5,3560.7%– 17.4%4334n/aAudi A16730.4%– 21.0%455,0440.6%+ 17.4%4446n/aAlfa Romeo Junior6200.4%– 49.0%445,9710.8%– 18.4%3828n/aLancia Ypsilon5320.4%– 16.7%464,6580.6%+ 0.2%4944
Source: UNRAE
More Stories
Spain May 2026: BYD (+85.7%) breaks records at 4% share
The BYD Atto 2 is up to a record 13th place in April. The Spanish new car market is uncharacteristically...
2027 Toyota GR86 Gets Sharper Without More Power and That’s Perfectly Fine
Toyota is giving enthusiasts another reason to appreciate one of the last affordable rear-wheel-drive sports cars on the market. Unveiled...
How Dangerous U.S. Intersection Design Can Lead to Legal Claims Beyond Driver Fault
Image Source When a crash happens at an intersection, the instinct is often to assign blame to one of the...
McLaren Artura 1000GP by MSO Honors 1,000 Formula 1 Starts with Exclusive Monaco-Inspired Design
The connection between McLaren’s success on the racetrack and its road-going supercars has always been a defining part of the...
Gas Price Shock Could Add More Than $700 to Drivers’ Annual Fuel Bills
For millions of Americans already feeling the pressure of higher living costs, the latest surge in fuel prices is creating...
UK to Worldwide Car Shipping Made Easy with Ascope Shipping
Ascope Shipping has been helping people ship vehicles from the UK to destinations across the world for over 15 years,...