
Belgium April 2026: Audi up to #2 in stable market
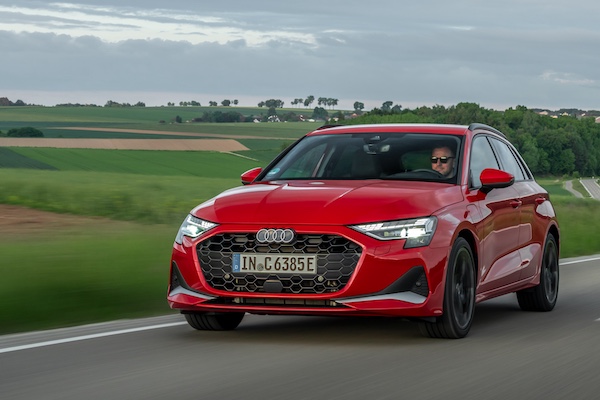
Audi hits its highest Belgian ranking in 2.5 years.
Stable volumes in Belgium in April at -0.03% year-on-year to 37,802 units. The year-to-date tally remains in negative at -4.5% to 151,607. No surprise at the top of the brands charts: BMW (+0.3%) leads again but falls from 14.2% share in March to 10% now. Audi (+27.5%) advances to #2 with 8.7% share vs. 6.7% so far this year. It lodges the biggest YoY gain in the Top 10 and hits its highest ranking since January 2024. Renault (+12.3%), Volvo (+2.6%) and Skoda (+0.7%) also end the month in positive in the remainder of the Top 10. Below, MG (+145.6%), BYD (+95.3%), Mini (+54.8%) and Tesla (+46.3%) stand out.
Previous month: Belgium March/Q1 2026: BMW X1 stays #1, VW T-Roc up to #3
One year ago: Belgium April 2025: Peugeot (+129.9%) stands out once again in negative market
Full April 2026 Top 70 All brands ranking below.
Belgium April 2026 – brands:
PosBrandApr-26%/25Mar2026%/25PosFY251BMW3,79210.0%+ 0.3%116,45110.9%– 12.1%112Audi3,2988.7%+ 27.5%310,2116.7%+ 1.9%443Volkswagen3,0878.2%– 13.0%213,6509.0%– 7.6%224Mercedes2,5676.8%– 6.6%510,7587.1%– 8.8%335Peugeot2,5526.8%– 3.6%49,8386.5%+ 10.1%576Renault2,2135.9%+ 12.3%69,3606.2%– 8.4%667Dacia1,8945.0%– 32.3%77,9045.2%– 21.2%758Skoda1,7014.5%+ 0.7%87,0684.7%+ 14.0%899Volvo1,5584.1%+ 2.6%145,1903.4%– 14.6%111010Toyota1,4543.8%– 19.8%96,5394.3%– 20.4%9811Kia1,3783.6%+ 4.6%125,4743.6%– 13.4%101112Hyundai1,1943.2%+ 28.7%164,0702.7%– 16.6%161213Opel1,1293.0%+ 10.3%134,8453.2%+ 26.5%121614Ford 1,0942.9%– 4.6%114,4682.9%– 11.7%141315Citroen1,0822.9%+ 10.4%154,4442.9%+ 1.1%151416Mini9262.4%+ 54.8%172,9201.9%+ 14.8%171817MG8572.3%+ 145.6%182,6201.7%+ 80.9%181918Tesla8342.2%+ 46.3%104,5353.0%+ 26.4%131519BYD5761.5%+ 95.3%192,1711.4%+ 96.5%192220Fiat4201.1%+ 28.0%211,7441.2%+ 39.9%212421Cupra3871.0%– 33.5%231,2530.8%– 24.6%242522Nissan3590.9%– 61.4%202,1141.4%– 43.5%201723Land Rover3240.9%– 36.0%278770.6%– 48.2%272024Jeep3220.9%+ 34.7%241,0230.7%+ 19.5%252925Mazda3020.8%+ 3.1%221,4571.0%+ 22.2%222626Seat2370.6%– 38.1%348840.6%– 47.6%262727Suzuki2370.6%– 47.5%251,3560.9%– 20.9%232128Xpeng2300.6%+ 75.6%317520.5%+ 86.1%313329Honda1940.5%+ 54.0%268360.6%+ 18.2%283030Porsche1750.5%– 45.5%298330.5%– 32.3%292331Omoda1670.4%+ 279.5%336180.4%+ 586.7%333932KG Mobility1630.4%+ 136.2%375010.3%+ 82.8%353533Leapmotor1590.4%+ 106.5%287370.5%+ 242.8%323434Polestar1560.4%– 23.9%307930.5%– 22.3%302835Jaecoo1500.4%+ 341.2%355670.4%+ 861.0%343736Alfa Romeo1070.3%– 41.8%324790.3%– 29.5%363137Lexus910.2%– 38.5%403770.2%– 31.0%373238Smart830.2%+ 130.6%411840.1%+ 8.2%403839Zeekr710.2%new363080.2%new395840Alpine540.1%+ 20.0%421830.1%+ 38.6%414041DS440.1%– 62.7%393310.2%– 6.0%383642Mitsubishi280.1%+ 2700.0%381610.1%+ 16000.0%426743Ferrari210.1%– 12.5%45680.0%– 13.9%464344Lancia150.0%+ 25.0%44750.0%+ 25.0%454245Lynk & Co120.0%– 76.0%46780.1%+ 14.7%434146BAIC110.0%+ 175.0%55200.0%– 41.2%544647Forthing100.0%+ 11.1%57190.0%– 53.7%564848Subaru100.0%– 37.5%43770.1%+ 32.8%444549Lotus90.0%– 10.0%53370.0%– 47.9%504450Bentley80.0%– 38.5%52390.0%– 4.9%495051Lamborghini80.0%– 42.9%50410.0%+ 0.0%485252Maserati80.0%– 27.3%51560.0%+ 36.6%474753Aston Martin60.0%– 33.3%49300.0%– 25.0%515354Allied Vehicles50.0%– 44.4%48280.0%+ 16.7%525555NIO40.0%n/a54220.0%+ 2100.0%535956AMF30.0%n/a6470.0%– 22.2%636557DFSK30.0%– 50.0%6090.0%– 60.9%595658DR 30.0%new56180.0%new576259Livan30.0%+ 0.0%5890.0%– 59.1%605460Rolls-Royce30.0%– 25.0%68110.0%+ 22.2%586161Dongfeng20.0%+ 0.0%47200.0%+ 11.1%556062Sportequipe20.0%new6290.0%new617063Tiger20.0%new –30.0%new688364Tripod20.0%– 85.7% –90.0%– 81.6%624965Caterham10.0%– 66.7%6140.0%– 66.7%676466EVO10.0%new –60.0%new657867Koenigsegg10.0%n/a –10.0%n/a76 –68McLaren10.0%n/a6620.0%– 50.0%717169Seres10.0%n/a –10.0%n/a80 –70Voyah10.0%n/a6330.0%+ 50.0%6980
Source: Febiac

More Stories
Ford F-150 Overland Capacity: What Actually Matters When You’re Packing for the Backcountry!
Overland Builds Live and Die by How Well You Use Your Roof Ask ten F-150 owners what “overland ready” means...
How Much Does It Cost to Rent an Exotic Car in Houston?
Exotic rentals in Houston run anywhere from $800 to $2,500 per day, and the spread comes down to what’s in...
In-Car Cameras Are Now Required in Europe as Driver Monitoring Debate Heads Toward the U.S.
New vehicles sold in the European Union are now required to include advanced driver-distraction warning technology, and for many models...
2026 Cadillac CT5 Pricing: The Last Luxury Sedan From a Legacy American Automaker
Edmunds said it plainly in their 2026 review: the CT5 is the last luxury sedan from a legacy American automaker,...
What Is BMW SmartView?
Your phone already does most of the heavy lifting when it comes to media, navigation, and apps. BMW SmartView is...
2026 Mazda CX-70 Invoice Pricing: Three Powertrains, a $3,000 Rebate, and 0.9% Financing
If you are shopping for a 2026 Mazda CX-70 and want to know what dealers are actually paying, what a...