
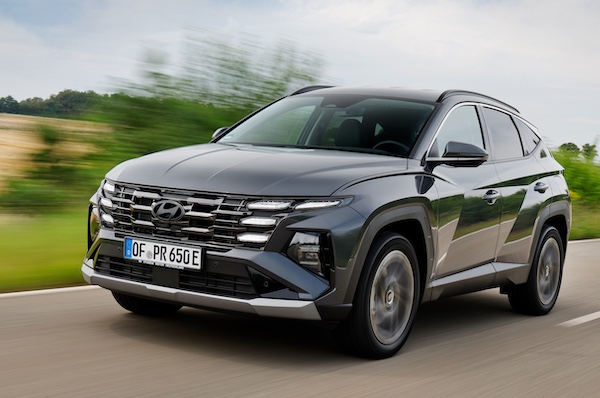
Ireland July 2025: Hyundai Tucson stays on top despite -37.6% fall
The Hyundai Tucson is the most popular vehicle in Ireland in July.
The biannual licence plate change traditionally brings stronger volumes and 2025 is no exception with 26,769 sales. This is 4.3% better than July 2024 and leads to a year-to-date tally up 3.7% to 108,513. Toyota (+0.8%) holds onto the brands top spot with 14.4% share but Volkswagen (+10.7%) is catching up at 13.7% of the market. Skoda (+19.8%) is the most dynamic on the podium and soars to 10.7% share vs. 9.6% so far this year. Hyundai (-3.5%) and Kia (-2.1%) follow and disappoint. Dacia (+27%) and Peugeot (+12.9%) also shine in the remainder of the Top 10. Below, Cupra (+136.9%) is up 21 spots on June to #13 and BYD is up 95% to #14.
Model-wise, the Hyundai Tucson (-37.6%) remains in the top spot despite a mediocre year-on-year evolution. The Skoda Octavia (+15.9%) is only 23 sales below and #2, distancing the Toyota Yaris Cross (-1.5%) and VW Golf (+50.8%). The Toyota Corolla (+11%) rounds out the Top 5 ahead of the Toyota RAV4 (-25.1%) in great difficulty. The Hyundai Kona (+5.4%) is the only additionally gainer in the Top 10 with the VW Tiguan (-31%), Kia Sportage (-22.3%) and Skoda Kodiaq (-12.4%) hit hard. There are 10 SUVs in the Top 12: add the VW ID.4 (+28.7%) and Toyota C-HR (-4.5%). The Hyundai Inster tops recent launches but is down 13 spots on last month to #17, it is above the VW Tayron at #20 (+1), the BYD Seal U at #22 (+5) and Kia EV3 at #23 (+14).
Previous month: Ireland June 2025: Tesla at 22.2% share, Smart #1 up to #3
One year ago: Ireland July 2024: 8 SUVs in Top 10, YTD volume now in negative
Full July 2025 Top 37 All brands and Top 239 All models below.
Ireland July 2025 – brands:
PosBrandJul-25%/24Jun2025%/24PosFY241Toyota3,86614.4%+ 0.8%515,29914.1%– 1.4%112Volkswagen3,65413.7%+ 10.7%612,74311.7%+ 8.4%223Skoda2,85310.7%+ 19.8%910,3769.6%– 0.9%434Hyundai2,81310.5%– 3.5%410,6279.8%+ 5.7%345Kia1,8947.1%– 2.1%28,3037.7%+ 9.9%556Dacia1,3004.9%+ 27.0%183,7833.5%+ 4.6%11117Peugeot1,0694.0%+ 12.9%294,0083.7%+ 3.6%8108Audi1,0373.9%– 5.4%174,0683.7%– 11.4%769Renault9833.7%+ 2.5%313,9323.6%+ 20.4%91210BMW9083.4%– 2.2%124,2283.9%+ 6.5%6811Ford6552.4%– 13.7%83,6183.3%– 1.8%12912Nissan6502.4%– 11.6%243,8533.6%– 18.8%10713Cupra5972.2%+ 136.9%341,7801.6%+ 50.6%182014BYD5442.0%+ 95.0%111,9601.8%+ 63.3%161915Mercedes5302.0%– 17.6%162,3672.2%– 12.4%131316Opel4951.8%– 1.4%192,0731.9%– 9.7%151617Volvo4651.7%+ 15.1%271,7171.6%+ 7.9%201818Citroen3141.2%+ 61.0%141,0060.9%+ 2.5%242219Seat3051.1%– 52.2%201,9561.8%– 25.0%171520Lexus3011.1%+ 50.5%251,1241.0%+ 41.0%232421Suzuki2791.0%– 22.5%72,0911.9%+ 16.8%141722MG2721.0%+ 37.4%151,2471.1%+ 34.4%222323Mazda2210.8%– 27.5%221,2591.2%+ 5.1%212124Tesla1860.7%– 8.4%11,7221.6%– 4.5%191425Land Rover1500.6%– 13.3%287600.7%– 9.1%252526Honda1080.4%+ 100.0%353650.3%+ 125.3%283027Mini840.3%– 45.8%215530.5%+ 30.4%262728Porsche610.2%– 7.6%263620.3%+ 22.7%292829Polestar530.2%+ 130.4%321160.1%– 20.0%342930Xpeng420.2%new371180.1%new33 –31Jeep200.1%+ 0.0%131840.2%+ 89.7%313232Alfa Romeo190.1%+ 216.7%23620.1%+ 44.2%353633DS140.1%– 65.9% –1220.1%– 5.4%323134Fiat110.0%– 92.3%105310.5%+ 0.4%272635Alpine90.0%n/a36200.0%+ 566.7%374236SsangYong60.0%– 33.3%30420.0%+ 7.7%363437Ineos10.0%#DIV/0!3350.0%+ 66.7%4040
Ireland July 2025 – models:
PosModelJul-25%/24Jun2025%/24PosFY241Hyundai Tucson8853.3%– 37.6%204,2253.9%– 12.4%112Skoda Octavia8623.2%+ 15.9%63,1152.9%– 19.8%323Toyota Yaris Cross7732.9%– 1.5%193,1732.9%+ 8.4%254VW Golf6922.6%+ 50.8%72,3082.1%+ 17.2%10115Toyota Corolla6482.4%+ 11.0%172,5032.3%– 4.2%676Toyota RAV46402.4%– 25.1%153,0732.8%– 3.0%447Hyundai Kona6062.3%+ 5.4%332,3372.2%+ 5.1%888Kia Sportage5972.2%– 22.3%52,9842.7%– 10.4%539VW Tiguan5852.2%– 31.0%252,3232.1%– 0.9%9610Skoda Kodiaq5572.1%– 12.4%512,3642.2%+ 23.8%7911VW ID.45382.0%+ 28.7%301,7101.6%+ 33.2%152112Toyota C-HR5332.0%– 4.5%341,9021.8%– 4.4%111213Toyota Yaris5262.0%– 3.8%261,8961.7%– 14.3%121014VW T-Roc5051.9%– 9.0%731,7451.6%+ 2.4%141515Dacia Sandero4851.8%– 11.2%551,5451.4%– 16.5%171316Toyota Corolla Cross4711.8%+ 79.8%291,8351.7%+ 14.5%131417Hyundai Inster3991.5%new47990.7%new37 –18Dacia Duster3971.5%+ 23.7%601,3851.3%+ 12.2%192419Peugeot 30083881.4%+ 9.6%1131,5611.4%+ 36.1%162520VW Tayron3861.4%new218550.8%new30 –21Skoda Karoq3531.3%+ 26.1%541,2611.2%+ 2.1%222322BYD Seal U3471.3%new271,0641.0%new2518223Kia EV33201.2%new371,0701.0%new2422124VW Polo3041.1%– 24.9%1171,3491.2%– 7.2%212025Skoda Elroq2871.1%new694840.4%new72 –26Peugeot 20082811.0%+ 25.4%1397190.7%– 22.5%453327Nissan Qashqai2781.0%+ 6.9%1731,5351.4%– 19.3%181628Peugeot 50082761.0%+ 98.6%1741,0140.9%+ 34.7%284029Dacia Bigster2510.9%new763160.3%new95 –30Nissan Juke2430.9%– 6.9%1111,3551.2%– 28.7%201731Kia Sorento2330.9%– 19.9%658480.8%+ 29.5%314132Hyundai Ioniq 52320.9%+ 70.6%895120.5%+ 15.3%687333Ford Puma2300.9%– 28.3%181,1971.1%– 14.1%231934Hyundai i202250.8%– 48.3%641,0401.0%– 20.1%272235Skoda Enyaq2040.8%+ 482.9%576020.6%+ 21.1%566536Audi A32030.8%+ 34.4%837590.7%+ 12.8%433937Kia EV62000.7%+ 14.3%288320.8%+ 42.0%324738Skoda Fabia1960.7%+ 5.4%967540.7%+ 0.3%444239Audi A51790.7%+ 297.8%1496050.6%+ 143.0%5511340Kia Stonic1770.7%– 14.1%236460.6%– 2.9%504441VW T-Cross1760.7%– 26.7%1898120.7%+ 4.1%343842Cupra Formentor1750.7%+ 37.8% –5720.5%+ 5.7%595643Skoda Superb1680.6%+ 20.0%398100.7%+ 1.1%353544Volvo XC601680.6%+ 9.1%1875760.5%+ 0.3%585245Renault Clio1670.6%+ 30.5% –5500.5%– 2.7%635446Audi A61620.6%+ 35.0%466410.6%+ 10.3%514847Renault Symbioz1620.6%new –7610.7%new4217548BMW X11580.6%+ 95.1%356360.6%+ 52.9%526849Opel Grandland X1560.6%+ 169.0%564940.5%+ 80.3%7010550Renault Arkana1540.6%– 33.9% –6730.6%– 35.7%463151BMW 5-Series1530.6%– 7.3%478080.7%– 1.1%363752Renault 51520.6%new1432460.2%new113 –53VW ID.31520.6%+ 149.2%725140.5%– 1.9%666054Cupra Terramar1450.5%new1613120.3%new98 –55Ford Focus1430.5%– 34.7%98270.8%– 22.9%332856BMW X31420.5%+ 63.2%855230.5%+ 34.1%657757Opel Mokka1420.5%+ 10.1%1385650.5%– 10.3%605058Hyundai i101400.5%+ 50.5%1054870.4%+ 30.2%716759Toyota bZ4X1400.5%+ 29.6%1164380.4%+ 33.5%758760VW Taigo1380.5%+ 97.1%825130.5%+ 67.6%679661Skoda Kamiq1360.5%– 46.7%1156060.6%– 35.0%543262Renault Captur1330.5%– 55.5%1799260.9%+ 22.0%294363Cupra Leon1310.5%+ 77.0% –3300.3%+ 4.8%909164Dacia Jogger1300.5%– 17.2%484270.4%– 19.9%776265Tesla Model Y1300.5%– 22.2%26720.6%– 32.0%482666Kia Ceed1220.5%– 31.8%415890.5%– 25.8%573667Hyundai Santa Fe1210.5%+ 142.0%775320.5%+ 638.9%6411268Audi Q31200.4%– 61.8%746710.6%– 36.0%492969Kia Niro1200.4%– 45.2%167680.7%– 19.7%413070Suzuki Swift1200.4%– 25.0%426240.6%+ 53.7%536171Ford Kuga1160.4%– 42.9%327810.7%– 28.4%382772Opel Corsa1160.4%– 33.7%1375610.5%– 26.2%614573BMW X51130.4%– 42.9%1037800.7%+ 56.0%395974Cupra Born1060.4%+ 211.8%1212840.3%+ 17.4%10510675Toyota Aygo X1040.4%+ 13.0%713180.3%– 20.1%938076Volvo XC901030.4%+ 19.8%1473730.3%– 4.1%848377Hyundai Bayon1020.4%– 1.9%1243160.3%– 19.2%968178Lexus LBX1010.4%+ 1.0%1274150.4%+ 86.9%879879Suzuki Vitara1000.4%+ 44.9%85570.5%– 9.1%625180Lexus NX990.4%+ 350.0%664000.4%+ 52.1%809481BYD Seal960.4%– 20.7%863890.4%– 33.7%814982Citroen Multispace930.3%n/a751010.1%n/a163 –83Skoda Scala900.3%– 15.1%1823870.4%– 14.2%827184Volvo EX40880.3%new1861800.2%new130 –85Mercedes E Class870.3%– 31.0%1084380.4%– 9.7%746686Seat Arona870.3%– 67.2%1446720.6%– 25.9%473487Renault Megane860.3%+ 6.2% –1930.2%– 25.8%12810888BMW IX1840.3%+ 55.6%843100.3%– 8.8%1019289Mercedes GLC840.3%+ 3.7%1093770.3%+ 4.7%838890Seat Ateca830.3%– 18.6%384810.4%+ 6.9%736391VW ID.7810.3%– 1.2%973110.3%+ 55.5%10010492Audi Q5780.3%– 15.2%1193340.3%+ 3.1%887993MG HS770.3%+ 7600.0%942230.2%+ 537.1%11619994Nissan X-Trail750.3%– 12.8%1124210.4%– 0.5%787595Mercedes CLA740.3%+ 7.2%1312620.2%– 17.1%1079096MG ZS740.3%+ 76.2%673270.3%+ 84.7%9212597Audi Q2730.3%+ 69.8%1512150.2%+ 2.4%12011698Ford Tourneo720.3%+ 1700.0%223070.3%+ 1179.2%10217899Opel Astra720.3%– 10.0%453110.3%– 11.9%9989100Seat Leon710.3%+ 22.4%952610.2%+ 45.0%108119101Kia Picanto690.3%+ 91.7%793600.3%+ 7.1%8572102Audi Q4680.3%– 15.0%1002030.2%– 50.8%12574103Mazda CX-30650.2%+ 3.2% –2220.2%+ 9.4%117120104Citroen C4640.2%+ 137.0%592460.2%+ 23.0%112121105Peugeot 208630.2%– 33.0% –4050.4%+ 11.3%7986106BYD Sealion620.2%new1201570.1%new135 –107Mercedes GLA620.2%– 36.7% –3270.3%– 16.6%9178108Renault Austral610.2%– 52.0% –2890.3%– 44.0%10464109Ford Explorer590.2%new493340.3%new89167110Mercedes GLE590.2%+ 15.7%1341540.1%– 27.4%137117111Seat Ibiza590.2%– 58.2%535120.5%– 10.6%6955112Suzuki SX4 S-Cross590.2%– 16.9%137740.7%+ 69.4%4070113Audi A1580.2%+ 20.8%991710.2%+ 3.6%133128114Hyundai i30580.2%+ 28.9% –2080.2%+ 2.0%122122115BMW 3-Series570.2%– 51.7%582550.2%– 50.2%10958116Kia EV9560.2%– 6.7%782060.2%– 11.6%123103117Mercedes C Class560.2%+ 107.4%1072220.2%+ 146.7%118152118Range Rover Sport560.2%– 22.2%1783150.3%– 19.0%9782119Tesla Model 3560.2%+ 55.6%11,0501.0%+ 28.7%2618120Citroen C3550.2%+ 120.0%157600.1%– 47.8%184145121Citroen C5 Aircross540.2%+ 0.0%1602770.3%+ 16.9%106110122Nissan Ariya540.2%– 10.0%802410.2%+ 13.7%114115123Audi Q7490.2%+ 14.0%1012090.2%+ 171.4%121151124MG5490.2%+ 48.5%501000.1%– 9.9%164136125BMW 2-Series470.2%+ 9.3% –2160.2%+ 10.2%119107126Land Rover Defender470.2%+ 113.6%911340.1%+ 7.2%145138127BMW 1-Series450.2%+ 55.2% –2000.2%+ 18.3%126124128Hyundai Ioniq 9450.2%new –450.0%new194 –129Renault Scenic450.2%+ 4.7%1812050.2%+ 336.2%124174130Mazda2430.2%– 43.4% –1430.1%– 63.1%14385131Xpeng G6420.2%new1911180.1%new155 –132Polestar 4400.1%new176620.1%new183196133Cupra Tavascan390.1%new –2340.2%new115240134Lexus ES390.1%+ 14.7%1261260.1%+ 2.4%150140135BMW i4380.1%– 13.6%1021270.1%– 29.8%147123136Citroen Berlingo380.1%+ 2.7%311750.2%– 4.4%131111137Honda HR-V380.1%+ 3700.0% –1260.1%+ 12500.0%148229138MG3380.1%– 9.5%1351570.1%+ 227.1%136161139Dacia Spring370.1%n/a –1100.1%n/a159256140Mazda3370.1%+ 37.0% –1190.1%– 3.3%153143141Mini Cooper360.1%+ 414.3%443510.3%+ 219.1%86149142VW ID.5360.1%+ 56.5%1881110.1%+ 15.6%158150143Mini Countryman350.1%– 16.7%1101120.1%+ 7.7%156144144Volvo XC40350.1%– 14.6% –1340.1%– 44.2%146109145Mazda CX-80340.1%new1281030.1%new161234146Mercedes CLE Coupe340.1%– 15.0% –1500.1%+ 7.1%138135147BMW IX2330.1%+ 725.0%63640.1%+ 966.7%181211148Honda Jazz330.1%+ 83.3% –1070.1%+ 137.8%160165149Mazda CX-60330.1%+ 0.0%1061230.1%– 16.3%151130150Mercedes A Class330.1%+ 3200.0%1301490.1%+ 645.0%139207151Ford Capri320.1%new162980.1%new167 –152Lexus RX320.1%+ 0.0%1661210.1%– 12.3%152141153MG4320.1%– 60.0%244300.4%– 22.8%7657154Range Rover 290.1%– 38.3%1771460.1%+ 10.6%140139155Porsche Cayenne260.1%– 25.7%1141410.1%– 17.5%144126156VW ID.Buzz260.1%– 42.2%148460.0%– 31.3%193153156Toyota Prius250.1%– 35.9% –1190.1%– 12.5%154137157Volvo EX30250.1%– 71.6%1463170.3%+ 14.4%9495158Peugeot 308240.1%– 56.4% –790.1%– 50.9%171131159Peugeot 408240.1%– 29.4% –1440.1%– 54.6%14293160Renault Rafale230.1%– 52.1%180850.1%+ 77.1%169184161BYD Dolphin220.1%– 73.5%156990.1%– 62.5%166101162Audi Q8210.1%+ 16.7%153990.1%+ 102.0%165173163Lexus UX210.1%+ 75.0% –760.1%+ 49.0%174176164Volvo EX90210.1%new –550.1%new187272165Honda Civic180.1%+ 38.5% –690.1%+ 40.8%177172166Volvo C40/EC40180.1%– 18.2%145580.1%– 32.6%186155167VW T7180.1%+ 200.0%190790.1%+ 139.4%172195168Alfa Romeo Junior170.1%new98270.0%new213 –169BYD Atto 3170.1%– 77.3%122510.2%– 28.1%11184170Porsche Panamera170.1%– 29.2%141680.1%+ 70.0%178177171VW Touareg170.1%+ 0.0% –510.0%– 28.2%190166172Honda CR-V160.1%+ 14.3%164420.0%+ 5.0%196188173Audi Q6 e-tron140.1%+ 75.0%1521170.1%+ 1362.5%156214174DS 7120.0%– 50.0% –790.1%– 9.2%170156175Peugeot Rifter120.0%– 7.7% –660.1%– 35.3%180142176Fiat 600100.0%– 68.8%122770.1%+ 120.0%173186177Jeep Compass100.0%+ 150.0% –200.0%+ 0.0%227203178Mercedes AMG GT100.0%+ 233.3% –390.0%+ 225.0%198218179Alpine A29090.0%new –90.0%new247 –180Jeep Avenger90.0%– 35.7%101440.1%+ 144.1%141170181Lexus RZ90.0%new167240.0%new219 –182Mazda MX-590.0%– 43.8%168360.0%+ 5.9%203201183Opel Combo90.0%n/a68670.1%+ 1240.0%179248184Polestar 290.0%– 55.0%140460.0%– 67.6%192114185Porsche Macan90.0%n/a621020.1%n/a162208186Audi A780.0%– 27.3% –240.0%– 33.3%218194187BMW i580.0%– 33.3%154590.1%+ 15.7%185181188Mercedes GLB80.0%– 83.7%611630.2%+ 17.3%134129189Citroen C4 X70.0%+ 40.0%159280.0%+ 55.6%212198190Land Rover Discovery Sport70.0%– 50.0% –720.1%– 14.3%176156191Mini Clubman70.0%– 70.8%136370.0%– 43.9%201160192Volvo V6070.0%– 46.2% –240.0%– 7.7%221205193BMW 4-Series60.0%– 60.0% –510.0%– 17.7%189169194BMW XM60.0%+ 100.0% –440.0%+ 214.3%195228195Porsche 911/Carrera60.0%+ 500.0% –260.0%+ 85.7%214231196Range Rover Evoque60.0%– 50.0%142640.1%– 5.9%182168197Ssangyong Torres60.0%+ 50.0% –250.0%+ 316.7%216241198Mercedes V Class50.0%– 58.3% –370.0%+ 0.0%200193199Mercedes Vito Tourer50.0%n/a –100.0%n/a244 –200Seat Altea50.0%n/a –300.0%+ 7.1%211 –201BMW 7 Series40.0%– 20.0% –310.0%– 22.5%208192202BMW X240.0%– 63.6% –230.0%– 46.5%223183203BMW X740.0%– 42.9% –170.0%– 26.1%234215204Mini Convertible40.0%n/a172180.0%– 67.3%232180205Polestar 340.0%+ 33.3%17580.0%+ 166.7%252212206Toyota Land Cruiser40.0%n/a –250.0%n/a217 –207Audi e-Tron GT30.0%+ 200.0% –60.0%– 76.0%256209208BMW iX30.0%n/a155180.0%– 55.0%229206209Honda ZR-V30.0%– 62.5% –200.0%+ 150.0%226220210Mercedes EQA30.0%– 62.5% –350.0%– 39.7%205171211Mercedes S Class30.0%– 25.0% –310.0%– 27.9%210190212Porsche Taycan30.0%– 50.0% –250.0%– 62.7%215162213Range Rover Velar30.0%– 40.0% –210.0%– 22.2%225187214Alfa Romeo Giulia20.0%– 33.3% –90.0%– 30.8%246236215BMW Z420.0%+ 100.0% –80.0%+ 166.7%249249216DS 320.0%n/a –70.0%+ 0.0%254246217Land Rover Discovery20.0%+ 100.0% –80.0%– 27.3%250238218Mercedes T class20.0%– 75.0% –80.0%+ 0.0%251245219MG Cyberster20.0%new –100.0%new245 –220Mini Aceman20.0%new171350.0%new206 –221Audi Q8 E-Tron10.0%– 92.9% –60.0%– 93.2%257158222BMW 8 Series10.0%+ 0.0% –10.0%– 50.0%291266223Citroen Ami10.0%n/a156210.0%n/a224251224Citroen C110.0%– 50.0% –40.0%+ 100.0%262 –225Citroen Spacetourer10.0%– 50.0% –50.0%– 64.3%259225226Cupra Ateca10.0%– 94.1% –480.0%– 42.9%191154227Fiat 50010.0%– 97.7%111740.2%+ 15.2%132133228Ford Mustang Mach-E10.0%– 66.7%163140.0%– 17.6%239222229Ford Transit Custom10.0%+ 0.0%123180.0%+ 350.0%230253230Ineos Grenadier10.0%n/a9050.0%+ 66.7%260261231Jeep Renegade10.0%– 50.0%125180.0%+ 0.0%231226232Mercedes EQB10.0%– 90.9% –360.0%– 62.9%204147233Mercedes G Class10.0%+ 0.0% –110.0%+ 1000.0%243279234Mercedes GL-Class10.0%n/a –10.0%n/a292 –235Mercedes GLE Coupe10.0%n/a –40.0%n/a265 –236Mercedes GLS10.0%n/a –40.0%– 20.0%266243237Peugeot 50810.0%– 96.9% –180.0%– 78.3%233159238Toyota Proace10.0%n/a185150.0%n/a238278239Toyota Verso10.0%n/a –10.0%n/a293 –
Source: SIMI

More Stories
Trump Adds 50 Percent Tariffs on Canadian Goods as Auto Trade Fight Escalates
The trade fight between the United States and Canada is escalating again, and the auto industry is right in the...
U.S. Automakers Race to Remove Chinese Connected-Car Hardware as New Federal Rules Loom
The U.S. auto industry is entering another major supply-chain shift, and this one reaches deep into the electronics that make...
Portugal June 2026: Sales up 13.6%, Dacia and Tesla break volume records
Dacia posts its first 2,000+ sales month in Portugal. Another solid result for new car sales in Portugal, up 13.6%...
Cadillac CT5-V Blackwing Successor Reportedly Planned as Next-Gen Super Sedan Takes Shape
Cadillac’s CT5-V Blackwing may not be heading quietly into history after all. While the current-generation CT5-V Blackwing is set to...
What to Do if You Bought a Defective Vehicle
Buying a new car can be life-changing to some, but a major liability to others who unknowingly bought a lemon....
Greece June 2026: Toyota Yaris signs first win in 2 years, strongest market in 17 years
The Toyota Yaris is the best-seller in Greece for the first time since July 2024. New car sales in Greece...