
Italy July 2025: BMW up to record #5, Fiat Grande Panda finally lands in Top 50
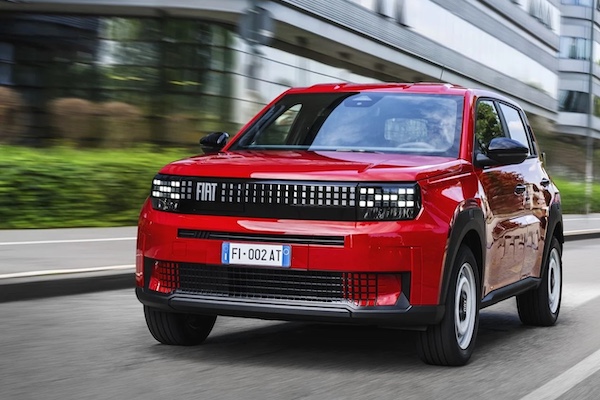
The Fiat Grande Panda is up to #28 at home in July.
Disappointing results for Italian new car sales in July: down -5.1% year-on-year to 118,493 units. Over the first 7 months of the year, the market is off -3.8% to 973,396 and down -21.3% or 263,000 units over the same period in pre-pandemic 2019. Looking at sales by channel, once again private sales drop faster than the market, a worrying sign as for the market’s health, at -13.5% to 67,470 and 56.4% share vs. 61.7% in July 2024 (52.2% vs. 55.8% YTD). Self registrations are up 5.7% to 17,841 and 14.9% share vs. 13.4% a year ago (10.7% vs. 11.4% YTD), long term leases grow 8.95 to 24,499 and 20.5% share vs. 17.8% last July (23.6% vs. 20.4% YTD), short term rentals gain 10.8% to 1,856 and 1.6% share vs. 1.3% last year (7.7% vs. 6.9% YTD) and company sales are up 9.3% to 8,053 and 6.7% vs. 5.8% in July 2024 (5.8% vs. 5.5% YTD).
As for power sources, petrol implodes -22.3% to 27,913 and 23.3% share vs. 28.4% a year ago (25.7% vs. 30% YTD), diesel is off -30.2% to 11,379 and 9.5% share vs. 12.9% last year (9.8% vs. 14.3% YTD), LPG is down -14.8% to 12,238 and 10.2% share vs. 11.4% in July 2024 (9.2% vs. 9.4% YTD) and HEVs as a whole are up 5.5% to 53,372 and 44.6% share vs. 40.1% a year ago (44.5% vs. 39% YTD). This includes 16,317 full hybrids (+12.7%) and 37,055 mild hybrids (+2.6%). PHEVs surge 81.9% to 8,918 and 7.5% share vs. 3.9% last year (5.6% vs. 3.3% YTD) and BEVs gain 37.2% to 5,898 and 4.9% share vs. 3.4% a year ago (5.2% vs. 3.8% YTD).
Fiat (+8.2%) reaches its best market share since last March at 9.3% and its biggest YoY gain since June 2024. The next three carmakers all fall faster than the market: Toyota is down -7.7% to 7.6% share, Dacia off -9.5% to 7.4% of the market and Volkswagen down -8.3% to 7%. Dacia reaches its highest share since last February. BMW (+5.2%) also defies the negative context and climbs to 5th place overall: the first time the German manufacturer breaks into the Italian Top 5. In the remainder of the Top 10, Peugeot (-24.2%), Renault (-23.8%), Jeep (-13.8%), Audi (-11.8%) and Ford (-7.9%) all suffer. Below, MG (+12.1%), Mercedes (+9.1%), Skoda (+6.6%) and Citroen (+4.3%) shine, with BYD (+873.8%) storming into the Top 20 for the first time at #19.
Model-wise, the Fiat Panda (+7.1%) perks up slightly to 6.6% share, accounting for 71% of the brand’s total volume for the month (75% YTD). Dacia places two models on the podium for the second month in a row and ever with the Sandero (-26.2%) at #2 and the Duster (+16.9%) at #3. The Jeep Avenger (+11%) is also in great shape and back up to #4. The Toyota Yaris Cross (-2.9%) limits its fall at #4 whereas the Renault Clio (-32.6%) craters at #6. The BYD Seal U celebrates one year in market by breaking its ranking record at #21. The event of the month as far as I’m concerned is the belated arrival within its home monthly Top 50 of the new Fiat Grande Panda at #28. This is thanks to the new hybrid variant as the EV model only accounts for 11% of the nameplate’s July volume. Hopefully for the brand the model will keep improving over the coming months.
Previous month: Italy June 2025: Devastated market (-17.4%), Dacia places two models on podium for the first time
One year ago: Italy July 2024: Fiat (-28.7%) sees its lowest ever share cut from 9.3% to 8.2%
Full July 2025 Top 52 All brands and Top 50 models below.
Italy July 2025 – brands:
PosBrandJul-25%/24Jun2025%/24PosFY241Fiat11,0619.3%+ 8.2%193,5359.6%– 11.6%112Toyota9,0357.6%– 7.7%274,6737.7%– 2.0%223Dacia8,7637.4%– 9.5%463,3646.5%+ 2.7%444Volkswagen8,2467.0%– 8.3%370,4837.2%– 5.4%335BMW6,0635.1%+ 5.2%645,7754.7%+ 6.0%776Renault5,7214.8%– 23.8%548,9195.0%– 10.2%657Audi5,5264.7%– 11.8%742,9774.4%– 4.1%8108Jeep4,9384.2%– 13.8%1141,8374.3%– 6.2%1099Peugeot4,8204.1%– 24.2%853,8135.5%+ 7.3%5610Ford4,7964.0%– 7.9%942,7864.4%– 2.4%9811Mercedes4,3603.7%+ 9.1%1033,7333.5%+ 11.1%121212Kia4,1803.5%– 12.2%1527,2852.8%– 9.4%151413Citroen3,7483.2%+ 4.3%1437,1463.8%– 13.2%111114MG3,7483.2%+ 12.1%1333,0363.4%+ 34.3%131615Hyundai3,7213.1%– 2.5%1229,1113.0%– 7.6%141316Skoda3,0632.6%+ 6.6%1722,8962.4%+ 2.6%171717Opel2,7392.3%– 34.3%1824,7282.5%– 17.0%161518Suzuki2,5572.2%– 21.4%1620,4672.1%– 13.6%191819BYD1,9671.7%+ 873.8%2311,5281.2%+ 1799.2%223720Alfa Romeo1,9531.6%+ 13.7%2018,7951.9%+ 35.3%202121Nissan1,8431.6%+ 2.4%1922,0912.3%– 9.1%181922DR Motor1,6861.4%+ 2.1%2211,3041.2%+ 2.8%232323Cupra1,4621.2%+ 21.5%2113,0431.3%+ 22.8%212424Omoda+Jaecoo1,4101.2%+ 1731.2%266,6910.7%+ 2821.8%273825Volvo1,2781.1%– 17.5%278,7630.9%– 28.5%252226Mini1,2411.0%+ 45.8%258,9840.9%+ 13.8%242727Mazda8290.7%– 35.4%286,5120.7%– 27.2%282628Honda8010.7%+ 25.7%295,5750.6%+ 17.7%303129Lancia8000.7%– 71.6%306,1680.6%– 77.6%292030Porsche7130.6%+ 28.9%324,2680.4%– 19.4%333031Land Rover6890.6%– 19.2%314,8320.5%– 24.9%322932Lexus5350.5%– 5.6%333,9860.4%+ 15.9%343333EVO4750.4%– 26.2%343,8320.4%– 2.0%353234Tesla4570.4%– 3.6%246,9250.7%– 34.7%262535Seat4380.4%– 39.8%355,2620.5%– 37.7%312836DS3510.3%– 9.5%363,2550.3%– 8.4%363437EMC2690.2%+ 142.3%381,6600.2%+ 117.3%374138Subaru2360.2%+ 138.4%371,6160.2%+ 84.3%384039Maserati1820.2%+ 13.0%401,2020.1%– 25.1%403940Mitsubishi1640.1%+ 0.0%391,1440.1%– 53.9%413541Sportequipe1370.1%+ 407.4%411,2150.1%+ 67.8%394342Smart1090.1%– 23.2%425670.1%– 75.4%443643DFSK1050.1%+ 133.3%n/a6600.1%+ 144.4%42n/a44SsangYong990.1%+ 200.0%462450.0%– 34.1%494745Ferrari960.1%– 11.9%455480.1%+ 4.4%454546Lynk & Co720.1%– 74.3%482680.0%– 67.0%484247Lamborghini540.0%+ 35.0%443840.0%+ 17.8%464648Polestar270.0%+ 92.9%432710.0%+ 131.6%474949Lotus230.0%– 41.0%471670.0%– 27.4%514850Mahindra180.0%+ 28.6%496210.1%+ 300.6%435051Aston Martin70.0%+ 0.0%50730.0%+ 17.7%525152Jaguar20.0%– 97.1%511850.0%– 73.5%5044 –Others8800.7%+ 266.7% –4,1920.4%+ 253.8% – –
Italy July 2025 – models:
PosModelJul-25%/24Jun2025%/24PosFY241Fiat Panda7,8606.6%+ 7.1%170,1697.2%– 1.7%112Dacia Sandero4,3713.7%– 26.2%232,0643.3%– 19.3%223Dacia Duster3,6513.1%+ 16.9%324,0692.5%+ 35.0%5124Jeep Avenger3,5193.0%+ 11.0%531,0273.2%+ 29.1%335Toyota Yaris Cross3,3342.8%– 2.9%722,0752.3%– 3.9%756Renault Clio2,5162.1%– 32.6%418,9331.9%– 15.9%1067Toyota Yaris2,4872.1%+ 13.6%621,7712.2%+ 10.2%888MG ZS2,2031.9%+ 6.0%919,4072.0%+ 9.5%9149Peugeot 2082,1661.8%– 5.0%1223,5092.4%+ 26.3%6710Ford Puma2,1161.8%– 2.9%1017,2081.8%– 1.8%111311VW T-Roc2,0541.7%– 15.3%1516,0271.6%– 17.6%131112Citroen C31,9821.7%– 16.9%1627,4582.8%– 4.5%4413Renault Captur1,9681.7%– 26.6%1416,0991.7%– 17.7%121014VW Tiguan1,9421.6%+ 19.1%1314,8261.5%+ 42.5%162115Kia Sportage1,8601.6%– 0.9%2212,1251.2%– 14.2%211816BMW X11,8261.5%+ 0.2%1113,8001.4%+ 17.3%192017VW T-Cross1,7831.5%– 9.4%1814,0521.4%– 6.1%171618Toyota Aygo X1,5201.3%– 21.4%813,9861.4%+ 0.3%181919Kia Picanto1,4881.3%+ 6.4%268,5760.9%+ 16.0%313420Fiat 6001,4701.2%+ 52.2%1715,2921.6%+ 560.8%14n/a21BYD Seal U1,4121.2%#######248,5870.9%+ 16737.2%30n/a22Opel Corsa1,4021.2%– 56.3%2115,1401.6%– 8.0%151523Hyundai Tucson1,1881.0%+ 8.0%458,1370.8%+ 12.9%323624Audi A31,1691.0%+ 21.1%259,7831.0%+ 21.4%253725Citroen C3 Aircross1,1471.0%+ 70.2%n/an/an/an/an/an/a26Hyundai i101,1140.9%– 13.2%209,0220.9%– 9.3%282627Peugeot 30081,1010.9%+ 20.2%2710,2731.1%+ 30.7%233928Fiat Grande Panda1,0820.9%newn/an/an/anewn/a –29Mercedes GLA1,0230.9%– 1.4%287,9060.8%– 2.0%342930Peugeot 20081,0200.9%– 54.7%2313,2411.4%– 17.8%201731Toyota C-HR1,0140.9%– 6.0%3310,2151.0%+ 12.5%242532Alfa Romeo Junior9900.8%new309,4401.0%new26n/a33Nissan Qashqai9680.8%+ 21.2%1911,8431.2%– 13.4%222234Suzuki Swift9650.8%+ 23.2%296,8400.7%+ 26.1%404335Jeep Compass9540.8%– 38.4%495,6740.6%– 45.9%492736VW Golf9400.8%+ 68.8%349,0110.9%+ 31.0%293137Audi Q59030.8%+ 64.5%n/a4,2850.4%+ 5.5%n/an/a38MG 38990.8%+ 84.6%429,2040.9%+ 1075.5%27n/a39Skoda Fabia8910.8%+ 24.3%n/a6,6870.7%+ 16.4%414540Skoda Kamiq8660.7%– 1.4%n/a6,5170.7%+ 11.0%434941Audi A18640.7%+ 4.9%396,1180.6%+ 16.5%45n/a42Ford Tourneo Courier8610.7%+ 1.9%407,1510.7%+ 51.6%37n/a43Suzuki Vitara8580.7%– 9.3%466,5930.7%– 4.6%424144DR 5.08350.7%– 9.7%n/a5,8280.6%n/a484845BMW Serie 18290.7%+ 100.2%n/a6,0100.6%+ 19.2%46n/a46BMW X38090.7%+ 57.7%315,3880.6%+ 17.5%n/an/a47Ford Kuga8010.7%– 20.0%447,0960.7%– 18.7%383348Lancia Ypsilon7980.7%– 71.6%n/a6,1650.6%– 77.6%44949Audi Q37710.7%– 63.1%357,3070.8%– 39.0%362350Mercedes GLC7180.6%+ 100.6%n/a4,8350.5%+ 74.9%n/an/an/aVolvo XC407150.6%– 19.9%415,4480.6%– 5.0%5050n/aAlfa Romeo Tonale7120.6%– 36.2%326,9960.7%– 28.3%3928n/aNissan Juke6360.5%– 1.9%477,9400.8%+ 4.2%3335n/aFord Focus5450.5%– 30.0%367,7690.8%+ 2.4%3538n/aVW Taigo3640.3%– 56.0%n/a5,8650.6%– 16.2%4747
Source: UNRAE


More Stories
Ford F-150 Overland Capacity: What Actually Matters When You’re Packing for the Backcountry!
Overland Builds Live and Die by How Well You Use Your Roof Ask ten F-150 owners what “overland ready” means...
How Much Does It Cost to Rent an Exotic Car in Houston?
Exotic rentals in Houston run anywhere from $800 to $2,500 per day, and the spread comes down to what’s in...
In-Car Cameras Are Now Required in Europe as Driver Monitoring Debate Heads Toward the U.S.
New vehicles sold in the European Union are now required to include advanced driver-distraction warning technology, and for many models...
2026 Cadillac CT5 Pricing: The Last Luxury Sedan From a Legacy American Automaker
Edmunds said it plainly in their 2026 review: the CT5 is the last luxury sedan from a legacy American automaker,...
What Is BMW SmartView?
Your phone already does most of the heavy lifting when it comes to media, navigation, and apps. BMW SmartView is...
2026 Mazda CX-70 Invoice Pricing: Three Powertrains, a $3,000 Rebate, and 0.9% Financing
If you are shopping for a 2026 Mazda CX-70 and want to know what dealers are actually paying, what a...