
Czechia April 2025: Skoda Fabia, Karoq, Kamiq help push market up 8.6%
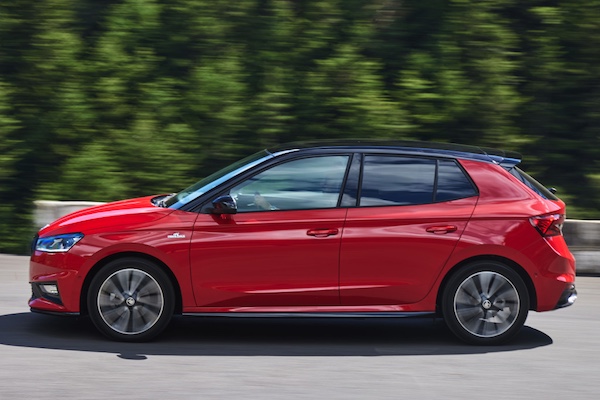
Skoda Fabia sales are up 84.3% in April.
21,226 new cars hit Czech roads in April, a solid 8.6% year-on-year improvement. The year-to-date tally is now up 4.9% to 80,912. Skoda (+17.4%) easily outpaces its home market to 35.4% share, leaving Hyundai (+8.7%) and Volkswagen (+20.1%) in the dust. Toyota (-32.2%) has an off month but manages to remain in 4th place overall. Ford (+40.7%), Renault (+40.6%) and Kia (+32.4%) impress. Below, Cupra (+115.5%) smashes sister brand Seat (-61%) almost 4-to-1. MG (+92.9%) and Audi (+27.8%) also shine.
Over in the models lane, the Skoda Octavia (-14.3%) stays on top with 7.9% of its home market and despite a steep year-on-year fall. The Skoda Kamiq (+36.9%) is back to the 2nd spot it holds year-to-date above the Skoda Karoq (+60.7%) and Fabia (+84.3%) both in outstanding shape. The Kodiaq (-12.3%) and Scala (-5.1%) ensure the Top 6 is 100% Skoda as it is also the case year-to-date. The Hyundai i30 (+3.4%) is the best of the rest at #7 ahead of a surging Kia Ceed (+119.1%) up to #8. The VW Golf (+84.4%) and MG ZS (+90.6%) also impress just outside the Top 10 while the new Skoda Elroq is up one spot on March to #15.
Previous month: Czechia March 2025: 7 Skodas in Top 7, Elroq up to #16
One year ago: Czechia April 2024: Skoda Kodiaq up to record #2, sales up 6.1%
Full April 2025 Top 65 All brands and Top 312 All models below.
Czechia April 2025 – brands:
PosBrandApr-25%/24Mar2025%/24PosFY241Skoda7,52135.4%+ 17.4%128,53635.3%+ 5.8%112Hyundai1,8308.6%+ 8.7%27,1058.8%– 1.6%223Volkswagen1,4416.8%+ 20.1%35,7097.1%+ 16.2%344Toyota1,2445.9%– 32.2%45,0306.2%– 24.9%435Kia1,0865.1%+ 32.4%63,9594.9%+ 22.5%556Dacia8594.0%+ 2.0%53,2784.1%+ 8.1%667Mercedes7823.7%+ 0.0%82,7163.4%+ 15.3%878Ford6783.2%+ 40.7%72,8223.5%+ 63.4%789Renault5332.5%+ 40.6%92,0732.6%+ 37.0%9910BMW5172.4%+ 4.0%102,0202.5%– 0.1%101011MG4882.3%+ 92.9%111,8072.2%+ 60.6%111312Peugeot4061.9%– 15.1%121,6012.0%– 9.2%121113Volvo3661.7%– 25.9%161,3231.6%– 22.4%141214Audi3311.6%+ 27.8%141,4921.8%+ 41.4%131415Suzuki3231.5%– 8.0%131,2371.5%– 6.5%151616Cupra3191.5%+ 115.5%171,1271.4%+ 47.3%162117Citroen 2731.3%+ 3.0%219301.1%– 9.6%181918SsangYong2431.1%– 38.9%181,0791.3%– 22.2%171819Opel2161.0%– 20.0%199001.1%– 22.3%191720Lexus2141.0%– 8.5%246590.8%– 16.6%212021Honda1730.8%+ 24.5%235670.7%+ 27.1%232422Tesla1700.8%– 6.6%157030.9%+ 38.7%201523Mitsubishi1310.6%+ 27.2%263490.4%+ 19.1%262824Mazda1270.6%+ 1.6%225480.7%– 5.7%242225Nissan1160.5%+ 146.8%205950.7%+ 48.0%222526Land Rover1050.5%+ 59.1%273690.5%+ 43.6%252627Porsche910.4%+ 30.0%282820.3%+ 36.9%293028Seat850.4%– 61.0%253160.4%– 67.0%272329Subaru710.3%– 23.7%293070.4%– 2.8%282730Mini470.2%+ 74.1%301810.2%+ 44.8%303231Jaecoo340.2%new40420.1%new36 –32Alfa Romeo280.1%+ 47.4%36960.1%+ 20.0%333333Jeep270.1%– 20.6%32980.1%– 24.0%323134Fiat260.1%– 63.9%331030.1%– 52.3%312935Omoda230.1%new41310.0%new39 –36DS140.1%– 12.5%34480.1%– 17.2%353537BAIC140.1%new39300.0%new406238Ferrari110.1%+ 10.0%42390.0%+ 5.4%373639Joyear90.0%+ 125.0%31510.1%+ 363.6%343940Dodge90.0%– 47.1%35330.0%– 41.1%383441Jaguar90.0%– 40.0%46300.0%– 31.8%413742Bentley40.0%– 33.3%49120.0%– 36.8%474343Dongfeng30.0%– 25.0%45290.0%+ 383.3%424144Lamborghini30.0%– 70.0%37210.0%– 27.6%434045Forthing30.0%– 50.0%43200.0%– 23.1%443846Chevrolet30.0%– 50.0%5470.0%– 61.1%524547Ineos20.0%– 33.3%44160.0%– 11.1%454248Alpine20.0%+ 0.0%5080.0%+ 0.0%514749Lada20.0%n/a5370.0%n/a536750Fisker20.0%n/a –40.0%n/a555451Maserati20.0%– 60.0%5540.0%– 55.6%564652Caterham20.0%n/a5630.0%n/a596953Cadillac20.0%+ 100.0% –20.0%– 50.0%645354Voyah10.0%new38150.0%new466655SWM10.0%+ 0.0% –120.0%+ 300.0%484456Aston Martin10.0%n/a4790.0%+ 80.0%505257DR10.0%n/a5140.0%n/a54 –58Rolls Royce10.0%+ 0.0%5240.0%+ 100.0%574959BYD10.0%new –30.0%new584860Chrysler10.0%– 66.7% –30.0%– 40.0%605661Evo 10.0%new5720.0%new616362Xpeng10.0%new –20.0%new63 –63Morgan10.0%n/a –10.0%n/a697164Arcfox10.0%new –10.0%new70 –65Dongfeng/Mhero10.0%new –10.0%new71 –
Czechia April 2025 – models:
PosModelApr-25%/24Mar2025%/24PosFY241Skoda Octavia1,6677.9%– 14.3%16,5448.1%– 20.9%112Skoda Kamiq1,0845.1%+ 36.9%33,9594.9%+ 16.2%243Skoda Karoq1,0725.1%+ 60.7%23,8934.8%+ 34.1%324Skoda Fabia1,0124.8%+ 84.3%43,6394.5%+ 10.8%565Skoda Kodiaq8504.0%– 12.3%53,6464.5%+ 15.5%436Skoda Scala7943.7%– 5.1%63,0393.8%– 13.6%657Hyundai i307573.6%+ 3.4%102,7223.4%– 13.7%778Kia Ceed6202.9%+ 119.1%92,2252.7%+ 69.6%8109Skoda Superb5602.6%+ 0.9%72,2122.7%+ 5.5%9810Hyundai Tucson4482.1%+ 1.1%82,1482.7%+ 0.9%10911VW Golf3911.8%+ 84.4%151,5321.9%+ 51.2%111312MG ZS3851.8%+ 90.6%121,4161.8%+ 63.1%131513Dacia Duster3501.6%– 24.7%111,4521.8%– 6.2%121214Toyota Corolla3311.6%– 16.0%131,3021.6%– 21.3%141115Skoda Elroq3121.5%new168321.0%new18 –16Kia Sportage2341.1%+ 13.0%257911.0%+ 18.1%211917Hyundai i202311.1%+ 62.7%187410.9%+ 52.2%232518Dacia Jogger2301.1%+ 16.8%218231.0%+ 12.4%201719Toyota RAV42201.0%– 41.0%278521.1%– 27.1%171420Dacia Sandero1960.9%+ 10.7%178311.0%+ 16.2%192021VW Tiguan1850.9%– 24.2%238671.1%+ 8.6%161622Skoda Enyaq1660.8%+ 88.6%207520.9%+ 145.8%222923Toyota Yaris Cross1610.8%+ 0.0%345530.7%– 46.0%301824SsangYong Korando1580.7%– 38.0%247170.9%+ 2.7%242425Ford Transit/Tourneo Custom1580.7%+ 305.1%148791.1%+ 770.3%154226Renault Captur1570.7%+ 55.4%226320.8%+ 24.9%263627Ford Kuga1550.7%+ 56.6%316430.8%+ 25.8%252328Ford Puma1540.7%– 5.5%296120.8%+ 25.7%273529Tesla Model Y1440.7%+ 11.6%194750.6%+ 58.9%342230Suzuki S-Cross1420.7%+ 1.4%265740.7%+ 0.5%293331Mercedes V Class1270.6%+ 47.7%504470.6%+ 92.7%364932Citroen C31230.6%+ 3.4%394110.5%– 5.3%425533VW Caddy1210.6%+ 14.2%325460.7%+ 9.2%323234VW Passat1210.6%+ 45.8%445350.7%+ 53.3%334635Toyota Proace City1200.6%– 59.6%365490.7%– 9.1%312136Cupra Formentor1200.6%– 5.5%633310.4%– 46.9%483437Toyota Aygo X1170.6%+ 120.8%453190.4%+ 2.2%515238Peugeot 20081160.5%– 32.2%374450.5%– 29.0%382739VW Tayron1150.5%new402360.3%new66 –40Hyundai Bayon1140.5%– 30.9%424200.5%– 27.8%413041Hyundai Kona1080.5%+ 10.2%384460.6%+ 9.0%374342Renault Clio 1060.5%+ 10.4%286090.8%+ 43.0%283143Mercedes GLC1050.5%– 7.1%414250.5%+ 29.6%404144VW Multivan1010.5%– 1.9%524360.5%+ 36.7%395645Suzuki Vitara960.5%– 26.7%463360.4%– 24.0%474446Toyota C-HR960.5%– 6.8%304710.6%+ 6.1%353947Volvo XC60940.4%– 9.6%722970.4%– 36.3%534048BMW X5930.4%+ 1.1%472800.3%– 25.5%554849Volvo XC40930.4%+ 22.4%622640.3%+ 8.2%596750Volvo XC90920.4%– 45.6%534070.5%– 23.1%433751VW Touran860.4%+ 48.3%653220.4%+ 24.3%505452Lexus NX850.4%+ 6.3%762490.3%– 5.3%646653Opel Combo850.4%+ 107.3%772300.3%+ 277.0%6711154Audi Q8840.4%+ 300.0%543120.4%+ 92.6%526855Cupra Terramar820.4%new1041630.2%new9327056Toyota Yaris810.4%– 56.7%642950.4%– 42.5%542657Dacia Bigster780.4%new201870.1%new135 –58BMW 5 Series770.4%+ 126.5%702540.3%+ 61.8%618259Mercedes E Class740.3%– 10.8%782170.3%+ 19.9%716360Nissan Qashqai740.3%+ 362.5%333940.5%+ 107.4%446961Suzuki Swift730.3%+ 82.5%582590.3%+ 105.6%608962VW Taigo720.3%+ 118.2%811760.2%+ 4.8%888363Mercedes GLE710.3%– 4.1%802690.3%+ 9.3%585964Cupra Leon680.3%+ 240.0%612510.3%+ 88.7%6210765Mitsubishi Space Star660.3%+ 53.5%1001370.2%+ 34.3%10513366Hyundai i10650.3%+ 3.2%563260.4%+ 12.0%496067Kia Stonic620.3%– 33.3%513540.4%+ 38.3%464768Peugeot 208610.3%– 48.3%492800.3%– 30.2%565369Honda CR-V610.3%+ 5.2%592510.3%+ 0.8%637270Ford Focus590.3%+ 3.5%792180.3%– 15.8%705171VW T-Cross590.3%+ 11.3%682090.3%+ 6.1%747172Renault Austral580.3%+ 0.0%851620.2%+ 3.2%949773Lexus LBX580.3%+ 480.0%951910.2%+ 1810.0%8112174BMW X1560.3%– 18.8%662380.3%+ 17.8%657475Volvo V60560.3%+ 30.2%831860.2%+ 91.8%8311976Mercedes GLS550.3%+ 10.0%821810.2%+ 14.6%859177Mercedes Vito550.3%+ 37.5%1251380.2%+ 19.0%10410078Peugeot 5008550.3%+ 44.7%672170.3%+ 49.7%728479Audi Q7540.3%+ 217.6%692280.3%+ 256.3%689280Kia Xceed520.2%– 3.7%892080.3%– 20.9%756181Audi A6520.2%+ 108.0%712110.3%+ 55.1%738182Peugeot Rifter520.2%+ 271.4%971350.2%+ 575.0%10610183BMW 3 Series510.2%– 12.1%731990.2%– 4.8%779984Ford Tourneo Courier510.2%+ 54.5%961660.2%+ 155.4%9213785Honda HR-V510.2%+ 64.5%1011300.2%+ 66.7%10912386Kia EV3510.2%new1781170.1%new11532787Opel Astra 490.2%– 42.4%571900.2%– 4.5%827788Cupra Ateca490.2%n/a353800.5%+ 6233.3%4514789Renault Symbioz490.2%new1581400.2%new10321790Toyota Proace480.2%– 66.0%1101170.1%– 77.1%1165091MG HS480.2%+ 23.1%601960.2%+ 1.6%797892Seat Leon460.2%– 25.8%741790.2%– 47.5%878093SsangYong Torres460.2%+ 4.5%751850.2%– 20.6%848894Peugeot 3008460.2%+ 43.8%921970.2%+ 97.0%7811095BMW X3450.2%+ 181.3%1121950.2%+ 69.6%8012296Citroen Berlingo440.2%+ 266.7%1181740.2%+ 596.0%907397Hyundai Santa Fe430.2%+ 1333.3%1271320.2%+ 238.5%10714598Renault Trafic420.2%+ 200.0%132770.1%+ 11.6%1489499Peugeot 308400.2%– 56.5%901800.2%– 51.6%8657100Citroen C4400.2%– 48.7%911490.2%– 53.7%9765101VW Touareg400.2%– 16.7%1111580.2%– 15.1%9676102Mazda CX-80400.2%new881600.2%new95207103Hyundai Inster400.2%new143930.1%new129 –104Audi Q3390.2%– 9.3%982240.3%+ 57.7%6998105Mercedes G Class390.2%+ 62.5%841480.2%+ 102.7%99126106Opel Mokka390.2%+ 85.7%482700.3%+ 1.1%5762107BMW X7370.2%– 17.8%122970.1%– 57.5%12890108Ford Tourneo Connect360.2%– 41.0%1091270.2%– 6.6%111117109Mercedes GLA360.2%– 29.4%1211270.2%– 7.3%112112110Land Rover Defender360.2%+ 260.0%1161160.1%+ 146.8%117129111Jaecoo 7340.2%new208420.1%new183 –112Porsche Cayenne330.2%+ 57.1%131930.1%+ 50.0%130149113Mercedes GLB310.1%– 29.5%1231190.1%– 36.4%11485114VW T-Roc310.1%+ 14.8%1191220.2%– 42.2%11386115Audi A5310.1%+ 24.0%130980.1%+ 32.4%127127116MG 5310.1%n/a189500.1%+ 400.0%178221117Mitsubishi ASX290.1%– 32.6%1081160.1%– 10.1%118115118Mazda CX-60290.1%+ 70.6%871000.1%+ 23.5%124135119Range Rover Sport270.1%+ 17.4%165930.1%+ 25.7%131155120Subaru Outback260.1%– 54.4%1531090.1%– 32.7%121105121Audi A3260.1%– 48.0%149920.1%– 42.5%132125122Lexus ES260.1%– 36.6%172640.1%– 47.1%158139123Mazda CX-30260.1%+ 4.0%1051280.2%+ 20.8%110120124Honda ZR-V260.1%+ 73.3%133770.1%+ 60.4%147150125Toyota Proace Verso260.1%n/a941750.2%n/a89134126Renault Rafale260.1%new113830.1%new141218127VW Polo250.1%– 47.9%152770.1%– 68.0%14979128Renault Kangoo240.1%– 25.0%1141320.2%+ 78.4%108109129SsangYong Rexton240.1%+ 41.2%1381080.1%+ 11.3%123124130Citroen C5 Aircross240.1%+ 41.2%162840.1%+ 2.4%138152131Subaru Forester240.1%+ 100.0%1291110.1%+ 141.3%120167132Mercedes CLA230.1%– 46.5%128860.1%– 35.3%136116133Nissan X-Trail230.1%+ 0.0%551460.2%+ 58.7%100142134Mini Countryman230.1%+ 76.9%117990.1%+ 76.8%126156135BMW ix1230.1%+ 76.9%155700.1%+ 94.4%155157136Mitsubishi Colt230.1%+ 76.9%173630.1%+ 34.0%162183137Opel GrandLand X230.1%+ 228.6%142830.1%+ 159.4%140197138VW ID. Buzz230.1%+ 2200.0%124790.1%+ 558.3%145215139Omoda 5230.1%new209310.0%new209 –140Tesla Model 3220.1%– 53.2%432080.3%+ 10.6%7628141VW ID.7220.1%+ 340.0%1151490.2%+ 186.5%98154142VW Transporter210.1%– 83.6%151830.1%– 76.4%14245143Porsche 911210.1%– 12.5%204540.1%– 5.3%176184144Mercedes C Class210.1%+ 75.0%179620.1%– 34.7%164128145Kia EV6210.1%+ 250.0%233370.0%+ 15.6%192192146Toyota Camry200.1%– 62.3%1031460.2%– 15.6%10195147Citroen C3 Aircross200.1%– 16.7%280270.0%– 67.5%214171148BMW 4 Series200.1%+ 11.1%1201120.1%+ 27.3%119146149Lexus UX200.1%+ 42.9%198510.1%– 45.2%177158150Seat Arona190.1%– 69.8%186610.1%– 69.5%166113151Honda Civic190.1%– 32.1%145730.1%+ 46.0%152166152Mazda3190.1%– 9.5%137730.1%– 23.2%153151153Kia Sorento190.1%+ 11.8%135780.1%+ 39.3%146138154Mercedes CLE190.1%+ 11.8%166570.1%+ 67.6%170160155MG 3190.1%new1021080.1%new122187156Lexus RX180.1%– 76.0%164840.1%– 68.5%13975157Renault Megane180.1%– 58.1%167700.1%– 49.3%156102158Audi Q5180.1%+ 0.0%1061430.2%+ 68.2%10296159Renault Espace180.1%+ 38.5%168410.1%– 14.6%185180160BMW X2180.1%+ 63.6%139630.1%+ 103.2%159181161Ford Transit180.1%+ 350.0%182310.0%– 55.7%208161162Ford Capri180.1%new194380.0%new189328163BMW 7 Series170.1%+ 6.3%180480.1%– 37.7%180174164Mercedes Sprinter170.1%+ 54.5%136810.1%+ 131.4%143169165Citroen Spacetourer170.1%n/a159620.1%n/a163261166Volvo EX30160.1%– 27.3%146810.1%+ 19.1%14458167Hyundai Ioniq 5160.1%+ 60.0%188580.1%+ 26.1%168170168Peugeot Traveller160.1%+ 433.3%147610.1%+ 1933.3%165242169SsangYong Tivoli150.1%– 81.5%148610.1%– 82.7%16770170Mercedes A Class150.1%– 50.0%154630.1%– 31.5%161140171Renault Arkana150.1%– 31.8%99910.1%+ 3.4%133114172Porsche Macan150.1%+ 66.7%161570.1%+ 72.7%172200173Peugeot 408150.1%+ 114.3%141730.1%– 15.1%154144174Honda Jazz150.1%+ 150.0%205350.0%+ 75.0%197249175Seat Ateca140.1%– 80.0%150580.1%– 82.2%16993176BMW X6140.1%– 48.1%140740.1%– 21.3%151136177Mini 140.1%+ 180.0%144570.1%+ 54.1%171185178DS 7 Crossback140.1%+ 366.7%169430.1%+ 43.3%182216179VW ID.3130.1%+ 62.5%126900.1%+ 275.0%134148180Subaru Crosstrek130.1%+ 160.0%156570.1%+ 307.1%173195181VW California120.1%+ 33.3%246230.0%+ 43.8%228231182Ford Explorer120.1%+ 100.0%163380.0%+ 245.5%190206183Range Rover Evoque120.1%+ 140.0%220340.0%+ 88.9%199209184Fiat Doblo120.1%n/a190440.1%n/a181263185Mitsubishi Eclipse Cross110.1%+ 175.0%284270.0%+ 107.7%217250186Nissan Townstar110.1%+ 266.7%203280.0%– 12.5%213228187Suzuki Swace110.1%+ 450.0%93560.1%+ 409.1%174268188Kia Proceed100.0%– 90.3%171540.1%– 86.5%17564189Mercedes B Class100.0%+ 11.1%228230.0%– 11.5%227225190Mercedes EQE100.0%+ 25.0%174320.0%+ 39.1%205186191Audi A7100.0%+ 150.0%215320.0%+ 18.5%202208192BMW XM100.0%+ 400.0%170330.0%+ 73.7%200244193Renault 5100.0%new –100.0%new268 –194Opel Corsa90.0%– 76.9%187410.1%– 63.1%184143195Kia Picanto90.0%– 64.0%181630.1%– 33.7%160141196Mazda290.0%– 30.8%199320.0%– 34.7%204193197Alfa Romeo Stelvio90.0%– 10.0%232390.0%+ 8.3%187196198Range Rover Velar90.0%+ 28.6%183350.0%+ 52.2%198220199Renault Scenic90.0%n/a285240.0%+ 500.0%225205200Toyota Land Cruiser80.0%– 33.3%1071680.2%+ 102.4%91104201BMW 1 Series80.0%– 11.1%200350.0%+ 40.0%195219202Jeep Wrangler80.0%+ 14.3%222220.0%– 4.3%230210203Alfa Romeo Giulia80.0%+ 100.0%242200.0%– 9.1%235233204Volvo EC4080.0%new238200.0%new236272205Mercedes Citan70.0%– 75.9%160490.1%– 27.9%179173206Range Rover 70.0%– 30.0%211360.0%– 21.7%194176207Land Rover Discovery70.0%– 22.2%243320.0%+ 60.0%203214208BMW X470.0%– 22.2%219280.0%– 47.2%211194209Mercedes AMG GT70.0%– 12.5%229150.0%– 25.0%243232210Mini Cabrio70.0%+ 16.7%259150.0%– 21.1%244274211Nissan Juke70.0%+ 133.3%210240.0%– 71.4%224159212Mercedes EQT70.0%+ 133.3% –100.0%+ 233.3%265269213Porsche Panamera70.0%+ 250.0%177320.0%+ 433.3%206246214Ford Mustang70.0%+ 250.0%184270.0%+ 350.0%215238215Mercedes EQS70.0%+ 250.0%287140.0%+ 75.0%245240216VW ID.470.0%+ 600.0%175400.0%+ 300.0%186175217BMW 2 Series60.0%– 72.7%86990.1%– 7.5%125162218Hyundai Staria60.0%– 72.7% –120.0%– 82.6%252164219Ford Mustang Mach-E60.0%– 33.3%234190.0%– 26.9%237190220Jaguar F-Pace60.0%– 14.3%236230.0%+ 27.8%226241221Toyota Prius60.0%– 14.3%206220.0%– 15.4%232211222Mercedes EQA60.0%+ 0.0%192250.0%+ 38.9%220168223Mercedes T Class60.0%+ 0.0%292120.0%+ 9.1%254276224BMW i560.0%+ 20.0%214350.0%+ 133.3%196212225Alfa Romeo Tonale60.0%+ 20.0%283280.0%+ 33.3%210245226Jeep Avenger50.0%– 64.3%225270.0%– 3.6%216191227Mercedes S Class50.0%– 61.5%197370.0%– 28.8%193182228MG 450.0%– 50.0%212330.0%– 13.2%201130229BMW i450.0%– 50.0%221310.0%– 16.2%207172230Subaru BRZ50.0%– 50.0%231160.0%– 69.8%241189231Lexus RZ50.0%– 28.6%30580.0%– 11.1%279236232Kia EV950.0%+ 25.0%261170.0%– 37.0%238226233Dacia Spring50.0%+ 66.7%134850.1%+ 174.2%137199234Fiat 60050.0%+ 66.7%213260.0%+ 30.0%218198235Land Rover Discovery Sport50.0%+ 150.0%257120.0%– 52.0%253222236Porsche Taycan50.0%+ 150.0%288110.0%+ 10.0%261254237Ferrari Purosangue50.0%+ 150.0%26270.0%+ 0.0%282283238Audi Q650.0%new195240.0%new223278239Alfa Romeo Junior50.0%new30390.0%new269311240Opel Crossland X40.0%– 94.7%196380.0%– 92.1%19138241Fiat Panda40.0%– 81.0%237130.0%– 70.5%248179242Seat Tarraco40.0%– 69.2%25470.0%– 89.6%284177243Mercedes EQV40.0%+ 33.3%27090.0%– 18.2%272275244Audi A840.0%+ 100.0%247110.0%+ 83.3%256273245VW Crafter40.0%+ 100.0% –50.0%+ 0.0%297301246Peugeot Expert40.0%n/a249120.0%n/a255333247Volvo V9030.0%– 94.4%278250.0%– 85.2%222118248Toyota Highlander30.0%– 90.0%252250.0%– 77.7%221103249BMW 2 Series Active Tourer30.0%– 57.1%157640.1%+ 20.8%157188250Mercedes EQB30.0%– 57.1%191280.0%+ 27.3%212203251Porsche Cayman30.0%– 57.1%24580.0%– 52.9%280265252BMW IX30.0%– 25.0%260110.0%– 42.1%257234253Opel Zafira Life30.0%+ 200.0%193390.0%+ 3800.0%188224254Lamborghini Revuelto30.0%+ 200.0%30940.0%+ 300.0%301312255Tesla Model X30.0%n/a244110.0%+ 120.0%262282256Mini Aceman30.0%new301100.0%new266317257Porsche 71830.0%n/a250100.0%+ 900.0%267322258Baic X730.0%new27590.0%new271 –259VW Caravelle30.0%n/a –30.0%n/a309 –260Audi A420.0%– 95.5%218740.1%– 47.1%150108261Fiat 50020.0%– 94.6%279150.0%– 84.7%242132262Mazda CX-520.0%– 93.9%202260.0%– 84.5%21987263Kia Niro20.0%– 88.2%255110.0%– 81.4%260163264Toyota bZ4X20.0%– 85.7%176220.0%– 12.0%231201265Mazda620.0%– 81.8%227210.0%– 66.7%234165266Citroen C4 X20.0%– 81.8%256100.0%– 84.6%263178267Seat Ibiza20.0%– 77.8%26990.0%– 60.9%273255268Jeep Compass20.0%– 75.0%241110.0%– 77.6%259202269BMW Z420.0%– 71.4%224130.0%+ 0.0%246251270Bentley Continental20.0%– 60.0%29460.0%– 45.5%285281271Audi Q420.0%– 50.0% –90.0%– 10.0%270239272Audi Q220.0%– 33.3%223160.0%– 50.0%239223273Ineos Grenadier20.0%– 33.3%216160.0%– 11.1%240247274Ferrari 29620.0%+ 0.0%286130.0%+ 62.5%247277275Alpine A110 20.0%+ 0.0%26380.0%+ 0.0%275280276Bentley Bentayga20.0%+ 100.0% –50.0%+ 0.0%292310277Toyota Supra20.0%+ 100.0% –20.0%– 50.0%325303278Volvo EX9020.0%new272130.0%new250316279Baic X5520.0%new27480.0%new276 –280Citroen Jumpy20.0%n/a30280.0%n/a277344281Jeep Grand Cherokee20.0%n/a25180.0%n/a278289282Mitsubishi Outlander20.0%n/a23960.0%n/a287 –283Dr 6.020.0%new27650.0%new293379284Dr 5.020.0%new –20.0%new315 –285Ferrari 12Cilindri20.0%new –20.0%new317 –286Opel Frontera20.0%new –20.0%new322 –287VW Arteon10.0%– 96.0%24050.0%– 97.0%296131288Volvo S6010.0%– 94.1%25360.0%– 92.9%291153289BMW 8 Series10.0%– 83.3% –30.0%– 72.7%305266290BMW iX210.0%– 75.0%291110.0%+ 57.1%258227291Ferrari Roma10.0%– 75.0%26470.0%+ 0.0%283285292Jaguar F-Type10.0%– 75.0%25840.0%– 66.7%300292293Subaru Impreza10.0%– 50.0%27390.0%+ 125.0%274293294Maserati Grecale10.0%– 50.0%29530.0%– 25.0%307290295Jaguar E-Pace10.0%– 50.0% –20.0%– 75.0%318308296Ferrari SF90 Stradale10.0%+ 0.0%26760.0%+ 50.0%286296297Citroen C5 X10.0%+ 0.0%28230.0%– 72.7%306259298Audi A110.0%+ 0.0% –20.0%– 60.0%313299299Maserati Levante10.0%+ 0.0% –10.0%– 50.0%337351300Volvo EX4010.0%new185220.0%new233253301Voyah Free10.0%new207130.0%new251385302Lexus LM10.0%n/a300100.0%+ 66.7%264262303Opel Vivaro10.0%n/a –60.0%n/a288286304Rolls Royce Cullinan10.0%n/a27740.0%n/a304318305Aston Martin DB10.0%n/a –20.0%n/a312 –306Audi TT10.0%n/a –20.0%+ 100.0%314342307Evo 510.0%new30820.0%new316358308Lexus LS10.0%n/a –20.0%n/a320321309Toyota GR 8610.0%n/a31220.0%n/a324 –310BMW iX310.0%n/a –10.0%+ 0.0%331307311Jaguar i-Pace10.0%n/a –10.0%n/a335354312Subaru Solterra10.0%n/a –10.0%– 66.7%346324
Source: SDA CIA


More Stories
New 2027 BMW X5 & iX5 Roll into Town: The Art of Eloquence
Experienced Kimatni D. Rawlins | Automotive Rhythms When BMW unveiled the first X5 at Plant Spartanburg in 1999, the automotive...
Chevy Stars and Steel Collection Gives America A 250th Birthday Salute
Chevrolet is marking America’s 250th anniversary with a patriotic lineup that manages to avoid going over the top. The new...
How a Motorcycle Accident Lawyer Fights Rider Bias in Claims
California is the only state that legally permits full lane splitting, a practice that remains unfamiliar or misunderstood by many...
How Car Accident Victims Recover Maximum Compensation
A serious crash can change health, income, and family routines within seconds. Injured people often face cervical strain, concussion symptoms,...
Key Steps Car Accident Victims Should Take Immediately
A collision can leave victims sore, disoriented, and unsure which action matters first. Early decisions often affect treatment, evidence, and...
Smart SUV Upgrades for Road Trips and Outdoor Adventures
Your SUV isn’t just a comfy ride for daily errands. It’s really a ticket to explore, built with a flexible...