
Hungary February 2025: Ford up 144%
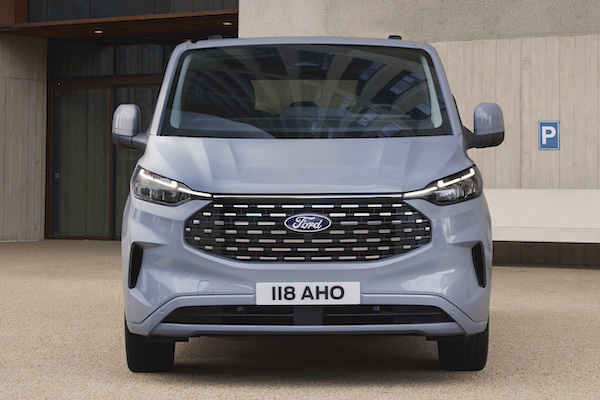
The Ford Tourneo Custom is up to #4 in February and YTD.
New Hungarian passenger car sales stand at 10,575 in February, a tiny -1.5% year-on-year evolution. The year-to-date tally is up almost 5% to 19,700. Suzuki remains in the lead of the brands chart with 15.6% share ahead of Toyota at 10.9%. Ford is up one spot on January to #3 and surges 144% year-to-date to 8.5% share. As a result Skoda falls to #4 overall ahead of Volkswagen. Looking at year-on-year lifts, Jeep (+447%), BYD (+218%) and Renault (+43%) are the most impressive below.
Model-wise, year-to-date the Suzuki S-Cross (+23.5%) stays in first place above the Skoda Octavia (-20.6%) and Suzuki Vitara (-18.6%), although note the Vitara is up to 2nd place in February. The Ford Tourneo Custom surges to 4th place ahead of the Kia Ceed (-0.6%), Nissan Qashqai (+3.5%) and Toyota Corolla (-15.6%). The Kia Sportage jumps to #8 vs. #14 over the Full Year 2024.
Previous month: Hungary January 2025: Ford and Tourneo Custom stun in market up 13%
One year ago: Hungary February 2024: Suzuki Vitara back on top above Skoda Octavia
Full February 2025 Top 20 brands and YTD Top 20 models below.
Hungary February 2025 – brands:
PosBrand PC onlyFeb-25%Jan2025%/24PosFY241Suzuki1,64915.6%12,81614.3%+ 6.8%112Toyota1,15310.9%22,21711.3%– 8.0%223Ford9468.9%41,6688.5%+ 144.0%454Skoda8698.2%31,8899.6%– 6.6%335Volkswagen7367.0%51,4407.3%+ 23.0%546Kia6105.8%61,2606.4%+ 22.8%667BMW5455.2%79985.1%+ 6.2%778Mercedes4394.2%88454.3%+ 26.0%899Hyundai4224.0%107343.7%– 17.0%101010Nissan3953.7%97583.8%+ 10.0%9811Dacia2842.7%144292.2%– 28.0%131112Audi2832.7%115242.7%– 10.0%111513Renault2832.7%125042.6%+ 43.0%121314Volvo2182.1%134222.1%– 24.0%141415Peugeot1641.6%153051.5%+ 7.0%151716Opel1481.4%n/a2361.2%– 59.0%181217BYD1471.4%n/a2511.3%+ 218.0%172218SsangYong1431.4%n/a2711.4%– 2.0%161819Tesla1081.0%n/an/an/an/an/a1620MG1051.0%n/an/an/an/an/a19n/aLexusn/an/an/a2281.2%– 17.0%1920n/aMazdan/an/an/a2081.1%– 14.0%2021n/aJeepn/an/an/a2081.1%+ 447.0%21n/a
Hungary YTD 2025 – models (ordered based on YTD sales):
PosModelJan-25%/24Jan2025%/24PosFY241Suzuki S-Cross9148.6%+ 21.7%11,4867.5%+ 23.5%122Skoda Octavia4934.7%– 35.6%21,0305.2%– 20.6%233Suzuki Vitara5485.2%– 33.6%39995.1%– 18.6%314Ford Tourneo Custom4043.8%n/a76393.2%n/a4225Kia Ceed2472.3%+ 0.0%55112.6%– 0.6%556Nissan Qashqai2972.8%– 8.9%84972.5%+ 3.5%647Toyota Corolla1921.8%+ 3.2%93831.9%– 15.6%768Kia Sportage2001.9%n/a103761.9%n/a8149Toyota Yaris Cross2332.2%– 2.1%203591.8%– 7.9%91210Dacia Duster2412.3%– 12.0%243541.8%– 28.2%10711Toyota C-HR1891.8%+ 21.2%163271.7%– 3.8%11912Suzuki Swift1711.6%n/a193041.5%n/a121713Ford Kuga1641.6%+ 18.0%182971.5%+ 19.3%131314VW Golf1131.1%– 21.5%112881.5%+ 15.2%141515Toyota Corolla Cross1231.2%– 47.7%132801.4%– 26.1%152016Ford Puma1531.4%n/a212771.4%n/a162417Hyundai Tucson1501.4%– 19.4%222731.4%– 27.0%171918Skoda Kodiaq1101.0%+ 15.8%142591.3%+ 32.1%182619Renault Clio1241.2%n/a272331.2%n/a193820Skoda Superb920.9%n/a172271.2%n/a2028
Source: Datahouse, many thanks to Csaba.

More Stories
Europe May 2026: BEVs up 39.1%, Chinese up 105.3%, Dacia Sandero now best-seller YTD
BYD sales are up 141.4% across Europe, the brand outsells Ford for the first time. According to Dataforce, the European...
Montenegro May 2026: Renault Captur stays #1, BYD Atto 2 on podium
The BYD Atto 2 ranks #3 for its first Top 10 finish in Montenegro. Based on data shared with us...
Hyundai’s Next Electric N Cars Could Get Even Wilder With Fake Idling, Backfires, and More Driver Feel
Hyundai’s N division has never been shy about having fun, and that spirit appears ready to carry even deeper into...
Tesla’s Full Self-Driving Is Causing Accidents: Here’s Who Florida Law Says Is Responsible
Tesla’s Full Self-Driving (FSD) technology represents one of the automotive industry’s most ambitious ventures into autonomous driving. While the system...
2026 GMC Terrain Invoice Pricing: What Dealers Pay After Two Price Hikes This Year
If the sticker price on a 2026 GMC Terrain feels higher than you remember from earlier in the model year,...
Porsche Sonderwunsch Takes Toy Story 5 911s From Imagination to Reality – Car Characters Explained Video
Porsche’s wild Disney and Pixar collaboration is getting another moment in the spotlight, this time through a new behind-the-scenes video...