
Italy February 2025: Fiat (-16.1%) embattled but in the lead
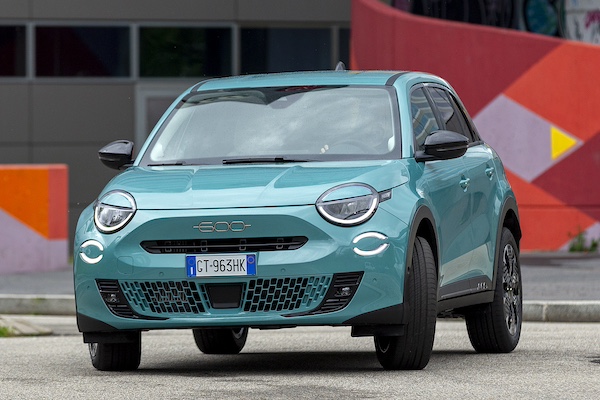
First Top 20 finish for the Fiat 600 at home.
It’s another disappointing result for the Italian new car market with February sales off -6.3% year-on-year to 137,922. This brings the year-to-date tally to 271,638, down -6.1% over the same period a year ago and -21% over pre-pandemic 2019. Private sales trail the market this month at -11.2% to 75.626 and 54.3% share vs. 57.1% a year ago, as they do year-to-date at -7.4% to 160,419 and 58.6% vs. 59.1%. Self registrations drop -9.7% to 12,353 for the month and -6% to 23,573 year-to-date. Long term leases (+11.1%) ignore the negative market to 33,449 and 24% share vs. 20.2% last year, and limit their fall to -1% year-to-date at 60,123 and 22% share vs. 20.7% over the same period in 2024. For their part short term rentals sink -17.2% to 9,880 and 7.1% share vs. 8% a year ago and are off -20.2% year-to-date to 14,212 and 5.2% vs. 6.1%.
Looking at sales by alimentation, petrol is down -20.7% to 36,552 and 26.3% share vs. 30.9% in February 2024 and off -18.9% year-to-date to 72,693 and 26.6% share vs. 30.6% a year ago. Diesel implodes -38.5% to 13,574 and 9.7% share vs. 14.8% last year and is off an even steeper -41.6% year-to-date to 26,154 and 9.6% share vs. 15.3%. LPG limits its fall to -5.1% to 13,781 and 9.9% share vs. 9.7% but is down -9.3% year-to-date to 27,496 and 10% share vs. 10.3%. HEV registrations are up 10.3% to 62,149 and 44.6% share vs. 37.8% a year ago. This includes 17,373 full hybrids (+16.6%) and 44,776 mild hybrids (+8%). Year-to-date, HEV sales are up 10.4% to 122,658 and 44.8% share vs. 37.9% including 32,884 full hybrids (+9.3%) and 89,774 mild hybrids (+10.8%). PHEVs surge 31.9% to 6,207 for the month and up 25.4% year-to-date to 11,075. Finally BEVs step up 38.2% to 6,980 and still very limited 5% share vs. 3.4% a year ago and up 70.6% YTD to 13,710 and 5% share vs. 2.7% in 2024.
In the brands charts, Fiat (-16.1%) manages to hold onto the top spot – this is not a given based on the misadventures of the past 6 months – at 10.7% share vs. 11.9% in January and 5.9% in December. Toyota (+1.8%) overtakes Dacia (+14.7%) to take 2nd place overall although Dacia remains at #2 year-to-date vs. #4 over the Full Year 2024. Volkswagen (+3.1%) stays at #4 just as Peugeot (-0.8%) stays 5th. BMW (+5%) edges up to #6, distancing Citroen (-1.5%) and Jeep (-3.1%) both up on their January rankings. Renault (-20.9%) and Audi (-12.7%) struggle and round out the Top 10. Below, MG (+49%), Mercedes (+27.5%) and Nissan (+10.3%) all shine. BYD (+3192.7%) breaks all records at #23 with 1,350 sales, crossing the symbolic 1% share mark.
The entire Top 11 models brave the negative context with year-on-year gains. The Fiat Panda (+4.8%) is the faraway leader again with 8.6% of the market, exactly double all other vehicles in market. The Dacia Sandero (+2.8%) is shy but stays at #2 ahead of the Citroen C3 (+27.5%) and Jeep Avenger (+58.5%). The Toyota Yaris (+20.7%) and Dacia Duster (+25.5%) follow while the MG ZS (+32.8%) is up three spots on January to #7, a ranking record also hit in December 2023 and December 2024. The VW T-Roc (+56.6%) is up 9 spots on last month to #10 and the Nissan Qashqai (+10.3%) up 17 to #11. The Fiat 600 (+2322%) breaks into its home Top 20 for the very first time at #17. The Alfa Romeo Junior (#27) is the best-selling recent launch ahead of the MG 3 (#32) and BYD Seal U (#45) cracking the Top 50 for the first time.
Previous month: Italy January 2025: Fiat back to #1, Dacia breaks share record
One year ago: Italy February 2024: Fiat Panda, Dacia Sandero and Citroen C3 top market up 12.8%
Full February 2025 Top 51 All brands and Top 50 models below.
Italy February 2025 – brands:
PosBrandFeb-25%/24Jan2025%/24PosFY241Fiat14,75310.7%– 16.1%130,65611.3%– 8.5%112Toyota11,0848.0%+ 1.8%321,1857.8%+ 0.9%323Dacia10,2897.5%+ 14.7%221,7548.0%+ 12.8%244Volkswagen10,1697.4%+ 3.1%418,6856.9%– 2.9%435Peugeot7,6435.5%– 0.8%514,8875.5%– 6.8%566BMW6,3714.6%+ 5.0%712,7424.7%+ 3.6%677Citroen6,3684.6%– 1.5%1011,9084.4%– 8.3%10118Jeep6,2974.6%– 3.1%912,1894.5%– 11.5%899Renault5,8634.3%– 20.9%811,9784.4%– 9.6%9510Audi5,5914.1%– 12.7%612,4304.6%– 3.8%71011Ford5,3803.9%– 16.8%1110,5903.9%– 16.4%11812MG4,6433.4%+ 49.0%138,7743.2%+ 47.3%121613Mercedes4,3533.2%+ 27.5%128,5823.2%+ 33.9%131214Nissan4,0733.0%+ 10.3%177,2112.7%– 6.0%161915Hyundai4,0592.9%– 19.7%157,8192.9%– 14.0%141316Skoda3,4672.5%+ 8.8%186,4952.4%+ 7.1%171717Kia3,4282.5%– 13.5%147,3842.7%– 3.9%151418Opel3,0352.2%– 26.1%166,3612.3%– 29.0%181519Suzuki2,9302.1%– 29.6%195,6722.1%– 24.7%191820Alfa Romeo2,3081.7%+ 22.2%204,5851.7%+ 19.9%202121DR Motor1,4721.1%+ 35.9%212,8271.0%– 17.2%212322Cupra1,4211.0%– 22.1%222,5490.9%– 10.5%222423BYD1,3501.0%+ 3192.7%272,1770.8%+ 2373.9%243724Volvo1,2320.9%– 27.7%232,3360.9%– 30.6%232225Mini1,2100.9%+ 8.4%252,1530.8%– 9.9%252726Lancia9260.7%– 77.7%261,8160.7%– 77.5%272027Mazda8610.6%– 28.0%241,8220.7%– 36.7%262628Tesla8430.6%– 54.5%351,2510.5%– 44.5%322529Honda7810.6%+ 17.8%291,4430.5%+ 9.4%283130Land Rover6490.5%– 6.2%311,2950.5%– 27.2%302931EVO6430.5%+ 2.7%301,3000.5%+ 17.6%293232Seat5890.4%– 67.6%281,2730.5%– 55.6%312833Lexus5790.4%+ 45.5%341,1010.4%+ 36.8%333334Omoda+Jaecoo5230.4%+ 2277.3%331,0690.4%+ 2445.2%353835Porsche4870.4%– 38.7%321,0790.4%– 30.7%343036DS3670.3%– 15.4%366980.3%– 26.4%363437Mahindra2600.2%+ 1138.1%502860.1%+ 401.8%415038EMC2370.2%+ 125.7%384010.1%+ 76.7%374139Subaru1970.1%+ 65.5%403080.1%+ 22.2%404040Maserati1670.1%– 24.4%393210.1%– 29.1%393941Mitsubishi1410.1%– 36.5%373560.1%+ 9.2%383542Sportequipe1090.1%– 68.1%412160.1%– 51.7%424343Smart950.1%– 54.8%421920.1%– 58.9%433644Ferrari610.0%– 23.8%431420.1%– 4.7%444545Lamborghini430.0%+ 19.4%451020.0%+ 41.7%454646Polestar280.0%+ 211.1%49540.0%+ 390.9%484947Jaguar210.0%– 82.2%46570.0%– 77.7%474448Lotus190.0%– 17.4%48460.0%– 8.0%494849Lynk & Co170.0%– 80.5%44780.0%– 46.2%464250Aston Martin120.0%+ 33.3%51290.0%+ 38.1%515151SsangYong100.0%– 79.6%47410.0%– 53.9%5047 –Others4680.3%+ 147.6% –9330.3%+ 149.5% – –
Italy February 2025 – models:
PosModelFeb-25%/24Jan2025%/24PosFY241Fiat Panda11,8968.6%+ 4.8%125,2249.3%+ 12.0%112Dacia Sandero5,8964.3%+ 2.8%211,4734.2%– 7.1%223Citroen C35,7674.2%+ 27.5%410,3323.8%+ 12.0%344Jeep Avenger4,6653.4%+ 58.5%39,3503.4%+ 27.5%435Toyota Yaris3,5672.6%+ 20.7%76,5022.4%+ 40.7%786Dacia Duster3,5122.5%+ 25.5%57,8752.9%+ 35.4%5127MG ZS3,1772.3%+ 32.8%105,6152.1%+ 19.1%8148Peugeot 2083,0862.2%+ 8.2%66,8132.5%+ 15.3%679Toyota Yaris Cross2,9892.2%+ 0.9%95,5622.0%– 17.7%9510VW T-Roc2,7372.0%+ 56.6%194,4701.6%– 10.7%111111Nissan Qashqai2,2571.6%+ 10.3%283,5961.3%– 13.5%202212Renault Captur2,2511.6%– 22.9%84,8261.8%– 10.6%101013Peugeot 20082,1161.5%– 13.6%163,8871.4%– 32.3%161714Opel Corsa2,0641.5%+ 16.2%114,4041.6%+ 8.7%121515Toyota C-HR2,0631.5%+ 57.5%183,8091.4%+ 47.4%182516VW Tiguan2,0161.5%+ 121.3%153,8311.4%+ 92.6%172117Fiat 6001,9861.4%+ 2322.0%213,6351.3%n/a19n/a18Renault Clio1,9651.4%– 29.4%144,1361.5%– 19.5%14619Ford Puma1,9451.4%– 20.6%134,1471.5%– 21.5%131320BMW X11,8841.4%+ 13.8%203,5391.3%+ 6.8%212021VW T-Cross1,8361.3%– 20.6%124,1011.5%+ 23.2%151622Toyota Aygo X1,6131.2%– 26.6%173,3711.2%– 2.0%221923Peugeot 30081,5841.1%+ 47.5%342,6451.0%+ 32.8%273924VW Golf1,5681.1%+ 52.5%312,7081.0%+ 49.0%263125Kia Sportage1,5181.1%– 17.0%233,0561.1%– 17.0%231826Nissan Juke1,4471.0%+ 36.6%252,8651.1%+ 16.3%243527Alfa Romeo Junior1,3621.0%new262,7641.0%new25n/a28Audi A31,2480.9%– 4.6%272,6191.0%– 4.1%283729Hyundai i101,2060.9%– 33.8%332,3280.9%– 25.2%312630Skoda Kamiq1,0970.8%n/a352,1190.8%n/a344931Ford Focus1,0960.8%+ 9.4%441,9110.7%– 3.8%383832MG 31,0880.8%new302,2450.8%new33n/a33Ford Kuga1,0650.8%– 40.0%391,9960.7%– 34.4%373334Suzuki Vitara1,0330.7%– 5.5%362,0180.7%– 7.2%364135Hyundai Tucson1,0100.7%+ 11.1%292,2710.8%+ 33.0%323636Audi Q31,0080.7%– 17.7%222,6181.0%+ 3.2%292337BMW Serie 19740.7%+ 27.0%461,7380.6%+ 2.1%42n/a38Skoda Fabia9720.7%+ 5.3%471,7230.6%+ 21.1%434539Mercedes GLA9570.7%– 5.7%322,0910.8%+ 3.7%352940Kia Picanto9290.7%+ 5.9%242,4000.9%+ 47.8%303441Lancia Ypsilon9260.7%– 77.7%411,8160.7%– 77.5%39942DR 5.09060.7%n/a421,7530.6%n/a414843Ford Tourneo Courier8740.6%+ 77.3%431,6960.6%+ 170.9%44n/a44Suzuki Swift8730.6%– 14.7%481,5700.6%– 6.2%454345BYD Seal U8370.6%newn/a1,3110.5%newn/an/a46Audi A18360.6%+ 24.8%371,8010.7%+ 75.7%40n/a47Jeep Compass8350.6%– 54.0%n/a1,4280.5%– 57.1%482748BMW X28330.6%n/an/a1,4550.5%n/a46n/a49Volvo XC408080.6%n/an/a1,3940.5%n/a505050Jeep Renegade7740.6%– 57.9%n/an/an/an/an/a30n/aAudi Q56420.5%– 10.3%451,4320.5%– 8.3%47n/an/aDacia Spring4600.3%+ 405.5%381,4210.5%+ 434.2%49n/a
Source: UNRAE
More Stories
Toyota’s Built to Last Documentary Puts Its American Manufacturing Legacy in the Spotlight
Toyota is preparing to tell a distinctly American side of its story with Built to Last: Toyota’s Mobility Journey, a...
EV Sales Are Slowly Climbing Back After the Federal Tax Credit Expired
The end of the federal EV tax credit hit the electric vehicle market hard at the start of 2026, and...
Gear Selector Replacement: What It Costs and Whether It Is Worth It
When the gear selector needs replacing A gear selector that has gone beyond simple adjustment or lubrication needs replacing. If...
Ford’s Plan to Fix Its Recall Problem Starts With Daily Engine Teardowns and AI
Ford has had a rough stretch when it comes to recalls, and the company knows it. In 2025, the Blue...
Is Suzuki fuel-efficient?
Yes. Suzuki is one of South Africa’s most fuel-efficient vehicle brands, with models like the Celerio, Swift, Fronx, and Grand...
Malaysia May 2026: Proton Saga back in charge
The Proton Saga is the best-selling vehicle in Malaysia in May. It’s a difficult month for new car sales in...