
Indonesia September 2024: Toyota Kijang Innova and Avanza top sinking market
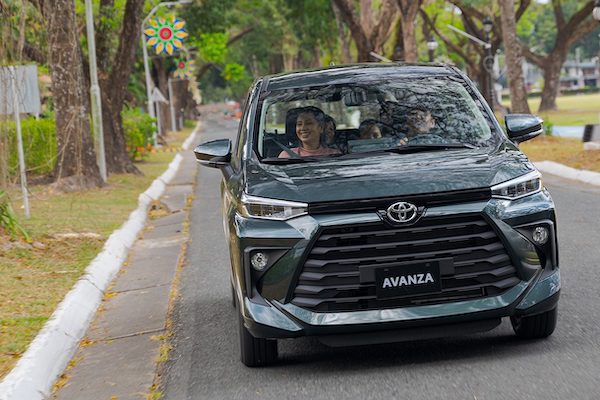
Toyota Avanza sales are up 19.5% year-on-year in September.
The Indonesia new wholesales market drops anther -9% year-on-year in September to just 72,667. This is a particularly poor result given September 2023 was already off -20.1% on the year prior. The year-to-date tally is now down -16.1% to 633.218. As for retail sales, they are down -10.6% to 72,366 for the month and off -11.9% year-to-date to 657,223.
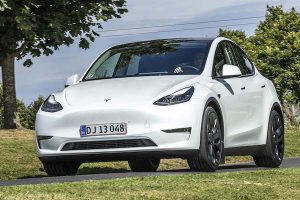
Brand leader Toyota (-1.8%) falls much slower than the market in the wholesales charts with an improved 35% share, higher than at home in Japan (28.9%). Daihatsu (-15.5%) and Honda (-27.4%) follow in difficulty while Mitsubishi (-6.8%) fares a little better at #4. Suzuki (-20.3%) is in a rut and rounds out a Top 5 unchanged on August and Year-to-date. Mitsubishi Fuso (+8%) and Wuling (+0.1%) defy the market with positive result and BYD falls back down two spots on last month to a still impressive #8 with 2.9% share for its 4th month in market. Retail-wise, Toyota (-3.9%), Daihatsu (-18.9%) and Honda (-25.2%) also dominate with Mitsubishi (-3.4%) and Hino (-2.6%) resisting and BYD down to #10 below Wuling. Chery (+51.5%) and MG (+245.3%) shoot up.
Over in the wholesales models ranking, the Toyota Kijang Innova (-7%) scores its 10th win in the past 15 months and with a margin of almost 1,300 units. Once uncontested leader the Toyota Avanza (+19.5%) soars to #2 but remains #4 year-to-date. The Honda Brio (-18.8%) sinks year-on-year but edges up one spot on August to #3 with 6.4% share, higher than its YTD level of 6%. The Daihatsu Gran Max Pikap (+21.9%) manages the largest year-on-year uptick in the Top 9, distancing the Daihatsu Sigra (-25.8%) still #2 year-to-date an its twin the Toyota Calya (-0.3%). The Toyota Fortuner (+1754.4%) flies off to #10 vs. #53 last month off a low year-ago comparison set. The Mitsubishi Pajero Sport (+62.6%) and Toyota Hilux (+15.1%) also shine below. The BYD M6 leads Chinese models at #22 vs. #43 in August.
Previous month: Indonesia August 2024: BYD up to #6 with 3.9% share, Toyota Kijang Innova now #1 YTD
One year ago: Indonesia September 2023: Toyota Kijang Innova threepeats at #1, market sinks -20.1%
Full September 2024 Top 35 All brands wholesales and retail and Top 170 All models wholesales below.
Indonesia September 2024 – brands (wholesales):
PosBrandSep-24%/23Aug2024%/23PosFY231Toyota25,45435.0%– 1.8%1208,37132.9%– 15.4%112Daihatsu12,67617.4%– 15.5%2125,84919.9%– 14.7%223Honda7,92610.9%– 27.4%369,32010.9%– 35.8%334Mitsubishi5,8248.0%– 6.8%454,2078.6%– 6.8%455Suzuki5,1837.1%– 20.3%548,9917.7%– 19.1%546Mitsubishi Fuso2,3413.2%+ 8.0%820,0803.2%– 17.4%677Hino2,2513.1%– 1.4%716,6742.6%– 19.0%998BYD2,0752.9%new68,5361.3%new11 –9Wuling2,0042.8%+ 0.1%1013,9142.2%– 3.9%101010Isuzu1,6702.3%– 37.9%920,0763.2%– 16.8%7811Hyundai1,5962.2%– 48.6%1117,1642.7%– 35.3%8612Chery6730.9%+ 46.3%126,1901.0%+ 90.8%121413BMW 4310.6%– 6.9%163,0850.5%– 1.8%151314Mazda4010.6%– 13.4%143,4350.5%– 18.1%131215MG3880.5%+ 151.9%153,3840.5%+ 261.9%142016Mercedes3380.5%– 16.7%132,8330.4%– 28.3%161117Tank1780.2%new294130.1%new28 –18Nissan1670.2%+ 47.8%208850.1%– 34.7%211719UD Trucks1590.2%– 7.6%181,4790.2%+ 4.4%181620Lexus1370.2%– 41.9%172,0480.3%+ 16.2%171521Neta1230.2%new224840.1%new262822Citroen1200.2%new219620.2%new19 –23Dongfeng (DFSK)1100.2%+ 18.3%276790.1%– 34.3%231924Kia 940.1%– 23.0%289580.2%– 16.6%201825Mini800.1%– 25.9%197300.1%+ 16.6%222126BAIC720.1%new251400.0%new30 –27Ford700.1%n/a246050.1%n/a25n/a28FAW430.1%– 75.8%266150.1%+ 22.3%242329Subaru400.1%+ 81.8%234410.1%– 4.1%272430Scania260.0%– 10.3%302980.0%– 50.3%292231Volvo100.0%n/a31960.0%n/a31 –32Volkswagen40.0%– 82.6%32650.0%– 69.9%332633Audi20.0%– 50.0%34220.0%– 43.6%363034Haval10.0%new33640.0%new34 –
Indonesia September 2024 – brands (retail):
PosBrandSep-24%/23Aug2024%/23PosFY231Toyota25,56135.3%– 3.9%1217,60833.1%– 8.4%112Daihatsu12,49017.3%– 18.9%2129,84819.8%– 13.2%223Honda7,60910.5%– 25.2%375,51411.5%– 22.2%334Mitsubishi6,0338.3%– 3.4%455,3828.4%– 11.5%455Suzuki5,1197.1%– 19.3%550,9427.8%– 16.4%546Mitsubishi Fuso2,2963.2%– 18.2%720,0233.0%– 21.5%777Isuzu2,1623.0%– 18.6%920,9033.2%– 11.0%688Hino2,1373.0%– 2.6%1016,0782.4%– 19.4%1099Wuling2,0072.8%– 14.5%817,7132.7%– 3.8%81010BYD 1,7882.5%new66,2240.9%new11 –11Hyundai1,4912.1%– 51.9%1117,4412.7%– 35.0%9612Chery6060.8%+ 51.5%125,9690.9%+ 93.4%121413MG4420.6%+ 245.3%133,4080.5%+ 282.9%142014BMW 4350.6%– 7.1%152,9370.4%– 1.8%151315Mazda4090.6%– 23.7%143,4260.5%– 9.4%131216Mercedes3300.5%– 22.7%162,8790.4%– 27.5%161117Lexus2010.3%+ 23.3%172,2000.3%+ 36.6%171518UD Trucks1820.3%+ 18.2%181,3550.2%– 0.4%181619Nissan1480.2%+ 0.7%209190.1%– 39.3%201720Tank 1400.2%new283490.1%new28 –21Mini1210.2%+ 7.1%217320.1%+ 25.8%222122Citroen1180.2%new225850.1%new25 –23Kia 1010.1%– 9.8%191,0750.2%– 15.4%191924Subaru790.1%+ 46.3%235020.1%+ 37.2%262425Dongfeng (DFSK)730.1%– 42.5%258620.1%– 30.7%211826BAIC650.1%new30860.0%new31 –27Neta630.1%new243940.1%new272828Ford610.1%n/a276220.1%n/a23 –29FAW430.1%– 75.8%266150.1%+ 22.3%242330Scania260.0%– 10.3%292980.0%– 50.5%292231Volvo100.0%n/a31960.0%n/a30 –32Seres90.0%new33820.0%new323033Haval50.0%new32440.0%new34 –34Volkswagen40.0%– 88.9%34770.0%– 65.0%332635Audi20.0%– 50.0%35210.0%– 54.3%3729
Indonesia September 2024 – models (wholesales):
PosModelSep-24%/23Aug2024%/23PosFY231Toyota Kijang Innova6,0298.3%– 7.0%146,7047.4%+ 7.7%112Toyota Avanza4,7516.5%+ 19.5%337,7696.0%– 16.5%423Honda Brio4,6596.4%– 18.8%437,8516.0%– 18.8%344Daihatsu Gran Max Pikap4,1845.8%+ 21.9%535,0935.5%– 4.1%565Daihatsu Sigra3,9455.4%– 25.8%244,3867.0%– 5.3%236Toyota Calya3,5344.9%– 0.3%628,8224.6%– 16.2%657Toyota Rush2,3833.3%– 21.2%724,4613.9%– 13.2%898Mitsubishi Xpander2,2893.1%– 17.0%825,3874.0%– 17.1%789Suzuki Carry Pikap2,2103.0%– 34.1%922,0913.5%– 31.2%9710Toyota Fortuner1,9102.6%+ 1754.4%539,7051.5%– 14.4%172111Mitsubishi Pajero Sport1,7792.4%+ 62.6%1610,5171.7%+ 0.7%162412Daihatsu Ayla1,5952.2%– 1.8%1112,7812.0%– 32.7%121213Toyota Hilux1,4722.0%+ 15.1%1011,0471.7%– 34.4%141614Daihatsu Terios1,4161.9%+ 4.4%1313,6482.2%– 17.9%111115Toyota Veloz1,2311.7%– 13.7%1410,6921.7%– 32.7%151416Toyota Agya1,2001.7%– 29.8%1214,7152.3%– 13.2%101317Toyota Raize1,1151.5%+ 2.0%179,4461.5%– 30.5%181818Honda HR-V1,0311.4%– 52.3%1911,2091.8%– 45.8%131019Honda BR-V9941.4%– 2.6%318,0911.3%– 49.3%231720Mitsubishi L-300 Pikap9521.3%– 38.1%188,8751.4%– 21.1%202321Honda WR-V9451.3%– 39.7%208,2891.3%– 50.4%221522BYD M68361.2%new431,1880.2%new54 –23Suzuki XL77461.0%– 46.0%267,7101.2%– 26.8%242024Hyundai Stargazer7161.0%– 57.4%239,0661.4%– 23.5%191925Mitsubishi Xforce6770.9%new244,5510.7%new294726Mitsubishi L200 Triton6660.9%– 49.8%325,3540.8%– 17.9%272827Isuzu Traga PHR6550.9%– 34.5%257,3171.2%– 13.5%252628BYD Atto 36020.8%new212,7570.4%new42 –29Daihatsu Xenia5760.8%– 60.6%228,3291.3%– 29.1%212230Wuling Cloud5060.7%new422,9430.5%new40 –31Toyota Hiace5040.7%+ 102.4%273,7090.6%+ 29.7%333732Wuling Air4920.7%– 24.9%382,1490.3%– 30.3%453433BYD Seal4910.7%new153,7310.6%new32 –34Toyota Yaris Cross4600.6%– 59.4%353,5170.6%– 41.7%353035Suzuki Baleno4490.6%+ 38.6%303,1560.5%+ 48.9%384436Hyundai Creta4310.6%+ 3.4%364,4770.7%– 27.1%302937Toyota Alphard4020.6%+ 94.2%293,4530.5%+ 12.2%363938Suzuki Alpha3970.5%new333,0140.5%new39 –39Daihatsu Gran Max Minibus3670.5%– 68.3%635,5910.9%– 40.3%262540Suzuki Ertiga3520.5%– 28.2%404,7370.7%– 34.5%282741Suzuki Jimny3440.5%+ 483.1%641,6400.3%+ 143.3%506442Wuling Alvez3200.4%– 14.9%461,5270.2%– 63.4%513243Daihatsu Rocky3010.4%– 33.6%413,2010.5%– 23.5%373544Suzuki APV Minibus2540.3%+ 61.8%392,4070.4%– 6.4%434045Wuling Confero S2530.3%– 43.1%281,6570.3%– 57.3%493346Suzuki Grand Vitara2340.3%+ 14.7%491,6940.3%+ 38.7%485247Daihatsu Luxio2340.3%+ 18.2%442,0400.3%– 24.0%464248Honda CR-V2300.3%+ 233.3%552,8340.4%– 7.1%413649Chery Omoda E52060.3%new343,6910.6%new34 –50Suzuki S-Presso1970.3%– 44.8%472,1750.3%– 19.9%443851Chery Tiggo 81900.3%new1042990.0%new90 –52MG ZS1790.2%+ 258.0%567650.1%+ 154.2%638753Wuling Binguo1780.2%new604,0540.6%new315654Chery Tiggo 5X1760.2%new507540.1%new64 –55Hyundai Kona1740.2%new526040.1%new6917856Mazda CX-31700.2%+ 66.7%579770.2%– 38.2%605057Nissan Serena1560.2%+ 271.4%614570.1%+ 45.5%748458MG 41560.2%+ 524.0%452,0150.3%+ 2516.9%4713959Hyundai Palisade1520.2%+ 17.8%581,3730.2%– 42.0%534560BYD Dolphin1460.2%new378600.1%new62 –61Tank 3001400.2%new –1400.0%new115 –62Toyota Voxy1330.2%– 50.0%481,4110.2%– 28.3%524663Wuling Almaz1290.2%– 38.6%678640.1%– 23.9%614964Neta V1230.2%new744840.1%new7311365Toyota Land Cruiser 3001210.2%+ 42.4%621,1540.2%+ 138.9%586166Wuling Formo1120.2%– 23.8%1015150.1%– 64.3%714867Hyundai Ioniq 51020.1%– 87.1%511,0920.2%– 78.6%593168BMW 5 Series1000.1%+ 334.8%762580.0%– 11.3%959069Lexus LM930.1%n/a591,1650.2%+ 494.4%557470Chery OMODA 5910.1%– 77.1%651,1570.2%– 49.4%574371Citroen C3 Aircross SUV870.1%new736070.1%new68 –72Dongfeng Mini Truck780.1%+ 8.3%825150.1%– 20.3%726673Mazda CX-5700.1%– 34.0%541,1640.2%– 0.3%565174Mercedes E-Class660.1%+ 46.7%661920.0%– 53.2%1048075Mazda3630.1%– 38.2%715390.1%+ 30.5%707076Toyota Camry630.1%+ 200.0%702860.0%– 62.1%937977Mini Cooper610.1%– 26.5%683680.1%– 2.9%827578BMW 3 Series590.1%+ 25.5%696690.1%+ 49.0%656879BMW X5580.1%+ 123.1%834000.1%– 14.2%807180Daihatsu Sirion580.1%+ 480.0% –1780.0%– 62.9%1077881Honda Civic520.1%– 48.5%756100.1%– 30.5%675882BMW X1510.1%– 26.1%794390.1%+ 139.9%759383Ford Everest450.1%new893560.1%new83 –84BMW X3400.1%+ 48.1%843070.0%– 17.5%888285Toyota Yaris390.1%– 40.0%903470.1%– 73.6%865586BMW 4 Series390.1%+ 85.7%108990.0%– 69.6%1248987Kia Seltos390.1%+ 1200.0% –530.0%– 47.0%15012788Tank 500380.1%new802730.0%new94 –89BAIC BJ40 Plus370.1%new85800.0%new130 –90Mercedes C-Class360.0%+ 44.0%724040.1%– 36.8%796591Mazda CX-30350.0%– 7.9%773020.0%+ 11.4%899692Toyota Vellfire350.0%+ 1650.0%943560.1%+ 45.9%8410493BAIC X-55350.0%new105600.0%new146 –94Citroen C3330.0%new993550.1%new85 –95MG VS HEV320.0%new782890.0%new92 –96Kia Sonet300.0%– 46.4%1514350.1%– 26.6%766797Mercedes GLC290.0%– 51.7%1092210.0%– 13.0%998898Mazda CX-60290.0%+ 26.1%861790.0%+ 148.6%10613199Toyota Corolla Cross250.0%+ 0.0%113800.0%– 92.4%13159100Dongfeng Glory 560250.0%+ 316.7%126480.0%– 15.8%153138101Ford Ranger250.0%n/a922490.0%n/a97 –102Mercedes GLA240.0%+ 166.7%1141930.0%– 11.9%102105103Toyota bZ4X230.0%+ 15.0%93730.0%– 84.5%13883104BMW 2 Series200.0%– 53.5%1031920.0%+ 15.0%103100105Toyota Corolla200.0%– 50.0%1101500.0%– 65.4%11277106Lexus RX190.0%– 77.6%1006550.1%– 30.9%6660107MG 5 GT180.0%– 70.5%962160.0%– 44.0%10081108Kia Carnival180.0%+ 0.0%911460.0%+ 15.9%114124109Mini Countryman170.0%– 15.0%872970.0%+ 38.8%9199110Mercedes A-Class170.0%+ 6.3%1021550.0%– 4.3%111106111Lexus LX170.0%n/a1111370.0%+ 65.1%116126112Subaru Forester170.0%n/a1121130.0%+ 213.9%121157113Honda Accord140.0%– 77.8%1171720.0%– 55.9%10885114Wuling Cortez140.0%– 22.2%1201900.0%– 69.3%10563115Mazda2140.0%– 6.7%129750.0%– 54.5%133109116BMW IX1140.0%new95920.0%new129 –117Mercedes GLE130.0%– 27.8%1252530.0%+ 23.4%9691118Subaru BRZ130.0%+ 116.7%115730.0%– 44.7%137116119Hyundai Santa Fe120.0%– 82.6%814310.1%– 43.5%7762120BMW IX110.0%– 85.1%1331140.0%– 70.8%12069121Mazda CX-8100.0%– 73.7%971050.0%– 46.4%123102122Mercedes GLS100.0%+ 150.0%122580.0%– 43.7%147134123BMW i590.0%new119670.0%new141 –124Hyundai Ioniq 680.0%– 20.0%147390.0%– 76.2%162101125Kia Carens70.0%– 84.1%1062250.0%– 19.4%9894126Dongfeng Gelora70.0%– 53.3%1341160.0%– 47.7%11995127BMW X770.0%+ 16.7%136730.0%– 24.7%136133128Chery Tiggo 7 Pro60.0%– 76.9%118940.0%– 75.0%12886129Mercedes S-Class60.0%– 60.0%137660.0%– 58.5%142115130Volvo XC6060.0%n/a145220.0%n/a171 –131BMW 7 Series50.0%– 82.1%1071210.0%+ 33.0%117122132Subaru Crosstrek50.0%– 58.3%981560.0%+ 2.6%110117133Mercedes CLA50.0%+ 400.0%164400.0%– 20.0%161142134Mercedes V-Class50.0%n/a141360.0%– 12.2%163151135Nissan Livina40.0%– 85.7%1591560.0%– 69.4%10972136Lexus NX40.0%– 84.0%135540.0%– 64.9%149103137VW Tiguan40.0%– 77.8%124570.0%– 68.3%148110138Mazda640.0%– 33.3%153270.0%– 77.3%167128139BMW i440.0%+ 100.0% –230.0%– 47.7%168150140Subaru Outback40.0%+ 300.0%123470.0%+ 80.8%155158141Chery GT40.0%new1311480.0%new113118142Lexus LBX40.0%new132190.0%new173 –143Mercedes GLC Coupe40.0%n/a146180.0%+ 50.0%175169144BMW i730.0%– 95.2%142980.0%+ 58.1%126125145Mazda MX-530.0%– 84.2%161280.0%– 50.0%166146146MG HS30.0%– 83.3%149990.0%– 37.3%125112147Nissan Terra30.0%– 80.0%154690.0%– 37.8%140130148Mazda CX-930.0%– 78.6%130420.0%– 68.7%159119149BMW X430.0%+ 0.0%138170.0%– 71.7%178148150Mercedes Sprinter30.0%+ 200.0%116440.0%+ 4300.0%158155151Toyota Vios20.0%– 94.9%1481100.0%– 70.7%12276152Nissan Kicks20.0%– 90.0% –740.0%– 39.8%134123153Nissan Magnite20.0%– 75.0% –1210.0%– 46.5%11897154Mini Clubman20.0%– 60.0%156650.0%+ 97.0%143144155BMW 8 Series20.0%– 33.3% –30.0%– 87.0%194166156Mercedes EQE20.0%n/a150220.0%– 12.0%170153157Mercedes CLE20.0%new –180.0%new174 –158Volvo EX3020.0%new17030.0%new198 –159Honda City10.0%– 99.5% –3360.1%– 87.1%8741160BMW X610.0%– 95.0%139500.0%+ 100.0%152161161Toyota GR 8610.0%– 91.7%163450.0%– 42.3%157132162Toyota Supra10.0%– 87.5%16870.0%– 46.2%183170163Hyundai Staria10.0%– 75.0%121770.0%– 28.7%132121164Subaru WRX10.0%– 66.7%140520.0%– 49.0%151129165BMW XM10.0%– 66.7%15560.0%– 50.0%184172166Audi Q810.0%+ 0.0% –40.0%– 55.6%189174167Haval H610.0%new128640.0%new144 –168Mitsubishi L100 EV10.0%new88460.0%new156 –169Volvo XC4010.0%n/a167320.0%n/a165 –170Volvo XC9010.0%n/a143210.0%n/a172 –171Audi A810.0%n/a –30.0%+ 200.0%192197
Source: GAIKINDO
More Stories
Why the New AC Cobra GT Coupe Is Set to Captivate Drivers Who Love V8 Performance
Celebrating 125 years of automotive history, AC Cars has unveiled the production version of the highly anticipated AC Cobra GT...
How to Save on Fuel Without Changing Your Driving Habits
Fuel costs can take a significant bite out of both personal and business budgets, especially as prices fluctuate with market...
Dodge Bottles Muscle Car Attitude Just in Time for Father’s Day With New Charger Fragrance
If you’ve been struggling to find the perfect Father’s Day gift for the car enthusiast in your life, Dodge may...
2026 Land Rover Range Rover SE LWB 7-Seat Review & Test Drive
The Range Rover occupies a very unique space in the automotive world, one that very few vehicles have ever challenged....
China wholesales May 2026: Leapmotor, Zeekr, Tesla defy market down -22.1%, exports up 75.1%
Zeekr reaches a record volume in May. The 9X is its best-seller. Domestic sales of locally made Passenger Vehicles continue...
Luxembourg May 2026: BMW most popular in negative market
BMW is the best-selling brand in Luxembourg in May. The Luxembourg new car market edges down -3% year-on-year in May...