
Indonesia August 2025: Mitsubishi Destinator cracks Top 10 in mediocre market (-19%)
The Mitsubishi Destinator is up to 8th place in Indonesia in August.
New vehicle wholesales in Indonesia sink -19% year-on-year in August to just 61,780 units. Keep in mind August 2024 was already down -14.1% on 2023 which was down -8.3% on 2022. This leads to a year-to-date tally down -10.6% to 500,951. Retail sales crash -13.4% to 66,478 for the month and are down -10.7% YTD to 522,162.
In the brands wholesales ranking, Toyota (-29.5%) and Daihatsu (-28.8%) both fall even faster than the market to 29.7% and 15.9% share respectively. Mitsubishi (+8.4%) defies the negative mood and gains two spots on July to #3, dislodging Suzuki (+12.3%), also in great shape, and Honda (-42.1%), imploding. Isuzu (+9.5%) is the only additional gainer in the Top 10. Retail-wise, Toyota (-19.1%) and Daihatsu (-22.1%) lead above Mitsubishi (+2.2%), Suzuki (+5.5%) and Honda (-37.6%). BYD (+14.9%) and Chery (+94.9%) shine.
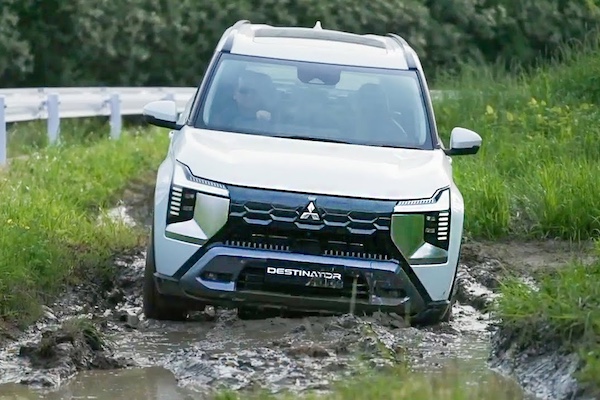
Over in the models charts, the Toyota Kijang Innova (-42.8%) remains the best-seller despite cratering year-on-year. It distances the Daihatsu Gran Max Pikap (-13.5%) and Toyota Avanza (-34.4%). The Suzuki Carry Pikap (+17.3%) ignores the surrounding gloom and gains two spots on last month to #4 while the Daihatsu Sigra (-51.5%) freefalls and rounds out the Top 5. The event of the month is the 8th place of the new Mitsubishi Destinator for its second appearance in the ranking with a splendid 3.6% share. Another instant blockbuster is the Suzuki Fronx albeit sliding outside the Top 10 this month to #12. Notice also the BYD M6 (+342%) back up 8 ranks to #13.
Previous month: Indonesia July 2025: Market down -18.3%, Suzuki Fronx confirms instant success
One year ago: Indonesia August 2024: BYD up to #6 with 3.9% share, Toyota Kijang Innova now #1 YTD
Full August 2025 Top 43 All brands (wholesales and retail) and Top 197 All models (wholesales) below.
Note: The brands rankings include medium and heavy commercial vehicles, the models rankings don’t.
Indonesia August 2025 – brands (wholesales):
PosBrandAug-25%/24Jul2025%/24PosFY241Toyota18,32829.7%– 29.5%1161,07932.2%– 11.9%112Daihatsu9,84615.9%– 28.8%284,70216.9%– 25.2%223Mitsubishi6,78111.0%+ 8.4%542,8738.6%– 11.4%344Suzuki5,9119.6%+ 12.3%339,1017.8%– 10.7%555Honda4,3757.1%– 42.1%442,2918.4%– 31.1%436BYD2,5624.1%– 12.9%618,9893.8%+ 193.9%6117Mitsubishi Fuso2,2013.6%– 3.3%815,5143.1%– 12.5%868Isuzu2,1933.5%+ 9.5%715,6583.1%– 14.9%779Hino1,4242.3%– 38.6%1011,0902.2%– 23.1%11810Wuling1,4112.3%– 24.4%1110,9252.2%– 8.3%121011Hyundai1,4012.3%– 23.1%1213,8282.8%– 11.2%9912Chery1,1791.9%+ 47.7%913,0552.6%+ 136.6%101213Aion7251.2%new143,8510.8%new142114Jaecoo3180.5%new –4380.1%new31 –15Mazda3170.5%– 39.5%161,9940.4%– 34.3%161416Denza2920.5%new136,5481.3%new13 –17FAW2580.4%+ 303.1%266850.1%+ 19.8%272418GWM2410.4%+ 315.5%347920.2%+ 165.8%26n/a19Mercedes2290.4%– 59.4%181,4180.3%– 43.2%191620Geely2240.4%new171,7320.3%new17 –21Xpeng1900.3%new252600.1%new35 –22BMW 1440.2%– 67.2%249800.2%– 63.1%231323Vinfast1390.2%new152,6850.5%new15 –24MG1390.2%– 72.4%191,2290.2%– 59.0%221525Lexus1350.2%– 30.4%231,2320.2%– 35.5%211726Jetour970.2%new274300.1%new32 –27Nissan840.1%– 36.4%208210.2%+ 14.3%251928Dongfeng (DFSK)800.1%+ 27.0%285480.1%– 3.7%282529BAIC780.1%+ 14.7%291,5840.3%+ 2229.4%183130Citroen770.1%– 31.3%229160.2%+ 8.8%242031Mini750.1%– 44.9%333410.1%– 47.5%342332Ford640.1%– 8.6%304910.1%– 8.2%292633UD Trucks560.1%– 69.1%211,2910.3%– 2.2%201834Subaru480.1%– 35.1%352010.0%– 49.9%362935Volkswagen360.1%+ 300.0%371790.0%+ 193.4%373536Scania340.1%– 20.9%313570.1%+ 31.3%333037Neta330.1%– 56.0%324660.1%+ 29.1%302838Polytron210.0%new36430.0%new42 –39Volvo160.0%+ 14.3%38780.0%– 9.3%393240Maxus120.0%new39980.0%new38 –41Kia 30.0%– 95.0%40730.0%– 91.6%412242Seres20.0%n/a –750.0%+ 1.4%403443Audi10.0%– 75.0% –100.0%– 50.0%4337
Indonesia August 2025 – brands (retail):
PosBrandAug-25%/24Jul2025%/24PosFY241Toyota20,73331.2%– 19.1%1167,81132.1%– 12.6%112Daihatsu11,00816.6%– 22.1%288,94417.0%– 24.2%223Mitsubishi6,1619.3%+ 2.2%543,4218.3%– 12.0%444Suzuki5,7008.6%+ 5.5%338,9737.5%– 14.9%555Honda5,3178.0%– 37.6%449,5139.5%– 27.1%336BYD 2,7464.1%+ 14.9%619,2783.7%+ 334.6%6117Isuzu2,1853.3%– 0.8%815,2782.9%– 18.5%868Mitsubishi Fuso2,0663.1%– 13.4%715,7023.0%– 11.4%779Hino1,6162.4%– 24.1%1113,3932.6%– 3.9%10910Wuling1,5462.3%– 34.0%1012,5172.4%– 20.3%12811Chery1,4852.2%+ 94.9%913,0022.5%+ 142.4%111212Hyundai1,4092.1%– 9.4%1214,3942.8%– 9.8%91013Aion6811.0%new134,1680.8%new142214Denza5420.8%new146,0581.2%new13 –15Mazda3330.5%– 34.3%152,0910.4%– 30.7%161316Jaecoo2900.4%new –2900.1%new34 –17Geely2810.4%new171,2800.2%new19 –18BMW 2740.4%– 34.1%191,5370.3%– 38.6%181619FAW2580.4%+ 303.1%256850.1%+ 19.8%252520Mercedes2420.4%– 41.0%161,8110.3%– 29.0%171521GWM2100.3%+ 218.2%326710.1%+ 170.6%26n/a22Lexus1830.3%– 31.7%231,1040.2%– 44.8%211723MG1510.2%– 70.8%201,2790.2%– 56.9%201424Vinfast1340.2%new182,4680.5%new15 –25Xpeng1210.2%new291770.0%new38 –26Jetour1010.2%new243730.1%new29 –27Citroen980.1%– 8.4%218640.2%+ 85.0%232328Dongfeng (DFSK)780.1%+ 21.9%285510.1%– 30.2%282129Ford770.1%+ 35.1%275530.1%– 1.4%272630Nissan750.1%– 46.8%267330.1%– 4.9%241931BAIC750.1%+ 257.1%303660.1%+ 1642.9%323132Mini690.1%– 41.0%313680.1%– 39.8%302433Subaru600.1%– 21.1%342140.0%– 49.4%362734UD Trucks430.1%– 78.2%229230.2%– 21.3%221835Volkswagen350.1%+ 337.5%371800.0%+ 146.6%373336Kia 280.0%– 82.7%362230.0%– 77.1%352037Neta230.0%– 66.2%353680.1%+ 11.2%312938Volvo160.0%+ 14.3%39780.0%– 9.3%403239Polytron120.0%new41180.0%new42 –40Maxus 80.0%new40740.0%new41 –41Seres70.0%– 30.0%38980.0%+ 34.2%393442Audi10.0%– 75.0% –100.0%– 47.4%433843Scania00.0%– 100.0%333230.1%+ 18.8%3330
Indonesia August 2025 – models (wholesales):
PosModelAug-25%/24Jul2025%/24PosFY241Toyota Kijang Innova3,7416.1%– 42.8%139,1597.8%– 3.7%112Daihatsu Gran Max Pikap (PU)3,6015.8%– 13.5%322,8384.6%– 26.1%553Toyota Avanza3,1485.1%– 34.4%225,4145.1%– 23.0%324Suzuki Carry Pikap2,6894.4%+ 17.3%616,8303.4%– 15.3%995Daihatsu Sigra2,3773.8%– 51.5%426,3575.3%– 34.8%236Honda Brio2,3463.8%– 50.5%824,6124.9%– 25.8%447Toyota Calya2,2853.7%– 33.7%519,0893.8%– 24.5%768Mitsubishi Destinator 2,2133.6%new362,5710.5%new39 –9Toyota Rush1,9493.2%– 35.4%719,7743.9%– 10.4%6810Toyota Hilux1,7602.8%+ 3.4%149,8962.0%+ 5.5%121911Mitsubishi Xpander1,7462.8%– 35.1%1016,8733.4%– 27.0%8712Suzuki Fronx1,5012.4%new95,4801.1%new27 –13BYD M61,3792.2%+ 342.0%218,5221.7%+ 2321.0%153114Honda HR-V1,3422.2%+ 30.4%118,2511.6%– 18.9%161315Daihatsu Terios1,2982.1%– 6.1%1310,9712.2%– 10.3%101116Mitsubishi L-300 Pikap1,0771.7%+ 2.3%207,6341.5%– 3.6%182017Daihatsu Gran Max BV/MB1,0111.6%+ 749.6%128,9821.8%+ 71.9%142718Isuzu Traga PHR1,0071.6%+ 28.6%176,9271.4%+ 4.0%202319Toyota Fortuner9741.6%+ 459.8%159,5321.9%+ 22.3%131520Daihatsu Ayla8981.5%– 48.6%238,1931.6%– 26.8%171221Toyota Raize8351.4%– 25.1%266,7121.3%– 19.4%211822Hyundai Stargazer7991.3%– 3.9%245,8091.2%– 30.4%262123Toyota Agya7971.3%– 51.1%169,8982.0%– 26.8%111024Mitsubishi L200 Triton7471.2%+ 49.4%196,4631.3%+ 37.9%242625Wuling Binguo7461.2%+ 460.9%322,5100.5%– 35.2%413326Toyota Hiace7051.1%+ 8.8%274,5800.9%+ 42.9%292827Mitsubishi Pajero Sport6561.1%– 43.8%256,0081.2%– 31.2%251628Toyota Veloz6401.0%– 50.0%227,2811.5%– 23.0%191429Aion V6171.0%new371,7180.3%new50 –30BYD Sealion 76021.0%new186,5791.3%new22 –31Toyota Hilux Rangga6011.0%+ 670.5%353,5820.7%+ 1673.3%365032Suzuki XL75060.8%– 24.0%344,8461.0%– 30.4%282233Suzuki Alpha4950.8%+ 9.5%443,3760.7%+ 29.0%373734BYD Atto 34540.7%– 52.8%331,8180.4%– 15.6%474435Chery Tiggo 83920.6%+ 1468.0%303,9180.8%+ 3494.5%336136Mitsubishi Xforce3400.6%– 57.7%522,5100.5%– 35.2%423037Chery iCar 033250.5%new314,5100.9%new308038Jaecoo J73180.5%new –4380.1%new81 –39Daihatsu Xenia3140.5%– 63.4%393,8060.8%– 50.9%342440Denza D92920.5%new286,5481.3%new23 –41Honda BR-V2900.5%– 44.6%294,3850.9%– 38.2%312542Suzuki APV Minibus2700.4%– 30.9%491,2960.3%– 39.8%584643Toyota Yaris Cross2400.4%– 46.3%402,1960.4%– 28.2%433644Daihatsu Luxio2390.4%– 13.4%471,6150.3%– 10.6%544845Geely EX5 Max2240.4%new451,7320.3%new49 –46Honda WR-V2180.4%– 78.8%413,6210.7%– 50.7%351747Hyundai Creta2180.4%– 49.1%464,1780.8%+ 3.3%323448Chery Omoda E51960.3%– 56.3%638850.2%– 74.6%663949Hyundai Palisade1840.3%+ 35.3%541,1020.2%– 9.7%615550Toyota Alphard1820.3%– 66.8%611,6680.3%– 45.3%513251Wuling Cloud1740.3%– 48.8%431,8390.4%– 24.5%464252Wuling Alvez1690.3%– 37.2%661,1270.2%– 6.6%604953Wuling Air1660.3%– 58.9%422,9470.6%+ 77.9%383854GWM Ora 031640.3%new –1740.0%new106 –55Suzuki Jimny1490.2%+ 33.0%552,0200.4%+ 55.9%445156Toyota Voxy1470.2%– 29.7%717080.1%– 44.6%695457Suzuki S-Presso1320.2%– 45.5%531,0460.2%– 47.1%634758Xpeng X91230.2%new791710.0%new107 –59Suzuki Grand Vitara1210.2%– 39.8%511,4900.3%+ 2.1%555360Chery Tiggo Cross1120.2%new382,5160.5%new40 –61Mazda CX-31120.2%– 17.6%655120.1%– 36.6%756362Vinfast VF 31100.2%new481,2490.2%new59 –63Aion Hyptec960.2%new861,6250.3%new53 –64Honda Step WGN870.1%new851260.0%new119 –65Chery Omoda 5860.1%– 20.4%505630.1%– 47.2%715666Hyundai Ioniq 5860.1%– 52.7%1046450.1%– 34.8%706067MG 4840.1%– 69.1%588870.2%– 52.3%655268Daihatsu Rocky820.1%– 78.2%561,8140.4%– 37.4%484069Mazda CX-5820.1%– 48.1%625060.1%– 53.7%786270BYD Dolphin780.1%– 81.3%935070.1%– 29.0%776671BAIC BJ40 Plus750.1%+ 74.4%803210.1%+ 646.5%8712372Lexus LM710.1%– 47.8%748300.2%– 22.6%675973Mazda3700.1%– 19.5%735520.1%+ 16.0%727574Nissan Serena700.1%– 45.7%574730.1%+ 57.1%796975Honda CR-V670.1%– 57.1%843010.1%– 88.4%894376Xpeng G6670.1%new92940.0%new130 –77Chery Tiggo 8 Pro630.1%n/a1731270.0%+ 170.2%11816778GWM Tank 300620.1%new1192650.1%new9210679Jetour Dashing580.1%new882670.1%new90 –80Mercedes GLC580.1%+ 205.3%971800.0%– 6.3%10410381DFSK Mini Truck570.1%+ 14.0%724270.1%– 2.3%827882Toyota Land Cruiser 300520.1%– 58.7%764180.1%– 59.5%835883Mini Cooper510.1%– 45.7%952390.0%– 22.1%968584BYD Seal490.1%– 96.1%671,0480.2%– 67.7%623585Suzuki Ertiga480.1%– 87.4%831,6340.3%– 62.7%522986Toyota Camry480.1%– 45.5%1071630.0%– 26.9%11010287Toyota Land Cruiser 70450.1%n/a –470.0%+ 38.2%15517388BMW X7440.1%+ 780.0%133720.0%+ 9.1%14113789Wuling Formo420.1%+ 68.0%1098210.2%+ 103.7%685790Hyundai Kona410.1%– 77.5%1122670.1%– 37.9%916591Citroen C3 Aircross SUV400.1%– 51.8%753830.1%– 26.3%847392Jetour X70P390.1%new901630.0%new109 –93Lexus RX380.1%+ 40.7%1032540.1%– 60.1%957494Citroen C3370.1%+ 27.6%685280.1%+ 64.0%738695Hyundai Santa Fe360.1%– 28.0%1101,4470.3%+ 245.3%566896Ford Everest330.1%– 10.8%1022640.1%– 15.1%938497Wuling Cortez330.1%+ 200.0%825150.1%+ 192.6%7410598Ford Ranger310.1%– 6.1%962190.0%– 2.2%979899MG ZS310.1%– 78.3%912540.1%– 56.7%9472100Mini Countryman280.0%– 30.0%115780.0%– 72.1%13697101Neta V270.0%– 64.0%893700.1%+ 2.5%8581102Mazda CX-60240.0%– 41.5%1061980.0%+ 32.0%98107103Subaru Forester240.0%+ 41.2%98880.0%– 8.3%134122104Dongfeng Gelora230.0%+ 360.0%1471210.0%+ 11.0%121132105Honda Civic230.0%– 61.7%811390.0%– 75.1%11376106Mercedes E-Class230.0%– 78.5%1001690.0%+ 34.1%108101107Wuling Mitra 230.0%new –230.0%new180 –108BMW i4210.0%n/a114390.0%+ 105.3%162176109Daihatsu Sirion200.0%n/a1011200.0%+ 0.0%122117110Mercedes C-Class200.0%– 76.5%771510.0%– 59.0%11289111VW Tiguan200.0%+ 122.2%130460.0%– 13.2%157155112Vinfast VF e34180.0%new641,3690.3%new57 –113Isuzu D-Max170.0%n/a591840.0%– 10.2%102111114Lexus LX170.0%+ 0.0%124470.0%– 60.8%153116115Mercedes GLA170.0%+ 21.4%151480.0%– 71.6%152110116Polytron G3+170.0%new122280.0%new174 –117Toyota Vellfire150.0%– 53.1%1293080.1%– 4.0%8883118Toyota Yaris150.0%– 57.1%1051360.0%– 55.8%11492119VW ID.BUZZ150.0%new132930.0%new132 –120BMW 2 Series140.0%– 44.0%118660.0%– 61.6%14296121Mazda CX-8130.0%– 58.1%99770.0%– 18.9%138131122MG 5 GT130.0%– 58.1%126460.0%– 76.8%156108123Aion Y Plus120.0%new785080.1%new7664124Maxus MIFA 7120.0%new148360.0%new167 –125Toyota Corolla120.0%– 36.8%131400.0%– 69.2%161113126BMW i5110.0%– 8.3%87570.0%– 1.7%148134127BMW X3110.0%– 74.4%157600.0%– 77.5%14682128Isuzu MU-X110.0%n/a601810.0%+ 158.6%103145129Toyota Corolla Cross110.0%– 26.7%135990.0%+ 80.0%127136130Mazda6100.0%+ 400.0%138330.0%+ 43.5%168174131Subaru BRZ100.0%– 28.6%163470.0%– 21.7%154135132Mercedes GLE90.0%+ 12.5%1251930.0%– 19.6%99100133BMW X580.0%– 83.3%1391160.0%– 66.1%12379134MG VS HEV80.0%– 85.5%134250.0%– 90.3%17799135Volvo EX3080.0%+ 700.0%155240.0%+ 2300.0%178192136BMW i370.0%new –70.0%new204 –137BMW IX170.0%– 78.1%1361130.0%+ 44.9%124104138GWM Tank 50070.0%– 86.3%1201350.0%– 42.6%11588139Hyundai Genesis70.0%n/a –70.0%n/a205 –140Nissan Livina70.0%+ 600.0%1161330.0%– 12.5%116121141Toyota bZ4X70.0%– 78.1%117380.0%– 24.0%163128142BMW 4 Series60.0%– 71.4%141540.0%– 10.0%149114143Hyundai Staria60.0%– 45.5%177330.0%– 56.6%169138144Mazda MX-560.0%+ 500.0%182260.0%+ 4.0%176171145Mercedes AMG GT60.0%n/a –60.0%n/a209 –146Neta X60.0%new1281210.0%new120127147Subaru WRX60.0%+ 50.0%1653410.1%+ 568.6%86156148GWM Haval H650.0%– 28.6%176210.0%– 66.7%186139149Nissan Terra50.0%+ 150.0%140380.0%– 42.4%164146150Subaru Crosstrek50.0%– 83.3% –510.0%– 66.2%151119151Volvo XC6050.0%+ 25.0%167210.0%+ 31.3%185182152Wuling Almaz50.0%– 95.2%1081910.0%– 74.0%10067153BMW X140.0%– 92.3%1421100.0%– 71.6%12577154Mercedes A-Class40.0%– 84.0% –180.0%– 87.0%191118155Mercedes GLS40.0%– 63.6%121840.0%+ 75.0%135150156Mercedes Sprinter40.0%– 71.4%153200.0%– 51.2%188164157Polytron G340.0%new123150.0%new193 –158Vinfast VF 540.0%new190600.0%new147 –159Vinfast VF 740.0%new –40.0%new217 –160BAIC X-5530.0%– 88.0%127650.0%+ 160.0%143151161BMW X630.0%– 40.0%169110.0%– 77.6%197162162BMW Z430.0%– 62.5%158220.0%– 63.9%182142163Chery Tiggo 5X30.0%– 98.5%1711330.0%– 77.0%11770164GWM Haval Jolion30.0%new1371770.0%new105 –165Lexus LBX30.0%– 50.0%179310.0%+ 106.7%172158166Mercedes EQE30.0%+ 0.0%184150.0%– 25.0%194175167MG HS30.0%+ 0.0%18650.0%– 94.8%212140168Subaru Outback30.0%– 66.7%164140.0%– 67.4%195161169Toyota Vios30.0%+ 0.0%166750.0%– 30.6%139124170Vinfast VF 630.0%new –30.0%new223 –171BMW XM20.0%+ 0.0%146220.0%+ 340.0%181194172Chery Tiggo 7 Pro20.0%– 83.3%172320.0%– 63.6%170125173Honda e:N120.0%new111640.0%new144 –174Lexus ES20.0%+ 100.0%160210.0%– 8.7%184178175Lexus NX20.0%– 60.0%113400.0%– 20.0%160149176Mercedes EQS20.0%n/a18570.0%– 36.4%202188177Mercedes GLB20.0%+ 100.0%144120.0%– 71.4%196165178Mercedes S-Class20.0%– 60.0%152200.0%– 66.7%187148179Mitsubishi L100 EV20.0%– 94.7%162370.0%– 17.8%165160180Nissan Kicks20.0%n/a188220.0%– 69.4%183152181Seres E50220.0%n/a –750.0%+ 1.4%140144182Volvo EC4020.0%new18960.0%new208 –183Audi Q310.0%– 50.0% –20.0%– 60.0%225198184BMW i710.0%– 75.0% –190.0%– 80.0%190133185BMW i810.0%n/a –10.0%n/a241 –186Hyundai Tucson10.0%n/a94900.0%n/a133147187Kia Carens10.0%– 95.7%15970.0%– 96.8%201109188Kia Seltos10.0%n/a –10.0%– 92.9%238153189Kia Sonet10.0%– 50.0%178320.0%– 92.1%17187190Lexus LC10.0%n/a –10.0%– 50.0%239211191Lexus LS10.0%n/a –10.0%n/a240 –192Mini Aceman10.0%new187240.0%new179179193Toyota Crown10.0%n/a –10.0%n/a242 –194Toyota GR 8610.0%+ 0.0%154960.0%+ 118.2%129159195Toyota Supra10.0%+ 0.0% –50.0%– 16.7%213195196Volvo XC9010.0%– 75.0%145170.0%– 15.0%192180197VW T-Cross10.0%n/a –30.0%– 62.5%222187
Source: GAIKINDO
More Stories
Uruguay November 2025: Chevrolet repeats at #1 with 15.2% share
Chevrolet holds 15.2% of the Uruguayan market in November. New light vehicle sales in Uruguay are off -1.1% year-on-year in...
How Mechanical Design Influences the Feel of a Vehicle
You know that feeling. You slide into the driver’s seat. You press the start button. The vehicle comes alive. It...
Competition Time. Chance to win a Smallest Cog goodies bundle.
The Smallest Cog Unveils Exciting New Merchandise Range Inspired by Richard Hammond’s iconic restoration workshop, The Smallest Cog’s exclusive new...
Florida Tolls Could Vanish for Residents as Tourists Pick Up the Tab
Florida drivers may eventually cruise the Turnpike without paying a cent at the toll gantries if a new idea from...
Extending Vehicle Lifespan Through Proven Engine Technology
We all want our cars to last. A vehicle is a major investment. It gets us to work. It takes...
China retail November 2025: Fang Cheng Bao, Lynk & Co hit all-time highs, market off -16.8% on high year ago basis
This content is for members only. Visit the site and log in/register to read.