
Canada August 2025: Hyundai (+20.2%), Toyota (+16%) best performers in negative market
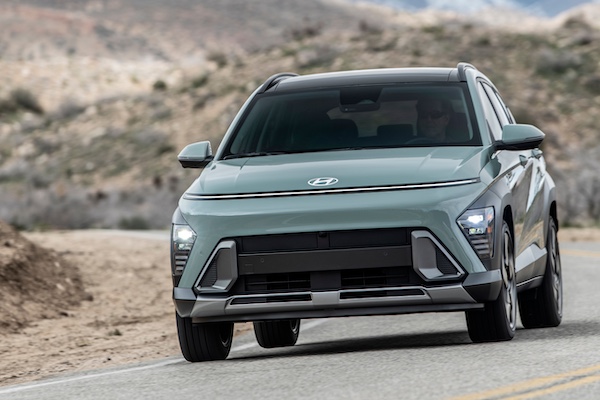
Hyundai Kona sales are up 68.3% year-on-year in August.
Note: This article only contains data for the brands reporting monthly.
Local consultancy DesRosiers Automotive estimate the Canadian new light vehicle market to drop -2.9% year-on-year in August to 160,000 units. We remain well below the average of 180,000+ sales over the 2017-2019 period. This is the first YoY decline since February. Year-to-date volumes are up 5.7% to 1,290,000 and the SAAR for the month establishes itself at 1.76 million, the lowest so far in 2025.
Toyota Motor (+14.4%) and Hyundai-Kia (+15.8%) both surge ahead and end the month within 116 units of each other while Honda Canada (-2.6%) matches the market. Brand-wise, Hyundai (+20.2%) and Toyota (+16%) fare best with Genesis (+14.8%) and Volvo (+13.2%) also posting double-digit gains. Kia (+9.6%), Lexus (+3.4%) and Acura (+3%) are in positive but Mazda (-2%), Honda (-3%) and Subaru (-11.9%) decline.
Looking at models with available monthly data, near the top the Toyota Tacoma (+104.2%), Mazda3 (+100.6%), Hyundai Kona (+68.3%), Tucson (+58.9%), Kia Sportage (+39.4%) and Seltos (+39%) shine, with the Toyota RAV4 (+16%) back above its archenemy the Honda CR-V (-18%). The Hyundai Venue (+50.2%), Mazda CX-30 (+35.1%), Toyota Prius (+28.7%) and Corolla Cross (+26.1%) also make themselves noticed.
Previous month: Canada July 2025: Toyota (+29.5%), Hyundai (+22.1%) highlight solid market (+6.9%)
One year ago: Canada August 2024: Mazda (+57.4%), Subaru (+33.6%) shine, Honda CR-V above Toyota RAV4
Full August 2025 data for OEMs, brands and models reported monthly below.
Canada August 2025 – OEMs:
OEMAug-25/242025/24Toyota Motor Co.21,848+ 14.4%169,062+ 4.5%Hyundai-Kia21,732+ 15.8%173,615+ 13.7%Honda Canada12,364– 2.6%100,847+ 15.0%Mazda8,274– 2.0%56,021+ 15.7%Subaru5,170– 11.9%49,998+ 6.8%Volvo Cars Canada1,220+ 13.2%9,064+ 5.7%
Canada August 2025 – brands:
BrandAug-25/242025/24Toyota19,346+ 16.0%145,700+ 2.5%Hyundai12,853+ 20.2%101,128+ 14.9%Honda11,338– 3.0%91,843+ 15.1%Mazda8,274– 2.0%56,021+ 15.7%Kia8,121+ 9.6%67,062+ 11.5%Subaru5,170– 11.9%49,998+ 6.8%Lexus2,502+ 3.4%23,362+ 18.9%Volvo1,220+ 13.2%9,064+ 5.7%Acura1,025+ 3.0%9,003+ 13.7%Genesis758+ 14.8%5,425+ 19.1%
Canada August 2025 – models:
ModelAug-25/242025/24Toyota RAV46,351+ 16.0%53,407+ 1.7%Honda CR-V4,502– 18.0%39,402+ 7.5%Hyundai Tucson3,450+ 58.9%26,327+ 35.1%Hyundai Kona3,299+ 68.3%22,440+ 0.7%Subaru Crosstrek3,127+ 10.1%22,825+ 14.0%Honda Civic2,778+ 6.5%23,057+ 18.7%Mazda CX-52,732– 26.7%17,349+ 1.3%Kia Seltos2,131+ 39.0%13,725– 3.6%Kia Sportage2,063+ 39.4%16,664+ 29.3%Mazda32,060+ 100.6%9,976+ 44.0%Toyota Tacoma1,944+ 104.2%10,595+ 54.8%Toyota Corolla1,921+ 6.4%18,009– 2.6%Hyundai Elantra1,807+ 0.2%17,939+ 32.7%Honda HR-V1,690+ 1.1%11,026+ 10.5%Mazda CX-301,610+ 35.1%11,113+ 11.9%Hyundai Venue1,485+ 50.2%10,585+ 36.1%Toyota Sienna1,380+ 7.4%8,952+ 17.6%Toyota Corolla Cross1,310+ 26.1%13,037+ 13.5%Toyota Prius1,185+ 28.7%5,428+ 55.6%Subaru Forester1,183– 5.1%14,619+ 32.0%Kia Niro1,120+ 157.5%6,505+ 42.1%Toyota Camry1,073+ 144.4%5,386– 33.6%Kia K41,045new10,067newHyundai Palisade1,028+ 37.2%5,656+ 4.0%Toyota Grand Highlander1,025+ 20400.0%6,712+ 71.1%Lexus RX961+ 11.2%7,241+ 4.1%Hyundai Santa Fe864– 33.5%9,202+ 16.9%Mazda CX-90851– 21.1%5,681+ 19.7%Toyota Tundra784– 50.1%8,541– 11.6%Toyota 4Runner723+ 92.3%3,795+ 22.3%Honda Pilot701– 6.0%5,925+ 37.0%Toyota Highlander667– 17.1%3,729– 34.4%Kia Sorento640– 42.3%9,601+ 48.5%Lexus NX619– 22.1%8,291+ 44.1%Honda Passport578+ 217.6%3,087+ 69.2%Kia Carnival536+ 97.8%4,156+ 33.7%Mazda CX-70502+ 78.0%3,652+ 113.6%Genesis GV70501+ 24.9%3,581+ 23.4%Acura RDX434– 24.5%4,139+ 4.2%Toyota bZ4X430– 59.3%2,162– 48.6%Mazda CX-50423– 59.6%7,343+ 8.4%Kia EV9405– 7.1%2,614+ 4.5%Volvo XC60398– 8.9%3,106– 7.4%Hyundai Ioniq 6382+ 114.6%1,279– 32.8%Subaru Impreza374+ 53.3%2,049– 11.5%Honda Odyssey366– 8.3%3,630+ 23.1%Volvo XC90339+ 59.9%2,345+ 42.6%Honda Accord316– 0.3%2,573+ 16.0%Volvo XC40303+ 22.7%2,455+ 7.2%Honda Ridgeline299+ 35.9%2,516+ 7.7%Lexus TX275+ 2400.0%1,829+ 29.5%Toyota Crown Signia249+ 2390.0%1,503+ 14930.0%Lexus UX241– 15.1%2,368+ 20.0%Acura ADX235new851newAcura MDX233– 16.8%2,759+ 0.9%Hyundai Ioniq 9193new606newHyundai Sonata187– 11.4%1,764+ 42.7%Subaru WRX187– 24.9%1,855+ 3.9%Lexus IS157– 10.8%1,061– 17.2%Hyundai Ioniq 5155– 86.6%3,860– 42.9%Genesis GV80151+ 2.7%1,172+ 51.8%Subaru Outback147– 82.1%5,089– 35.1%Volvo EX30131+ 122.0%586+ 893.2%Toyota Land Cruiser114– 74.4%2,595+ 97.8%Honda Prologue109+ 91.2%647+ 574.0%Mazda MX-5 Miata96+ 9.1%897– 0.1%Kia Telluride94– 69.5%2,069– 5.4%Kia EV685– 83.5%911– 80.1%Lexus ES83– 25.9%665– 10.9%Genesis G7075– 2.6%413– 27.7%Acura TLX73+ 65.9%451– 17.1%Toyota Sequoia66– 13.2%724+ 4.6%Lexus GX62+ 1.6%1,002+ 133.6%Subaru BRZ59– 20.3%714+ 28.2%Subaru Ascent57– 74.4%1,663– 6.8%Toyota 8647– 26.6%501– 19.7%Toyota Supra42+ 20.0%338+ 77.9%Acura Integra41– 49.4%611– 1.8%Lexus LX40– 32.2%524+ 6.7%Lexus RZ37+ 5.7%185– 53.5%Subaru Solterra36– 78.6%1,183– 12.1%Toyota Crown30– 38.8%265– 56.7%Volvo S60/V6026– 66.2%305– 57.8%Genesis GV6015– 46.4%125– 26.9%Lexus LC15+ 87.5%119+ 12.3%Genesis G8013+ 85.7%116– 7.9%Acura ZDX9– 40.0%192+ 380.0%Lexus RC9– 30.8%56– 35.6%Volvo C409– 70.0%85– 76.3%Volvo S90/V908– 50.0%79– 44.8%Volvo EX907+ 133.3%103+ 3333.3%Toyota Mirai5+ 400.0%6– 60.0%Genesis G903n/a19+ 58.3%Hyundai Santa Cruz3– 98.3%1,463– 16.2%Lexus LS3+ 50.0%21+ 5.0%Kia Forte2– 99.8%47– 99.4%
Source: Manufacturers


More Stories
Hungary Full Year 2025: Suzuki S-Cross signs third win in past four years
This content is for members only. Visit the site and log in/register to read.
Czechia Full Year 2025: Skoda Octavia and Kamiq dominate strong market (+7.4%)
This content is for members only. Visit the site and log in/register to read.
Switzerland Full Year 2025: First win for the VW Tiguan
This content is for members only. Visit the site and log in/register to read.
Germany Full Year 2025: VW Golf celebrates 45 straight years at #1
This content is for members only. Visit the site and log in/register to read.
Portugal Full Year 2025: Renault Clio snaps last minute first win in 5 years
This content is for members only. Visit the site and log in/register to read.
Norway Full Year 2025: Record market (+39.5%), Tesla and Model Y at all time high
This content is for members only. Visit the site and log in/register to read.