
Taiwan August 2025: Toyota Corolla Cross and Tesla Model Y on top
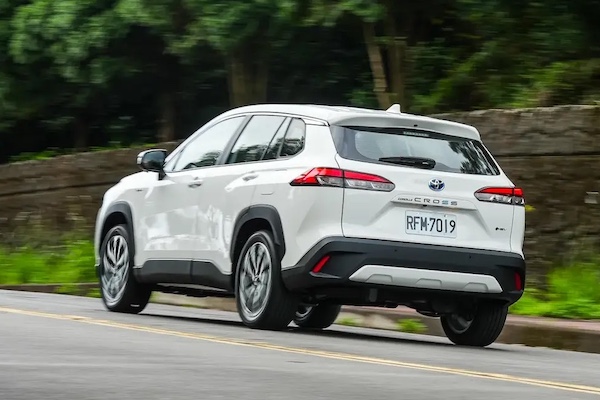
The Toyota Corolla Cross holds 11.6% of the Taiwanese new car market in August.
New light vehicle sales in Taiwan are stable in August at +0.2% to 29,460 but the year-to-date tally drops -14.2% to 263,910. Given August 2024 was off -17% on the year prior, this remains a poor score. Last year, registrations were negatively impacted by a new control system for Chinese components assembled in Taiwan implemented on August 1. This year, the negative impact comes from a wait and see attitude of car buyers as decisions about excise tax reduction were being taken by the government. Notably, the NT$50,000 excise tax reduction for trade-ins should be extended while a NT$50,000 excise tax reduction should also be added for purchases of passenger cars under 2,000cc.
Spectacularly, the Top 4 carmakers all beat the market with at least double digit gains. Toyota (+12.3%) leads the way at 31.6% share, followed by Lexus (+64.8%), Tesla (+118.2%) and CMC (+44%). Tesla sales are still down -15.3% year-to-date. In contrast Honda drops -6.3% to complete the Top 5. Mazda (+2.8%) is the only additional gainer in the Top 10 while Kia (+51.4%) impresses below. The Toyota Corolla Cross (+79.6%) lodges another fantastic month at 11.6% share, it is followed by the Tesla Model Y (+148.9%), unaffected by Musk’s shenanigans. Toyota monopolises the rest of the Top 5 with the Town Ace (-27.8%), RAV4 (-1.6%) and Yaris Cross (+7.9%) in tow. The new CMC J Space is down three spots on July to #6 just as the Honda HR-V (+70.3%) and Lexus NX (+50.2%) also shine near the top.
Previous month: Taiwan July 2025: Toyota Corolla Cross break share record in devastated market (-22.3%)
One year ago: Taiwan August 2024: Toyota Town Ace signs first pole position in mediocre market
Full August 2025 Top 12 brands and Top 50 models below.
Taiwan August 2025 – brands:
PosBrandAug-25%/24Jul2025%/24PosFY241Toyota9,30131.6%+ 12.3%181,67030.9%+ 0.3%112Lexus2,6138.9%+ 64.8%220,4277.7%+ 1.8%223Tesla1,9776.7%+ 118.2%97,9993.0%– 15.3%11114CMC1,6855.7%+ 44.0%316,9836.4%+ 27.0%375Honda1,3984.7%– 6.3%412,9494.9%– 26.9%536Mazda1,1543.9%+ 2.8%88,5383.2%– 10.2%9127Hyundai1,1183.8%– 16.0%611,9954.5%– 23.6%658BMW1,0193.5%– 15.3%711,4174.3%– 14.1%769Mitsubishi1,0103.4%– 6.2%n/a8,7323.3%– 18.7%8910Mercedes8662.9%– 51.3%515,6045.9%– 16.1%4411Kia8042.7%+ 51.4%n/a7,1092.7%+ 0.4%12n/a12Nissan7962.7%– 23.4%108,3243.2%– 36.0%108
Taiwan August 2025 – models:
PosModelAug-25%/24Jul2025%/24PosFY241Toyota Corolla Cross3,41711.6%+ 79.6%128,96511.0%+ 42.3%112Tesla Model Y1,8796.4%+ 148.9%56,1362.3%+ 7.5%7103Toyota Town Ace1,3824.7%– 27.8%211,5144.4%– 22.3%424Toyota RAV41,2514.2%– 1.6%612,3354.7%– 7.2%235Toyota Yaris Cross1,2034.1%+ 7.9%410,2613.9%– 6.5%546CMC J Space1,1814.0%new312,0694.6%new3507Lexus NX9703.3%+ 50.2%77,8053.0%– 11.6%668Toyota Corolla Altis6392.2%– 2.6%95,8862.2%– 23.4%879Honda HR-V6252.1%+ 70.3%83,9971.5%+ 9.3%141810Mitsubishi Delica5812.0%+ 12.8%114,6981.8%– 12.0%111311Honda CR-V4901.7%– 33.2%105,6422.1%– 43.6%9512Lexus RX4881.7%+ 113.1%164,0931.6%+ 5.4%122113Mazda CX-54821.6%+ 58.6%173,0271.1%– 1.4%202214Lexus UX4251.4%+ 50.7%133,2841.2%+ 17.2%173115CMC Zinger4081.4%+ 0.2%144,0391.5%– 24.2%131416Toyota Camry3831.3%+ 34.9%502,3400.9%+ 26.3%263417Hyundai Porter3311.1%n/a212,7251.0%+ 90.0%233318Lexus LBX3241.1%+ 82.0%n/a1,7210.7%+ 14.3%374119Ford Focus3201.1%– 27.9%183,2901.2%– 33.0%161620Nissan Kicks3021.0%+ 9.8%123,3111.3%– 16.7%151921Toyota Vios2700.9%– 22.2%192,8631.1%– 18.2%212422Nissan X-Trail2670.9%– 2.2%232,3730.9%– 45.7%251723Hyundai Tucson2640.9%– 37.1%203,1001.2%– 46.8%191124Honda Fit2620.9%– 23.8%242,7651.0%– 18.0%222025Ford Kuga2610.9%– 13.3%253,2711.2%+ 18.3%182326Mazda32480.8%– 13.0%351,8940.7%– 7.9%343727Kia Sportage2250.8%+ 26.4%292,0690.8%– 33.9%282628Suzuki Swift2130.7%– 41.0%281,9750.7%+ 25.2%294029Toyota Alphard2020.7%n/an/a2,5631.0%n/a24n/a30Lexus LM1940.7%+ 37.6%341,8750.7%+ 114.3%35n/a31Mercedes GLC Class1890.6%– 62.8%154,8911.9%– 14.5%101232Lexus ES1880.6%+ 91.8%491,2850.5%– 18.4%444733Luxgen n71800.6%– 56.4%362,3340.9%– 54.4%271534MG HS1700.6%– 45.0%401,9710.7%– 78.8%30935Mazda CX-601700.6%+ 37.1%426880.3%– 56.7%n/a4536Toyota Crown1640.6%+ 134.3% n/a6690.3%– 56.5%n/a4937Hyundai Venue1570.5%– 15.1%331,9610.7%– 11.4%333238Nissan Sentra1550.5%– 19.3%311,9650.7%– 31.9%323039VW Tiguan1540.5%– 50.0%26n/an/an/an/a3640Suzuki Jimny1530.5%– 26.4%43n/an/an/an/an/a41Mazda CX-301480.5%– 33.6%221,7610.7%+ 11.7%364242Hyundai Custin1460.5%– 41.1%451,9660.7%– 47.3%312843Mitsubishi Colt Plus1420.5%– 25.3%471,4050.5%– 8.8%424344Hyundai Mufasa1420.5%new301,0410.4%new50 –45Fuso Canter1380.5%n/a441,4680.6%n/a40n/a46BMW X31340.5%+ 27.6%46n/an/an/an/an/a47BMW iX11320.4%+ 17.9%n/a9360.4%n/an/an/a48Kia Carnival1270.4%n/a371,4170.5%+ 53.7%41n/a49Peugeot 30081250.4%n/an/an/an/an/an/an/a50Mercedes E Class1180.4%– 57.4%381,5590.6%– 7.8%393951Mercedes GLA Class1180.4%– 13.2%271,0690.4%– 36.7%49n/a
Source: U-car

More Stories
North America EV Market Could Hit $223 Billion by 2032 as Adoption Keeps Building Momentum
The electric vehicle story in North America is no longer just about early adopters, tax credits, or a handful of...
Mercedes-Benz VLE Electric Minivan Is Finally Coming to America
There are not many words that naturally go together in the U.S. market quite like “luxury” and “minivan,” but Mercedes-Benz...
Audi RS3 Competition Limited Celebrates the Five-Cylinder with a Proper Sendoff
Audi knows exactly what its five-cylinder engine means to enthusiasts, and the new RS3 Competition Limited feels like a heartfelt...
Storing Tires and Components Between Driving Seasons
Flipping tires for summer and winter wheels is a foregone conclusion, but often the gear ends up leaning against a...
California Cracks Down on Montana Plates Loophole for Exotic Car Tax Evasion
For years, the so-called Montana loophole has been an open secret in the world of exotic and ultra-luxury cars. Spend...
2026 Porsche Cayenne S Electric Brings 657 HP to the Sweet Spot of the Lineup
Porsche’s electric Cayenne range is starting to take shape in a way that feels very familiar for the brand. There...