
Italy August 2025: Fiat Grande Panda gears up, Kia Sportage cracks Top 10
The Fiat Panda breaks into its home Top 15 in August.
67,272 new cars found a buyer in Italy in August, a -2.7% year-on-year drop. The year-to-date tally is now off -3.7% to 1,040,734. This is -21.5% or 285,000 units below the pre-pandemic volume of 2019. Once again private sales struggle, a sign of an unhealthily market, at -14.6% to 37,278 and 55.1% share vs. 62.7% in August 2024 (52.4% vs. 56.2% YTD). Self registrations soar 41% to 11,694 and 17.3% share vs. 11.9% a year ago (11.2% vs. 11.5% YTD), long term leases edge up 5.9% to 13,481 and 19.9% share vs. 18.3% last year (23.3% vs. 20.2% YTD), short term rentals surge 46.9% to 1,604 and 2.4% share vs. 1.6% in August 2024 (7.3% vs. 6.6% YTD) and company sales are down -5.5% to 3,651 and 5.4% share vs. 5.6% a year ago (5.8% vs. 5.5% YTD).
Looking at power sources, petrol is down -13.9% to 16,840 and 24.9% share vs. 28.1% last year (25.7% vs. 29.9% YTD), diesel sinks -41.4% to 5,480 and 8.1% share vs. 13.4% (9.7% vs. 14.3% YTD), LPG falls -11.3% to 6,551 and 9.7% share vs. 10.6% (9.2% vs. 9.4% YTD), HEVs are up 8.7% to 30,716 and 45.4% share vs. 40.6% (44.6% vs. 39.1% YTD), that includes 9,383 full hybrids (+8.8%) and 21,333 mild hybrids (+8.7%). PHEVs soar 96.9% to 4,815 and 7.1% share vs. 3.5% in August 2024 (5.7% vs. 3.4% YTD) and BEVs advance 26.9% to 3,306 and 4.9% share vs. 3.7% last year (5.2% vs. 3.8% YTD).
First ever Top 10 finish for the Kia Sportage in Italy.
In the brands ranking, Fiat (+31.7%) catches up on a dismal year-ago result when it fell to #4 overall. At 9.3% share though, this is still below its YTD level of 9.6%. Toyota (-4.4%), Volkswagen (-7.7%) and Dacia (-9.7%) follow and all lose ground. BMW (-8.1%) also but repeats at a record 5th place. The rest of the Top 10 is in negative, with Renault (-29.1%), Ford (-20.9%) and Peugeot (-19.8%) hit the hardest and Audi (-10.7%) and Jeep (-8.1%) also in bad shape. Citroen (+75.4%), Cupra (+52.7%), Alfa Romeo (+24.6%), Hyundai (+19.4%) and MG (+12.8%) all shine below while BYD (+292.8%), Omoda+Jaecoo (+196.1%) and Mini (+114.1%) stand out further down.
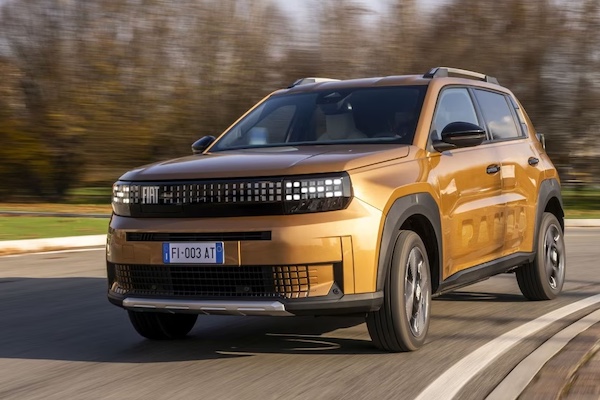
Over in the models aisle, the Fiat Panda (+24%) holds 6.1% of the market vs. 7.1% so far this year. The Dacia Sandero (-15.2%) struggles but stays at #2 ahead of the Jeep Avenger (+11%) returning to the #3 spot it holds year-to-date. The Toyota Yaris Cross (-10.9%) is up one rank on last month to #4 while the Dacia Duster (-9.5%) is down two to #5. The MG ZS (+10%), VW T-Roc (+9.1%) and Toyota Yaris (+2.5%) all manage solid performances whereas the Ford Puma (-18.5%) is in difficulty. The Kia Sportage (+12.6%) breaks into the Italian Top 10 for the very first time at #10, its previous best being #13 in August 2023 and October 2024. Continuing to climb up the ranking is the Fiat Grande Panda up 14 spots on July to #14, the EV variant accounting for 15% of its August volume.
Previous month: Italy July 2025: BMW up to record #5, Fiat Grande Panda finally lands into Top 50
One year ago: Italy August 2024: Fiat falls to #4 below Toyota, Volkswagen and Dacia
Full August 2025 Top 52 All brands and Top 50 models below.
Italy August 2025 – brands:
PosBrandAug-25%/24Jul2025%/24PosFY241Fiat6,2669.3%+ 31.7%199,8049.6%– 9.8%112Toyota5,6778.4%– 4.4%280,3517.7%– 2.2%223Volkswagen4,7547.1%– 7.7%475,2377.2%– 5.5%334Dacia4,4616.6%– 9.7%367,8256.5%+ 1.7%445BMW3,5005.2%– 8.1%549,2744.7%+ 4.8%776Audi3,2504.8%– 10.7%746,2274.4%– 4.6%8107Renault2,9674.4%– 28.1%651,8875.0%– 11.5%658Peugeot2,9274.4%– 19.8%956,7405.5%+ 5.5%569Jeep2,8844.3%– 8.1%844,7234.3%– 6.4%10910Ford2,8544.2%– 20.9%1045,6444.4%– 3.8%9811Hyundai2,6764.0%+ 19.4%1531,7883.1%– 5.8%141312Kia2,3943.6%– 9.2%1229,6792.9%– 9.4%151413Skoda2,3443.5%+ 4.3%1625,2412.4%+ 2.8%171714MG2,2593.4%+ 12.8%1435,2953.4%+ 32.7%131615Citroen2,2473.3%+ 75.4%1339,4093.8%– 10.6%111116Mercedes1,9172.8%– 10.1%1135,6553.4%+ 9.7%121217Opel1,6352.4%– 18.7%1726,3632.5%– 17.1%161518Cupra1,0291.5%+ 52.7%2314,0721.4%+ 24.6%212419Suzuki9891.5%– 32.6%1821,4572.1%– 14.8%191820Nissan9851.5%– 14.6%2123,0772.2%– 9.3%181921Alfa Romeo9781.5%+ 24.6%2019,7991.9%+ 34.9%202122Omoda+Jaecoo9241.4%+ 196.1%247,6150.7%+ 1307.6%263823BYD8761.3%+ 292.8%1912,4041.2%+ 1394.5%223724DR Motor8201.2%– 21.6%2212,1241.2%+ 0.7%232325Mini7581.1%+ 114.1%269,7420.9%+ 18.1%242726Volvo4530.7%– 42.8%259,2160.9%– 29.4%252227Lancia4460.7%– 67.3%296,6140.6%– 77.1%292028Mazda4370.6%+ 6.6%276,9390.7%– 25.8%282629Tesla4160.6%– 4.4%347,3410.7%– 33.5%272530Seat4090.6%+ 2.0%355,6710.5%– 35.9%312831Honda4040.6%+ 34.2%285,9790.6%+ 18.7%303132Land Rover2900.4%– 34.1%315,1250.5%– 25.5%322933Lexus2450.4%– 14.3%324,2310.4%+ 13.6%343334Porsche2370.4%– 0.4%304,5050.4%– 18.6%333035EVO2330.3%– 32.3%334,0650.4%– 4.4%353236DS1590.2%– 9.7%363,4140.3%– 8.5%363437EMC1470.2%+ 107.0%371,8070.2%+ 116.4%374138Sportequipe1360.2%+ 1136.4%411,3510.1%+ 83.8%394339Maserati1030.2%+ 49.3%391,3050.1%– 22.0%403940DFSK930.1%+ 151.3%437530.1%+ 145.3%42n/a41Subaru800.1%+ 70.2%381,6960.2%+ 83.5%384042Mitsubishi590.1%– 21.3%401,2030.1%– 53.0%413543Mahindra390.1%+ 225.0%506600.1%+ 295.2%435044Lynk & Co290.0%+ 262.5%462970.0%– 63.7%474245Ferrari260.0%– 38.1%455740.1%+ 1.2%454546Lamborghini200.0%+ 33.3%474030.0%+ 18.2%464647Polestar200.0%– 42.9%482910.0%+ 91.4%484948Smart110.0%– 79.2%425780.1%– 75.5%443649Lotus80.0%– 52.9%491750.0%– 29.1%514850Aston Martin50.0%+ 66.7%51780.0%+ 20.0%525151SsangYong10.0%– 90.9%442460.0%– 35.8%494752Jaguar00.0%– 100.0%521850.0%– 74.6%5044 –Others3950.6%– 6.8% –4,6000.4%+ 184.0% – –
Italy August 2025 – models:
PosModelAug-25%/24Jul2025%/24PosFY241Fiat Panda4,1236.1%+ 24.0%174,2887.1%– 0.6%112Dacia Sandero2,4423.6%– 15.2%234,5063.3%– 19.0%223Jeep Avenger2,3743.5%+ 11.0%433,4023.2%+ 27.6%334Toyota Yaris Cross1,6982.5%– 10.9%523,7732.3%– 4.4%755Dacia Duster1,6342.4%– 9.5%325,7032.5%+ 30.9%5126Toyota Yaris1,5932.4%+ 2.5%723,3652.2%+ 9.7%887VW T-Roc1,3602.0%+ 9.1%1117,3871.7%– 16.0%12118MG ZS1,3582.0%+ 10.0%820,7652.0%+ 9.5%9149Ford Puma1,3432.0%– 18.5%1018,5531.8%– 3.2%111310Kia Sportage1,1521.7%+ 12.6%1513,2771.3%– 12.4%211811VW Tiguan1,1421.7%– 17.4%1415,9681.5%+ 35.5%162112Renault Captur1,1391.7%– 36.5%1317,2381.7%– 19.2%131013Renault Clio1,1151.7%– 35.2%619,7501.9%– 18.5%10614Fiat Grande Panda1,1001.6%new28n/an/anewn/a –15Peugeot 2081,0721.6%– 36.6%924,5812.4%+ 21.0%6716Citroen C31,0691.6%+ 86.6%1228,5432.7%– 2.7%4417VW T-Cross1,0341.5%+ 54.6%1715,0861.4%– 3.5%171618Toyota Aygo X1,0121.5%+ 8.9%1814,9971.4%+ 0.8%181919BMW X19201.4%– 30.4%1614,7201.4%+ 12.5%192020Opel Corsa8721.3%– 40.4%2216,0211.5%– 10.6%141521Skoda Fabia8671.3%+ 58.8%397,5540.7%+ 20.1%384522Peugeot 30088191.2%+ 132.7%2711,0921.1%+ 35.1%233923Skoda Kamiq7821.2%+ 37.4%407,2990.7%+ 13.3%404924Toyota C-HR7751.2%– 9.3%3110,9901.1%+ 10.6%242525Hyundai i107281.1%– 20.3%269,7510.9%– 10.3%272626Fiat 6007241.1%+ 40.6%2016,0151.5%+ 466.3%15n/a27Kia Picanto7061.0%– 23.6%199,2820.9%+ 11.6%303428Peugeot 20086861.0%– 37.1%3013,9271.3%– 19.0%201729Hyundai Tucson6701.0%+ 56.2%238,8070.8%+ 15.3%323630Audi A36651.0%– 13.9%2410,4481.0%+ 18.4%253731Alfa Romeo Junior6521.0%new3210,0921.0%new26n/a32BMW X36180.9%+ 93.7%466,0060.6%+ 22.5%49n/a33Ford Tourneo Courier5790.9%+ 5.7%427,7310.7%+ 46.8%37n/a34BYD Seal U5490.8%+ 2187.5%219,1360.9%+ 12081.3%31n/a35MG 35430.8%+ 23.1%389,7470.9%+ 696.3%28n/a36BMW Serie 15380.8%+ 111.0%456,5470.6%+ 23.6%46n/a37Hyundai Kona5060.8%n/an/an/an/an/an/an/a38Audi A55010.7%+ 1516.1%n/a4,8210.5%+ 814.8%n/an/a39Audi Q54990.7%+ 38.2%374,7840.5%+ 8.2%n/an/a40Nissan Qashqai4950.7%+ 18.7%3312,3381.2%– 12.4%222241Mercedes GLA4800.7%– 9.8%298,3860.8%– 2.4%332942Audi A14710.7%– 1.5%416,5890.6%+ 15.0%45n/a43VW Golf4660.7%+ 19.5%369,4770.9%+ 30.4%293144Hyundai i204660.7%– 12.7%n/an/an/an/an/a4245Jaecoo 74470.7%n/an/an/an/an/an/an/a46Lancia Ypsilon4460.7%– 67.3%486,6120.6%– 77.1%44947Audi Q34320.6%– 53.6%497,7390.7%– 40.0%362348Citroen C5 Aircross4150.6%n/an/an/an/an/an/an/a49Ford Kuga4100.6%– 10.1%477,5060.7%– 18.3%393350Cupra Formentor4070.6%– 15.6%n/an/an/an/an/a44n/aNissan Juke3940.6%– 29.9%n/a8,3340.8%+ 1.9%3435n/aSuzuki Swift3860.6%– 12.1%347,2260.7%+ 23.2%4243n/aSuzuki Vitara3530.5%– 25.4%436,9460.7%– 6.0%4341n/aFord Focus3180.5%– 43.7%n/a8,0870.8%– 0.8%3538n/aDR 5.03170.5%– 45.5%446,1450.6%n/a4748n/aAlfa Romeo Tonale2920.4%– 40.7%n/a7,2880.7%– 28.9%4128n/aJeep Compass2870.4%– 48.2%355,9610.6%– 46.0%5027n/aVW Taigo1750.3%– 55.1%n/a6,0400.6%– 18.3%4847
Source: UNRAE


More Stories
Ukraine Full Year 2025: Toyota and Renault Duster #1, BYD up to 26.3% share in December
This content is for members only. Visit the site and log in/register to read.
India Full Year 2025: Maruti Suzuki DZire lodges first win since 2018
This content is for members only. Visit the site and log in/register to read.
South Korea Full Year 2025: Kia Sorento repeats at #1, Hyundai Avante up to #2
This content is for members only. Visit the site and log in/register to read.
Ireland Full Year 2025: Hyundai Tucson signs 5th straight win
This content is for members only. Visit the site and log in/register to read.
Taiwan Full Year 2025: Toyota Corolla Cross tightens its grip at 10.8% share, Tesla Model Y breaks record in December
This content is for members only. Visit the site and log in/register to read.
England (UK) Full Year 2025: Ford Puma and Kia Sportage lead, sales up 4.2%
This content is for members only. Visit the site and log in/register to read.