
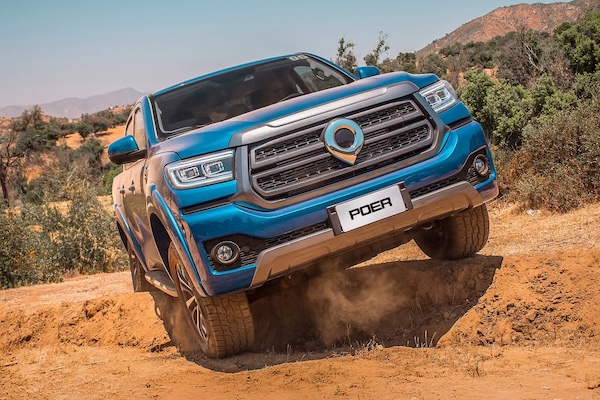
Chile July 2025: GWM Poer delivers its 2nd ever monthly win
The GWM Poer is the best-selling vehicle in Chile in July.
26,909 light vehicles hit Chilean roads in July, a 7.3% year-on-year uptick leading the YTD tally up 3% to 172,537. Toyota (+7.2%) matches the market to stay in pole position in the brands ranking with 7.8% share. It distances Hyundai (+12.1%), Suzuki (+4.4%) and Kia (-1.3%). Chevrolet (-10.2%) underperforms at #5 but still manages to match its YTD share at 5.8%. Chinese GWM (+49.4%) and Changan (+20%) deliver the biggest gains in the Top 10, with Mitsubishi (+18.8%) also strong at #10, Chery (+87.8%) and Mazda (+28%) also shine just outside the Top 10. Omoda/Jaecoo (+84.5%), Foton (+70.7%) and JAC (+42.6%) also impress further down. All in all, the 36 Chinese brands present in Chile are up 16.1% to 33.5% share, their highest since December 2023 (33.6%).
Over in the models charts, the GWM Poer (+61.6%) brilliantly scores its 2nd ever monthly win after September 2023. It upsets the Toyota Hilux (+9.1%) and Mitsubishi L200 (+26%) in a podium entirely composed of pickup trucks. The Chery Tiggo 2 is up one spot on last month to #4 ahead of the Kia Soluto (+10.2%), Suzuki Baleno (+22.9%) and Mazda CX-5 (+80.2%), all outpacing the market. The Maxus T60 (-15.5%) and the surging GWM Jolion (+53.8%) and Omoda C5 (+79.1%) make it five Chinese models inside the Top 10.
Previous month: Chile June 2025: Mitsubishi L200 now #1 YTD
One year ago: Chile July 2024: Top 5 100% pickup in 2nd market lift in 2 years
Full July 2025 Top 74 All brands and Top 30 models below.
Chile July 2025 – brands:
PosBrandJul-25%/24Jun2025%/23PosFY241Toyota 2,0897.8%+ 7.2%113,5157.8%+ 3.1%112Hyundai 1,8276.8%+ 12.1%311,2876.5%+ 16.9%323Suzuki1,8136.7%+ 4.4%212,8617.5%+ 16.9%244Kia 1,6306.1%– 1.3%610,5496.1%+ 2.6%455Chevrolet 1,5555.8%– 10.2%59,9875.8%– 12.2%536GWM1,5485.8%+ 49.4%78,6015.0%+ 11.2%887Ford 1,3545.0%– 4.6%88,9185.2%+ 10.7%778Peugeot 1,2594.7%+ 3.3%49,1285.3%– 2.3%669ChangAn1,1574.3%+ 20.0%106,5513.8%+ 19.0%101110Mitsubishi9113.4%+ 18.8%96,9104.0%+ 11.4%91011Mazda8453.1%+ 28.0%125,2363.0%+ 19.5%111412Chery8133.0%+ 87.8%115,1773.0%+ 22.6%121513MG6912.6%– 42.3%134,7602.8%– 26.9%13914Nissan6642.5%– 7.1%163,8912.3%– 30.8%161215JAC6292.3%+ 42.6%203,2011.9%+ 13.7%211916Subaru6162.3%+ 31.9%173,8542.2%+ 12.8%171717Maxus5972.2%– 15.9%213,9632.3%– 14.6%151318Omoda+Jaecoo5722.1%+ 84.5%183,3171.9%+ 122.3%192719Volkswagen5432.0%+ 19.6%193,2971.9%+ 16.4%201820Foton5191.9%+ 70.7%153,3211.9%+ 31.9%182021Citroen4521.7%+ 2.0%144,2552.5%+ 0.5%141622Jetour4181.6%– 0.7%222,2111.3%– 5.9%232123Geely3931.5%+ 75.4%231,6370.9%+ 59.6%273424Ram3411.3%+ 45.1%242,3241.3%+ 15.4%222425KGM/Ssangyong2901.1%– 24.7%251,7501.0%– 22.4%252226JMC2891.1%+ 30.8%301,6811.0%+ 2.1%262527BYD2611.0%+ 257.5%349780.6%+ 85.6%353828DFSK2581.0%+ 4.9%291,6020.9%– 11.0%292629DFM2470.9%+ 59.4%281,1390.7%+ 30.3%323230Mercedes2400.9%+ 18.8%271,6360.9%+ 30.6%283031BMW2180.8%– 23.8%311,4810.9%– 7.0%302832Jeep2070.8%+ 168.8%331,0910.6%+ 69.9%333733GAC Motor1710.6%– 33.2%321,2260.7%– 17.7%312934Honda1710.6%– 21.9%351,0470.6%– 21.7%343135Opel1470.5%– 49.7%262,0271.2%– 0.9%242336Volvo1180.4%– 3.3%366990.4%– 3.5%363637Mahindra850.3%+ 14.9%406670.4%+ 16.6%373938KYC780.3%+ 5.4%414400.3%– 24.0%424239Kaiyi720.3%+ 1.4%374760.3%– 13.8%404040Audi710.3%+ 39.2%384690.3%+ 4.9%414341Cupra650.2%– 4.4%473200.2%– 23.6%445042Renault 610.2%– 55.5%483630.2%– 70.2%433343Fiat530.2%– 36.9%433120.2%– 27.8%454844Tesla440.2%+ 10.0%395290.3%+ 12.3%384145JIM430.2%+ 2.4%512000.1%+ 37.0%545346Landking410.2%new442310.1%new497047Skoda410.2%+ 10.8%452210.1%– 42.7%505148Mini390.1%+ 62.5%492470.1%+ 35.0%475649Exeed360.1%– 62.9%422430.1%– 39.6%484550Karry360.1%– 45.5%462950.2%– 31.4%464751Shineray350.1%– 30.0%502180.1%– 42.5%514952Lexus320.1%+ 33.3%542080.1%+ 18.9%525553Dongfeng290.1%– 78.4%525170.3%+ 53.0%394654Land Rover280.1%+ 0.0%531830.1%+ 16.6%555755SWM250.1%– 76.4%562020.1%– 66.6%534456Porsche230.1%+ 15.0%551420.1%– 1.4%565857DS220.1%+ 120.0%59960.1%– 31.9%606058ZX Auto210.1%– 4.5%571370.1%+ 15.1%575459Seat140.1%– 68.2%64590.0%– 64.7%645960Smart130.0%new60480.0%new65 –61Lynk & Co120.0%new58930.1%new617462Iveco70.0%– 30.0%61970.1%+ 6.6%596363Alfa Romeo60.0%+ 100.0%62350.0%+ 0.0%666564Riddara40.0%new66640.0%new637365Ferrari30.0%n/a –90.0%– 35.7%717266Maserati30.0%+ 200.0%6990.0%+ 0.0%727167Brilliance20.0%+ 0.0% –150.0%– 71.7%696468Farizon20.0%+ 100.0%63180.0%+ 100.0%686869Gecko20.0%new –30.0%new76 –70Nammi20.0%new –790.0%new627871Zeekr20.0%new –40.0%new74 –72ZNA20.0%– 71.4%651090.1%– 16.8%586173Aston Martin10.0%n/a –20.0%n/a80 –74Livan10.0%new –120.0%new7069 –Others00.0%– 100.0% –140.0%– 48.1% – – –Total Chinese9,00633.5%+ 16.1% –52,74130.6%+ 5.7% – –
Chile July 2025 – models:
PosModelJul-25%/24Jun2025%/24Pos1GWM Poer8553.2%+ 61.6%44,3182.5%+ 30.4%32Toyota Hilux8413.1%+ 9.1%25,0842.9%– 4.0%13Mitsubishi L2006342.4%+ 26.0%14,9302.9%+ 11.5%24Chery Tiggo 25272.0%n/a53,6242.1%n/a65Kia Soluto5201.9%+ 10.2%63,2901.9%+ 14.3%76Suzuki Baleno5091.9%+ 22.9%73,8422.2%+ 62.5%57Mazda CX-54651.7%+ 80.2%82,6431.5%+ 65.3%128Maxus T604211.6%– 15.5%122,7401.6%– 10.2%109GWM Jolion4201.6%+ 53.8%102,6291.5%+ 24.8%1310Omoda C54191.6%+ 79.1%92,6591.5%+ 100.1%1111Chevrolet Groove4071.5%– 14.3%112,8871.7%– 12.0%812Peugeot Partner4051.5%+ 49.4%34,0412.3%+ 45.4%413Ford Territory3831.4%– 11.8%202,2001.3%+ 15.6%1514Hyundai Grand i103691.4%+ 668.8%172,3311.4%– 0.7%1415Chevrolet Sail3661.4%+ 5.5%152,0311.2%+ 2.2%1716Hyundai Tucson3531.3%+ 24.7%141,9031.1%+ 20.5%1917Hyundai Creta3391.3%+ 2.1%231,8851.1%+ 14.0%2018Suzuki Fronx3381.3%new162,1211.2%new1619Ford Ranger3301.2%– 34.4%132,8231.6%+ 2.0%920MG ZX3141.2%– 17.2%n/a1,5110.9%– 0.4%2721Suzuki Jimny3121.2%+ 40.5%191,7971.0%+ 37.0%2122Peugeot 20083031.1%+ 25.7%181,4950.9%+ 5.7%2923Changan X7 Plus2641.0%newn/a1,3730.8%new3324Toyota Yaris Cross2540.9%n/an/a1,7751.0%n/a2225Kia Sonet2540.9%– 30.4%291,7681.0%+ 15.6%2326Subaru Forester2540.9%#DIV/0!221,5000.9%+ 30.1%2827Toyota Raize2430.9%+ 9.0%211,5940.9%+ 9.1%2628Toyota Corolla Cross2340.9%– 13.0%241,3970.8%– 7.8%3229Subaru Crosstrek2290.9%+ 26.5%n/a1,4320.8%+ 7.2%3030Ram 700 Pickup2140.8%+ 86.1%271,4150.8%+ 22.8%31n/aSuzuki Swift2130.8%– 48.9%n/a1,7611.0%– 42.9%24n/aFord F-1502050.8%+ 1038.9%n/a1,1830.7%+ 30.4%n/an/aToyota Yaris2000.7%– 20.9%301,3230.8%– 19.8%n/an/aNissan Versa1940.7%+ 49.2%289380.5%– 23.6%n/an/aCitroen Berlingo1790.7%+ 244.2%261,9691.1%+ 17.0%18n/aToyota RAV41790.7%– 22.2%n/a1,7331.0%+ 5.0%25n/aKia Morning1630.6%+ 14.0%n/a1,1990.7%– 0.7%n/an/aJMC Gran Avenue1630.6%+ 19.0%n/a1,0470.6%+ 21.9%n/an/aKGM Grand Musso1490.6%– 30.0%n/a9180.5%– 18.8%n/an/aHyundai Accent1440.5%– 18.2%n/a1,0860.6%– 37.4%n/an/aFord Transit1390.5%+ 13.0%n/a8270.5%+ 34.9%n/an/aKia Frontier1300.5%– 19.3%n/a1,0020.6%+ 5.3%n/an/aChevrolet Silverado1290.5%– 27.5%n/a1,0370.6%– 4.5%n/an/aSuzuki Celerio1270.5%+ 126.8%n/a8930.5%+ 52.1%n/an/aMG31240.5%– 31.1%n/a7920.5%– 15.5%n/an/aMazda31180.4%n/an/a5600.3%n/an/an/aChangan Hunter1130.4%+ 44.9%n/a8100.5%+ 66.0%n/an/aJMC Vigus1080.4%+ 36.7%n/a5510.3%– 20.0%n/an/aFoton G71030.4%+ 47.1%n/a8390.5%+ 25.4%n/an/aFoton TM51010.4%+ 7.4%n/a6380.4%+ 2.2%n/an/aChevrolet Colorado970.4%#DIV/0!n/a9300.5%#DIV/0!n/an/aRam Rampage950.4%n/an/a5160.3%n/an/an/aSuzuki S-Presso940.3%– 22.3%n/a7240.4%– 28.9%n/an/aFoton TM3910.3%+ 31.9%n/a6100.4%+ 12.8%n/an/aFoton Midi860.3%+ 50.9%n/a6120.4%+ 8.3%n/an/aChevrolet N400 Max850.3%– 19.8%n/a6300.4%– 26.6%n/an/aPeugeot Rifter850.3%n/an/a5970.3%n/an/an/aMercedes Sprinter830.3%– 25.9%n/a7320.4%+ 20.8%n/an/aMazda BT-50820.3%– 4.7%n/a5500.3%– 17.3%n/an/aHyundai Porter800.3%– 14.9%n/a1,0300.6%+ 18.1%n/an/aVW Polo790.3%n/an/a5260.3%n/an/an/aChangan Alsvin780.3%+ 18.2%n/a5450.3%– 7.6%n/an/aJAC Sunray760.3%+ 8.6%n/a4350.3%+ 14.8%n/an/aGWM Wingle 7710.3%+ 29.1%n/a5500.3%– 4.0%n/an/aHyundai Staria700.3%+ 11.1%n/a4750.3%+ 56.8%n/an/aChevrolet Montana690.3%– 41.0%n/a6010.3%– 28.0%n/an/aVW Saveiro670.2%– 33.7%n/a5780.3%+ 33.2%n/an/aCitroen C3660.2%– 49.2%n/a5350.3%– 46.0%n/an/aMaxus Deliver 9550.2%+ 48.6%n/a3790.2%+ 1.9%n/an/aChangan M201460.2%n/an/a2350.1%n/an/an/aOpel Corsa450.2%– 51.1%n/a6200.4%+ 8.0%n/an/aSuzuki Alto430.2%n/an/a5150.3%n/an/an/aPeugeot Boxer430.2%– 37.7%n/a4340.3%+ 24.4%n/an/aChangan MD301430.2%n/an/a2820.2%n/an/an/aPeugeot 208400.1%– 62.3%n/a6400.4%– 11.1%n/an/aChangan MD201350.1%n/an/a2620.2%n/an/an/aMaxus G10340.1%+ 21.4%n/a2960.2%+ 8.4%n/an/aOpel Combo L1280.1%– 62.7%n/a5990.3%+ 19.6%n/an/aDongfeng DF-212280.1%n/an/a2040.1%n/an/a
Source: ANAC

More Stories
Trump Adds 50 Percent Tariffs on Canadian Goods as Auto Trade Fight Escalates
The trade fight between the United States and Canada is escalating again, and the auto industry is right in the...
U.S. Automakers Race to Remove Chinese Connected-Car Hardware as New Federal Rules Loom
The U.S. auto industry is entering another major supply-chain shift, and this one reaches deep into the electronics that make...
Portugal June 2026: Sales up 13.6%, Dacia and Tesla break volume records
Dacia posts its first 2,000+ sales month in Portugal. Another solid result for new car sales in Portugal, up 13.6%...
Cadillac CT5-V Blackwing Successor Reportedly Planned as Next-Gen Super Sedan Takes Shape
Cadillac’s CT5-V Blackwing may not be heading quietly into history after all. While the current-generation CT5-V Blackwing is set to...
What to Do if You Bought a Defective Vehicle
Buying a new car can be life-changing to some, but a major liability to others who unknowingly bought a lemon....
Greece June 2026: Toyota Yaris signs first win in 2 years, strongest market in 17 years
The Toyota Yaris is the best-seller in Greece for the first time since July 2024. New car sales in Greece...