
UK July 2025: Mini (+46.6%), Peugeot (+33.4%), Skoda (+30.2%) highlight negative market
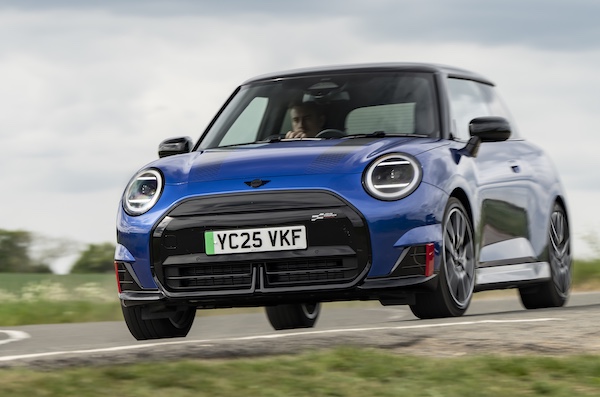
The Mini Cooper is up to #4 overall in July.
Data by local association SMMT shows a UK new car market down -5% year-on-year in July to 140,154 units. This is the weakest July result since 2022, and -10.8% lower than pre-pandemic July 2019. According to SMMT, the newly announced Electric Car Grant (ECG), with discounts of up to £3,750, may have caused some buyers to hold off pending confirmation of which vehicles will qualify. The YTD tally is now up just 2.4% to 1,182,373, this time the highest result since 2019 (1,426,443). Private sales drop -3.2% to 51,646 and 36.8% share vs. 36.2% last year while fleet sales fall -6.5% to 85,594 and 61.1% share vs. 62%. Business sales rise 10.4% to 2,914 and 2.1% share vs. 1.8%. So far this year, private sales are up an encouraging 4% to 453,650 and 38.4% share vs. 37.8% over the same period in 2024, fleets edge up 1.6% to 703,035 and 59.5% share vs. 59.9% and business sales are down -1.6% to 25,688.
Looking at power source, petrol is down -14.7% to 66,271 and 47.3% share vs. 52.7% a year ago, diesel is down a more measured -7.9% to 8,018 and 5.7% share vs. 5.9% and HEVs fall -10% to 18,551 and 13.2% share vs. 14%. PHEVs surge 33% to 17,489 and 12.5% share vs. 8.9% and BEVs improve 9.1% to 29,825 and 21.3% share vs. 18.5% in July 2024. Year-to-date, petrol drops -10.1% to 571,111 and 48.3% share vs. 55% last year, diesel is down -10.9% to 66,740 and 5.6% share vs. 6.5%, HEVs gain 6.5% to 165,328 and 14% share vs. 13.5%, PHEVs soar 31.5% to 124,528 and 10.5% share vs. 8.2% and BEVs surge 31% to 254,666 and 21.5% share vs. 16.8% over the same period in 2024.
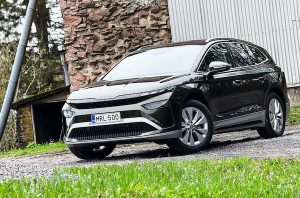
Over in the brands charts, Volkswagen (-4.2%) is by far the most popular with 9.6% share vs. 9.1% YTD, and the only one above 10,000 sales for the month. In 2nd place, Ford (+16.5%) posts a third straight double-digit YoY gain to 6.5% share vs. #4 and 5.9% so far this year. The next four carmakers are in negative, with Kia (-7.5%), Audi (-7.3%) and BMW (-18.2%) losing share year-on-year and Hyundai (-4.6%) matching the market. Skoda (+30.2%) excels at #7 with 4.8% share, as does Peugeot (+33.4%), but Nissan (-22.7%) and Mercedes (-15.5%) both disappoint. Further down the charts, Mini (+46.6%) is up seven spots on last month to #14, Cupra (+30.1%) is up to #17 and BYD (+314.6%) continues to gear up at 2.3% share. Chinese newcomers Jaecoo (#21) and Omoda (#22) are both strong.
The Kia Sportage (+12.1%) snaps a third monthly win this year after January and April, but with the Ford Puma (+29%) less than 100 units below, this is not enough to grab the YTD top spot. The Nissan Juke (+20.5%) climbs to the third step of the podium, its best ranking since last September when it also ranked #3. The Mini Cooper rallies back up to #4, its 4th Top 10 finish this year. Excellent score also by the VW Tiguan at #5, the nameplate’s 2nd highest ranking ever, below the #4 it reached exactly in October 2018. The Peugeot 2008 scores its 4th straight Top 10 finish and highest ranking since last January at #7. The T-Roc and Golf make it three VWs in the Top 10.
Previous month: UK June 2025: BEVs up 39.1%, Hyundai hits record #4, Nissan Qashqai best-seller
One year ago: UK July 2024: Kia Sportage threepeats at #1, Volvo XC40 up to record #4
Full July 2025 Top 50 All brands and Top 10 models below.
UK July 2025 – brands:
PosBrandJul-25%/24Jun2025%/24PosFY241Volkswagen13,4529.6%– 4.2%1107,6089.1%+ 10.3%112Ford 9,1066.5%+ 16.5%369,5085.9%+ 7.7%453Kia9,0286.4%– 7.5%571,0336.0%+ 1.3%344Audi 8,7386.2%– 7.3%662,2765.3%– 16.7%535BMW 8,0895.8%– 18.2%273,7876.2%– 7.4%226Hyundai7,2165.1%– 4.6%455,9944.7%+ 3.8%697Skoda6,7724.8%+ 30.2%950,6094.3%+ 18.1%12128Mercedes 6,4464.6%– 15.5%1054,4164.6%– 8.3%969Peugeot 6,1794.4%+ 33.4%1154,8394.6%+ 39.6%81310Nissan 6,1184.4%– 22.7%755,2674.7%– 12.1%7811Toyota5,7094.1%– 22.7%852,0584.4%– 11.0%10712MG5,6374.0%– 9.5%1348,2544.1%– 4.0%131013Vauxhall 4,8923.5%– 10.5%1451,5744.4%+ 1.5%111114Mini4,4083.1%+ 46.6%2126,3612.2%+ 8.6%171815Volvo4,3533.1%– 33.4%1638,2233.2%+ 3.4%151416Land Rover4,3073.1%– 14.9%1739,5543.3%+ 4.3%141517Cupra3,6392.6%+ 30.1%1922,7611.9%+ 36.2%192218Renault3,3382.4%– 7.9%1536,5753.1%+ 13.5%161619BYD3,1842.3%+ 314.6%1822,5741.9%+ 514.8%203120Mazda1,9151.4%+ 9.1%2020,7241.8%+ 30.8%212421Jaecoo1,9151.4%new2510,3140.9%new284722Omoda1,8741.3%new318,8150.7%new313323Dacia1,8671.3%– 11.1%2317,9921.5%– 1.5%222024Seat1,4701.0%– 54.0%2713,7941.2%– 43.8%241925Porsche1,3190.9%+ 10.4%2910,8500.9%+ 5.8%252626Honda1,3140.9%– 46.2%2814,5341.2%– 28.1%232127Lexus1,1770.8%+ 24.6%269,9610.8%+ 10.9%292728Citroen1,1430.8%– 41.3%2210,5260.9%– 40.7%272329Suzuki1,0630.8%– 43.6%3010,5620.9%– 31.7%262530Tesla9870.7%– 59.9%1223,7082.0%– 7.0%181731Jeep8260.6%+ 16.3%337,4500.6%+ 66.8%323032Polestar8200.6%+ 0.5%249,1430.8%+ 157.0%303233Fiat4310.3%– 43.2%326,5670.6%– 25.6%332934Leapmotor2480.2%new407900.1%new41 –35Alfa Romeo1630.1%+ 46.8%361,4710.1%+ 49.8%353636KGM1140.1%+ 8.6%399490.1%– 12.5%383737Genesis1090.1%+ 17.2%388980.1%+ 38.4%393838Alpine1090.1%+ 395.5%374360.0%+ 80.2%434439Smart1050.1%– 12.5%418800.1%– 25.5%403540Subaru840.1%– 30.0%351,3450.1%– 13.0%363441Bentley840.1%+ 68.0%436140.1%+ 17.4%424242Ineos360.0%+ 100.0%461670.0%+ 1.8%484543Maserati320.0%+ 3.2%452030.0%– 34.1%464344GWM Ora140.0%– 74.5%442070.0%– 78.2%453945DS130.0%– 89.7%349610.1%+ 36.5%374046Abarth110.0%– 92.8%472120.0%– 64.5%444147Chevrolet110.0%n/a49450.0%+ 4400.0%495048Xpeng80.0%new421730.0%new47 –49Skywell50.0%new50160.0%new514950Jaguar00.0%– 100.0%511,7250.1%– 85.2%3428 –Other British1640.1%– 47.8% –1,8840.2%+ 1.6% – – –Other Imports1120.1%– 35.3% –1,1430.1%– 24.5% – –
UK July 2025 – models:
PosModelJul-25%/24Jun2025%/24PosFY241Kia Sportage4,4823.2%+ 12.1%727,4942.3%– 2.3%222Ford Puma4,4093.1%+ 29.0%230,7642.6%+ 3.3%113Nissan Juke3,0772.2%+ 20.5%921,6041.8%– 1.7%544Mini Cooper2,6291.9%n/an/an/an/an/an/a255VW Tiguan2,5271.8%n/an/a17,7501.5%n/a8136Nissan Qashqai2,4441.7%– 32.7%124,5292.1%– 7.5%337Peugeot 20082,4341.7%n/a1017,6051.5%n/a9208VW T-Roc2,2581.6%– 12.4%8n/an/an/an/a159VW Golf2,0901.5%– 30.5%n/a18,9741.6%– 13.9%6610Audi A32,0801.5%+ 55.2%n/an/an/an/an/a11n/aVauxhall Corsa2,0681.5%n/a422,1961.9%n/a412n/aHyundai Tucson1,7531.3%– 39.9%n/a17,2491.5%– 9.7%107n/aMG HS1,6781.2%– 31.4%517,7931.5%– 7.2%78
Source: SMMT

More Stories
Ford GT Mk IV Storms the Nürburgring as America’s Fastest Gas-Powered Track Weapon
Ford has another major bragging right to hang in the performance hall of fame. The 800-plus-horsepower Ford GT Mk IV...
2027 Subaru Getaway Brings Three Rows, 420 HP, and Real Family EV Appeal
Subaru is stepping deeper into the EV space with something that feels a lot more aligned with what many American...
2027 Kia EV3 Heads to the U.S. With Up to 320 Miles of Range and a Smart New Entry Point for EV Buyers
Kia is finally bringing the EV3 to the United States, and it looks like the brand may have found a...
France March 2026: Dacia Sandero, Tesla Model Y and Renault Clio VI in photo finish
First podium finish at home for the Renault Clio VI. For the first time since last October, the French new...
Hyundai Boulder Concept Hints at a Real Midsize Body-on-Frame Truck Coming Soon
Hyundai has spent years proving it can build just about everything except the one vehicle many shoppers still associate with...
When to Replace Your Car’s Brake Pads?
Brake pads wear down gradually, which is why many drivers don’t realize there’s an issue until braking performance noticeably changes....