
Chile February 2025: Suzuki repeats at #1 in weakest market in 10 years
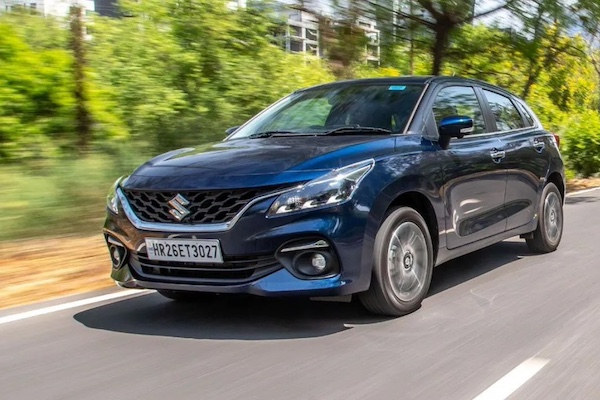
The Suzuki Baleno ranks #5 in Chile in February.
The Chilean new light vehicle market is down year-on-year for the second time in the past 8 months in February at -6.3% to 21,044 units. This is the weakest February in 10 years, since February 2015. As a result the year-to-date tally tilts into negative territory at -1.4% to 46,878. Suzuki (+23.1%) defies the surrounding gloom and repeats at #1 with 8.5% share. Not far below is Toyota (-8.5%) falling faster than the market but up one spot on January to #2. Kia (-9%) falls to #3 ahead of a struggling Hyundai (-15.7%). Chevrolet (-25%) is in even worse shape at #5. GWM (-2.1%) is by far the most popular Chinese carmaker at #7, with the total Chinese (-7.1%) coming at 29.7% share for the month vs. 28.8% so far this year. Chery (+24.6%), Citroen (+23%) and Changan (+13.8%) shine below.
Over in the models charts, the Toyota Hilux (-0.2%) signs a third win in the past 4 months, with only 3.1% share enough to snap the top spot, denoting a very fragmented market. The GWM Poer (+41.8%) surges ahead and stays in 2nd place above the Chery Tiggo 2 Pro Max soaring 21 spots on last month to #3. Leader in January, the Mitsubishi L200 (-31.7%) falls to #4 but remains #1 YTD. The Suzuki Baleno (+42.3%) contributes to the brand’s success, repeating at #5 vs. #10 over the Full Year 2024. Solid score also by the Peugeot Partner (+8.8%) at #6.
Previous month: Chile January 2025: Mitsubishi L200 ultra dominant, sales up
One year ago: Chile February 2024: Market down -14.4%, Mitsubishi L200 reclaims lead
Full February 2025 Top 72 All brands and Top 40 models below.
Chile February 2025 – brands:
PosBrandFeb-25%/24Jan2025%/23PosFY241Suzuki1,7838.5%+ 23.1%13,7097.9%+ 29.5%142Toyota 1,7338.2%– 8.5%33,5367.5%– 17.2%213Kia 1,3306.3%– 9.0%23,1486.7%+ 6.5%354Hyundai 1,3216.3%– 15.7%42,9586.3%– 7.6%425Chevrolet 1,2095.7%– 25.0%52,8416.1%– 13.0%536Peugeot 1,1125.3%– 5.4%72,4765.3%– 5.1%667GWM1,0384.9%– 2.1%92,1984.7%+ 3.5%988Ford 9754.6%+ 0.3%62,4055.1%+ 7.6%779Mitsubishi8794.2%– 18.0%82,2404.8%– 2.8%81010ChangAn8163.9%+ 13.8%101,8564.0%+ 25.3%101111Chery7043.3%+ 24.6%181,1582.5%+ 1.0%141512Citroen6202.9%+ 23.0%131,3052.8%+ 3.0%131613Mazda6182.9%+ 9.4%121,3883.0%+ 9.4%121414MG5582.7%– 37.7%111,4943.2%– 18.8%11915Maxus5122.4%– 25.5%151,0542.2%– 23.5%161316Nissan4792.3%– 40.5%141,0792.3%– 36.9%151217Subaru4672.2%+ 11.2%161,0092.2%+ 20.0%171718JAC3861.8%– 6.5%247031.5%– 25.5%201919Foton3591.7%– 7.0%198001.7%+ 16.8%192020Volkswagen3581.7%+ 2.6%178591.8%+ 2.5%181821Omoda3231.5%+ 107.1%236611.4%+ 158.2%212722Opel3021.4%+ 31.9%206581.4%+ 10.0%222323KGM/Ssangyong2461.2%+ 0.0%265241.1%+ 4.2%252224Jetour2371.1%– 26.9%215871.3%– 8.9%232125Ram2341.1%– 11.4%225801.2%+ 13.3%242426DFSK1940.9%– 51.9%284450.9%– 47.0%272627JMC1910.9%+ 0.5%254721.0%+ 15.4%262528Mercedes1910.9%+ 4.9%293980.8%– 4.1%293029BMW1810.9%+ 7.7%274420.9%+ 26.6%282830GAC Motor1810.9%+ 4.6%313800.8%+ 1.1%302931DFM1260.6%n/a322970.6%n/a323232Honda1210.6%– 42.9%303270.7%– 30.4%313133Geely1050.5%+ 4.0%372070.4%+ 4.0%343434Mahindra880.4%+ 44.3%342110.5%+ 83.5%333935Volvo760.4%+ 35.7%361830.4%+ 57.8%373636Tesla750.4%n/a351960.4%n/a354137BYD690.3%+ 68.3%331920.4%+ 134.1%363838Jaecoo630.3%new431190.3%new415239KYC620.3%– 8.8%401280.3%– 15.2%394240Karry540.3%– 3.6%451030.2%– 2.8%454741Audi530.3%– 1.9%421110.2%– 5.9%424342Renault 520.2%– 21.2%391250.3%– 64.1%403343Jeep490.2%– 27.9%381360.3%– 11.7%383744Fiat470.2%+ 42.4%441030.2%+ 66.1%444845Kaiyi410.2%– 56.4%411050.2%– 41.7%434046Dongfeng410.2%n/a61580.1%n/a514647ZNA400.2%+ 5.3%55690.1%+ 23.2%476148Cupra390.2%– 39.1%50740.2%– 37.3%465049Shineray310.1%– 48.3%52600.1%– 41.7%504950Exeed310.1%– 20.5%60500.1%– 39.8%544551Lexus270.1%+ 17.4%49660.1%+ 22.2%495552Skoda260.1%– 51.9%51560.1%– 53.3%525153Landking260.1%new59460.1%new557054SWM250.1%– 71.6%46680.1%– 60.7%484455Land Rover180.1%+ 0.0%57430.1%+ 7.5%585756Mini170.1%– 39.3%56430.1%– 18.9%575657Porsche170.1%+ 21.4%58390.1%+ 21.9%605858DS150.1%+ 650.0%62280.1%+ 40.0%626059ZX Auto140.1%– 44.0%48540.1%+ 45.9%535460Iveco140.1%+ 133.3%54430.1%+ 152.9%566361JIM90.0%new53380.1%new615362Lynk & Co80.0%new65180.0%new647463BAIC70.0%– 94.6%63180.0%– 94.2%633564Seat70.0%– 61.1%66140.0%– 65.9%655965Brilliance40.0%– 55.6%7250.0%– 77.3%696466Alfa Romeo20.0%– 33.3%6850.0%– 58.3%686567Maserati20.0%+ 0.0% –20.0%– 60.0%737168Riddara10.0%new47420.1%new597369Ferrari10.0%– 50.0%7040.0%– 20.0%707270Neta10.0%new7120.0%new726271Zeekr10.0%new –10.0%new76 –72Aston Martin10.0%n/a –10.0%n/a77 – –Others10.0%– 75.0% –50.0%– 37.5% – – –Total Chinese6,25129.7%– 7.1% –13,49728.8%– 1.1% – –
Chile February 2025 – models:
PosModelFeb-25%/24Jan2025%/24PosPos1Toyota Hilux6623.1%– 0.2%31,2302.6%– 18.1%212GWM Poer5772.7%+ 41.8%21,1462.4%+ 29.8%333Chery Tiggo 2 Pro Max5722.7%n/a248691.9%n/a7n/a4Mitsubishi L2005612.7%– 31.7%11,6173.4%– 1.2%125Suzuki Baleno5522.6%+ 42.3%51,0832.3%+ 31.4%4106Peugeot Partner4962.4%+ 8.8%89932.1%+ 5.9%587Chevrolet Groove3821.8%– 22.2%78811.9%– 9.4%658Maxus T603381.6%– 28.1%146781.4%– 27.1%1079Kia Soluto3251.5%– 21.5%68391.8%+ 2.3%9610Omoda C53171.5%n/a166501.4%n/a142611Ford Territory3141.5%+ 34.8%126621.4%+ 33.5%131512Hyundai Grand i103131.5%– 9.0%106631.4%– 14.9%121113Citroen Berlingo3101.5%+ 31.4%186251.3%– 11.6%162714Ford Ranger3001.4%+ 1.7%48541.8%+ 33.4%8415GWM Jolion2931.4%– 7.9%96681.4%+ 18.7%111216Mazda CX-52871.4%+ 42.1%225741.2%+ 24.0%191917Toyota Yaris Cross2831.3%+ 59.0%136281.3%+ 49.9%153318Suzuki Fronx2811.3%new215691.2%new20n/a19Toyota RAV42561.2%– 14.7%155911.3%– 10.2%182320Hyundai Creta2541.2%+ 14.4%205471.2%+ 15.9%221621Suzuki Swift2441.2%– 35.4%115931.3%– 23.0%17922Kia Sonet2351.1%– 2.9%175591.2%+ 14.5%211823Chevrolet Sail2221.1%+ 2.3%235061.1%+ 6.1%231424Suzuki Jimny2141.0%n/a294290.9%n/a273125Changan X7 Plus2051.0%new274551.0%new24n/a26MG ZX1960.9%– 10.1%254541.0%+ 2.3%253027Nissan X-Trail1850.9%n/a304000.9%n/a30n/a28Hyundai Tucson1790.9%– 22.2%284210.9%– 17.9%281729Subaru Crosstrek1740.8%+ 1.8%383590.8%– 2.2%332830Kia Morning1700.8%+ 0.6%333690.8%+ 8.2%32n/a31Subaru Forester1680.8%n/a323780.8%n/a313432Toyota Yaris1640.8%– 33.3%343570.8%– 34.9%342433Peugeot 20081580.8%+ 3.3%264120.9%– 2.6%292934KGM Grand Musso1550.7%+ 55.0%373450.7%+ 46.8%35n/a35MG ZS1490.7%– 55.0%194491.0%– 34.1%261336Chevrolet Silverado1410.7%– 6.6%393180.7%+ 17.3%373237Chevrolet Colorado1350.6%n/an/a3050.7%n/a39n/a38Hyundai Accent1300.6%– 35.0%353220.7%– 26.7%362539Kia Frontier1270.6%+ 32.3%n/a2750.6%+ 40.3%n/an/a40Changan Hunter1230.6%+ 50.0%n/a2630.6%+ 57.5%n/an/an/aJMC Gran Avenue1210.6%+ 42.4%363120.7%+ 112.2%38n/an/aSuzuki S-Presso1210.6%– 30.9%n/a2320.5%– 32.6%n/an/an/aMercedes Sprinter1170.6%+ 50.0%n/a2230.5%+ 36.8%n/an/an/aSuzuki Celerio1160.6%+ 0.0%n/a2330.5%+ 19.5%n/an/an/aRam 700 Pickup1080.5%– 30.8%402810.6%– 8.8%40n/an/aPeugeot Boxer1000.5%+ 212.5%n/a1630.3%+ 139.7%n/an/an/aSuzuki Alto990.5%+ 33.8%n/a1850.4%+ 49.2%n/an/an/aHyundai Porter990.5%– 63.9%n/a1690.4%– 51.3%n/an/an/aOpel Combo L1970.5%+ 781.8%n/a2150.5%+ 115.0%n/an/an/aFoton G7920.4%n/an/a2230.5%n/an/an/an/aOpel Corsa880.4%+ 25.7%n/a1860.4%– 4.1%n/an/an/aChevrolet N400 Max880.4%– 52.9%n/a1800.4%– 37.5%n/an/an/aNissan Versa870.4%– 50.6%n/a2320.5%– 40.7%n/an/an/aPeugeot Rifter860.4%n/an/a1900.4%n/an/an/an/aCitroen C3840.4%– 32.3%n/a1910.4%– 23.6%n/an/an/aFoton TM5790.4%– 2.5%n/a1630.3%+ 1.2%n/an/an/aFord Transit780.4%+ 50.0%n/a1830.4%+ 57.8%n/an/an/aFoton Midi740.4%– 47.5%n/a1770.4%– 8.8%n/an/an/aRam Rampage730.3%newn/a1820.4%newn/an/an/aJAC Sunray730.3%+ 35.2%n/a1340.3%+ 52.3%n/an/an/aVW Saveiro720.3%+ 63.6%n/a1560.3%+ 8.3%n/an/an/aMG3710.3%– 47.4%n/a1700.4%– 29.8%n/an/an/aChangan Alsvin700.3%– 28.6%n/a1490.3%– 19.0%n/an/an/aFoton TM3700.3%– 19.5%n/a1470.3%– 18.3%n/an/an/aFord F-150670.3%– 58.1%n/a1880.4%– 50.8%n/an/an/aJMC Vigus610.3%+ 48.8%n/a1410.3%– 26.9%n/an/an/aChevrolet Montana600.3%– 48.3%n/a1850.4%– 19.2%n/an/an/aMazda3600.3%– 9.1%n/a1350.3%+ 4.7%n/an/an/aPeugeot 208590.3%n/a312730.6%n/an/an/an/aHyundai Staria590.3%n/an/a1340.3%n/an/an/an/aMazda BT-50550.3%– 26.7%n/a1610.3%– 6.9%n/an/an/aVW Polo550.3%n/an/a1270.3%#DIV/0!n/an/an/aMaxus G10530.3%+ 65.6%n/a940.2%+ 36.2%n/an/an/aMaxus Deliver 9520.2%– 26.8%n/a1350.3%+ 6.3%n/an/an/aGWM Wingle 7410.2%– 51.2%n/a1050.2%– 38.2%n/an/an/aDFSK D1390.2%n/an/a1060.2%n/an/an/an/aChangan MD301270.1%n/an/a650.1%n/an/an/an/aChangan MD201250.1%– 13.8%n/a680.1%+ 3.0%n/an/an/aFoton Miler240.1%n/an/a510.1%n/an/an/an/aChangan M201170.1%n/an/a480.1%n/an/an/a
Source: ANAC


More Stories
How to Explore Ferrari’s Legendary Daytona Through This Definitive and Beautiful New Book
Few grand tourers carry the same weight as the Ferrari 365 GTB/4 Daytona. Revered for its striking design, formidable performance,...
Colombia February 2025: Kia Picanto repeats at #1, sales up 49.5%
The Kia Picanto is once again the most popular vehicle in Colombia. New vehicle sales in Colombia continue to surge,...
The Winner of Our Exciting Smallest Cog Goodies Bundle Competition!
Thank you for everyone that entered our Smallest Cog Goodies Bundle competition. Congratulations to our Smallest Cog Goodies Bundle competition...
Toyota’s Warning Shot Shows How Fast the Auto Industry Is Changing
Toyota is not a company that usually talks like it is on the ropes, which is exactly why this latest...
2026 Ram 1500 America250 Editions Turn Big Horn, Laramie, and Rebel Into Patriotic Special Trucks
Ram is leaning hard into Americana for the 2026 model year with a new batch of special-edition 1500 pickups created...
Wrongful Death After a Car Accident: Legal Rights of the Family
Car accidents have a devastating impact on one’s life. Even if you drive carefully, you have little control over other...