
Switzerland February 2025: Skoda lands third ever win, Tesla down -66.6%
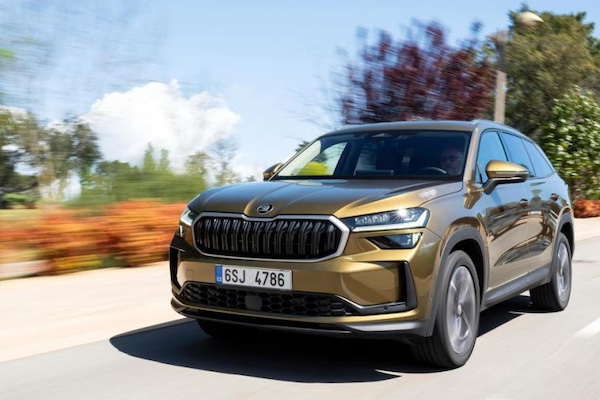
Skoda Kodiaq sales are up 44.5% in February.
16,212 new cars found a buyer in Switzerland in February, a harsh -12.5% year-on-year fall. The year-to-date tally after two months is off -8.2% to 31,000 units. 4×4 sales are down -15.1% to 8,097 and 49.9% share vs. 51.5% a year ago and off -10.8% year-to-date to 15,676 and 50.6% share vs. 52.1% over the same period in 2024. Petrol sales sink -31.7% to 4,071 and 25.1% share vs. 32.2%, and are down -27.7% YTD to 7,893 and 25.5% share vs. 32.4%. Diesel is off -26.4% to 1,274 and 7.9% share vs. 9.3% and down -27.2% YTD to 2,495 and 8% share vs. 10.2%. HEVs (including MHEVs) edge up 3.8% to 6,000 and 37% share vs. 31.2% and soar 10.4% YTD to 11,478 and 37% share vs. 30.8%. PHEVs fall -16.6% to 1,462 and 9% share vs. 9.5% and are down -15.5% YTD to 2,817 and 9.1% share vs. 9.9%. Finally BEVs are up 3.2% to 3,402 and 21% share vs. 17.8% in February 2024 and up 11.5% YTD to 6,312 and 20.4% share vs. 16.8% over the first two months of 2024.
Brand-wise, Skoda (-0.5%) is stable and lifts two spots on January to land in pole position with 9.4% share. This is only the third time in Swiss history that Skoda is the best-selling carmaker after January 2022 and April 2024. #1 last month and year-to-date, BMW (-7.4%) drops to #2 and limits its fall, as does Volkswagen (-4.6%) at #3. Audi (+13.2%) overtakes Mercedes (-7.5%) to #4 while Renault (+21.3%) and Hyundai (+9.6%) defy the negative market with sturdy gains. Below, Cupra (+33.5%) outsells sister brand Seat (-45.5%) for the third time in the past 4 months. Tesla is down -66.6%.
Model-wise, the Audi Q3 (+43.6%) soars 14 spots on January to snap the top spot for the first time since last July. It climbs to #6 year-to-date as a result, the same ranking it held over the Full Year 2024. The VW Tiguan (+60.6%) also surges year-on-year to #2 vs. #3 last month, and this is enough for the nameplate to take the YTD lead. The Mercedes GLC (+21.5%) is up one rank also to #3 while the Skoda Kodiaq (+44.5%) is down two to #4. The VW Golf (+36%) rounds out the Top 5 in dynamic fashion. Skoda also places the Octavia (-53.2%) and #6 and the Karoq (-13.4%) at #7. #1 over the Full Year 2024 and a year ago in February 2024, the Tesla Model Y (-68.7%) implodes to #8 and ranks #13 YTD.
Previous month: Switzerland January 2025: BMW breaks share record, X3 signs first ever win
One year ago: BMW repeats at #1, Tesla Model Y back in charge
Full February 2025 Top 57 All brands and Top 348 All models below.
Switzerland February 2025 – brands:
PosBrandFeb-25%/24Jan2025%/24PosFY241Skoda1,5259.4%– 0.5%32,8669.2%– 5.6%232BMW1,4539.0%– 7.4%13,18110.3%+ 2.5%123Volkswagen1,4438.9%– 4.6%22,7959.0%– 1.1%314Audi1,2277.6%+ 13.2%52,2737.3%+ 5.1%555Mercedes1,1747.2%– 7.5%42,2757.3%– 3.6%446Renault8205.1%+ 21.3%81,3554.4%+ 30.3%8107Toyota7934.9%– 36.1%61,5875.1%– 25.6%668Hyundai7674.7%+ 9.6%71,4184.6%+ 30.0%799Dacia6273.9%– 27.6%91,1583.7%– 12.3%91110Volvo5563.4%– 17.3%101,0773.5%– 20.9%10711Kia5273.3%+ 3.9%159823.2%+ 9.8%111312Ford5013.1%– 26.4%119823.2%– 22.2%121213Nissan4752.9%+ 198.7%246062.0%+ 148.4%162714Peugeot3972.4%– 16.4%128692.8%– 6.2%131515Porsche3462.1%– 25.6%138142.6%– 15.0%141616Tesla3352.1%– 66.6%175751.9%– 56.8%17817Cupra3312.0%+ 33.5%185661.8%+ 67.0%181918Suzuki3141.9%+ 9.8%205311.7%+ 2.5%191719Mini3041.9%+ 2.0%214951.6%+ 4.2%212320Seat2981.8%– 45.5%147612.5%– 15.6%151421Mazda2501.5%– 12.6%165001.6%– 5.8%201822Opel1891.2%– 12.1%194141.3%– 40.3%222123Land Rover1681.0%– 16.8%233351.1%– 5.6%242624Honda1641.0%– 26.5%252760.9%– 41.9%252225Citroen1510.9%– 18.8%223401.1%– 26.7%232426MG1500.9%new262590.8%new263327Subaru1060.7%+ 35.9%311720.6%– 25.5%272828Mitsubishi950.6%– 67.4%281680.5%– 64.9%282529Polestar920.6%+ 360.0%331410.5%+ 176.5%313430Fiat860.5%– 84.9%271660.5%– 80.1%292031Alfa Romeo860.5%– 12.2%291530.5%– 13.6%303232Jeep720.4%– 43.8%301390.4%– 49.6%322933Lexus700.4%+ 52.2%341160.4%+ 10.5%333034Leapmotor440.3%new35860.3%new356235Smart410.3%– 45.3%321000.3%– 35.5%343136Lamborghini360.2%+ 33.3%37670.2%+ 42.6%364137Ferrari310.2%– 18.4%36620.2%– 18.4%373638Alpine200.1%+ 566.7%41380.1%+ 322.2%394539DS180.1%– 33.3%38430.1%– 23.2%384040Jaguar170.1%+ 30.8%39380.1%+ 2.7%403941KGM/SsangYong160.1%– 61.9%40360.1%– 56.1%413542Genesis150.1%– 11.8%43310.1%– 54.4%423843Aston Martin130.1%+ 8.3%42300.1%+ 57.9%434244Lucid110.1%+ 1000.0%55120.0%+ 1100.0%485645Bentley100.1%– 23.1%44180.1%– 25.0%444446BYD80.0%new45150.0%new455347Maserati80.0%– 55.6%48140.0%– 68.9%463748Cadillac70.0%+ 133.3%46140.0%+ 180.0%474349Lotus50.0%+ 25.0%49100.0%+ 0.0%494850McLaren40.0%+ 300.0%5180.0%+ 100.0%515451Rolls-Royce30.0%– 40.0%47100.0%+ 11.1%505152Dongfeng30.0%new –30.0%new536353Voyah30.0%new –30.0%new545554Man20.0%+ 100.0%5060.0%+ 500.0%525855Aiways10.0%– 90.0%5220.0%– 83.3%555056JAC10.0%– 87.5%5420.0%– 94.1%564757Morgan10.0%– 50.0% –10.0%– 83.3%5757
Switzerland February 2025 – models:
PosModelFeb-25%/24Jan2025%/24PosFY241Audi Q33462.1%+ 43.6%155281.7%+ 28.2%662VW Tiguan3342.1%+ 60.6%36072.0%+ 51.0%133Mercedes GLC3222.0%+ 21.5%45881.9%+ 13.1%344Skoda Kodiaq3151.9%+ 44.5%26021.9%+ 48.6%285VW Golf3021.9%+ 36.0%55671.8%+ 15.2%4106Skoda Octavia2651.6%– 53.2%94921.6%– 54.2%827Skoda Karoq2591.6%– 13.4%75001.6%– 10.4%778Tesla Model Y2441.5%– 68.7%203971.3%– 61.5%1319Dacia Sandero2441.5%– 29.1%84781.5%– 12.3%91310BMW X12431.5%– 22.4%104691.5%– 0.4%11511Dacia Duster2421.5%+ 0.8%283721.2%+ 0.0%161412Renault R52261.4%new373371.1%new1714613Skoda Fabia2231.4%+ 92.2%64701.5%+ 137.4%101614Toyota Yaris2221.4%+ 6.7%144081.3%– 4.4%12915BMW X32041.3%+ 14.0%15491.8%+ 31.3%52016Hyundai Tucson1991.2%+ 35.4%163791.2%+ 50.4%153417Nissan Ariya1941.2%+ 823.8%1492210.7%+ 426.2%4021418Audi A31791.1%– 13.9%113891.3%– 11.0%141919Mini Hatch (incl Cabrio, Clubman)1711.1%– 14.1%382810.9%– 19.7%252920Skoda Enyaq1651.0%– 16.7%233061.0%– 43.0%211121Volvo XC601601.0%– 32.2%173231.0%– 33.8%181822Kia Sportage1591.0%– 28.7%532560.8%– 21.0%292123BMW 1 Series1540.9%+ 1.3%193111.0%– 7.2%202624Audi A11490.9%+ 27.4%472500.8%+ 34.4%304325Audi Q41440.9%+ 51.6%512410.8%+ 31.7%341726Cupra Terramar1420.9%new462450.8%new3118627BMW 3 Series1410.9%– 33.5%212930.9%– 21.7%222328BMW ix11410.9%+ 46.9%272740.9%+ 64.1%265729Seat Ateca1350.8%– 39.2%133221.0%+ 2.9%193530Ford Kuga1330.8%– 28.5%392420.8%– 24.6%333231Nissan Qashqai1300.8%+ 176.6%1681520.5%+ 114.1%708432Peugeot 2081290.8%+ 4.0%182870.9%+ 76.1%234833Volvo EX301280.8%– 19.0%412350.8%– 24.4%351234Toyota Yaris Cross1230.8%– 49.4%242610.8%– 37.1%272535Skoda Elroq1230.8%new –1230.4%new87 –36Suzuki Swift1220.8%+ 71.8%711950.6%+ 51.2%535037Ford Puma1210.7%– 12.9%322430.8%– 1.6%324438Toyota Corolla1160.7%+ 13.7%452200.7%+ 29.4%414539Mercedes A Class1160.7%+ 24.7%342310.7%+ 41.7%383140Hyundai Ioniq 51120.7%+ 16.7%561980.6%+ 52.3%514641Porsche Macan1100.7%+ 14.6%222610.8%– 15.8%283842VW T-Roc1090.7%– 23.2%312320.7%– 30.5%372243Renault Symbioz1080.7%new1301410.5%new8019844Dacia Jogger1070.7%– 55.0%442120.7%– 37.1%444045Mercedes GLA1050.6%– 11.0%542020.7%+ 6.3%492446Renault Captur1050.6%+ 19.3%831680.5%+ 33.3%626047VW Caddy1050.6%+ 43.8%332240.7%+ 105.5%396848Peugeot 20081030.6%+ 98.1%502020.7%+ 61.6%5011149Skoda Kamiq1000.6%+ 56.3%571860.6%+ 53.7%566550Audi Q61000.6%new262350.8%new368251Hyundai Kona990.6%– 41.8%402080.7%– 26.0%462852Mini Countryman990.6%+ 0.0%951500.5%+ 20.0%737853Renault Clio970.6%– 40.1%691720.6%– 41.3%583054BMW 2 Series960.6%– 25.6%422020.7%– 27.3%484155Mercedes V Class960.6%+ 45.5%352110.7%– 13.2%455356Porsche Cayenne950.6%– 45.7%302190.7%– 12.7%427657Mazda CX-5940.6%+ 8.0%631720.6%+ 13.9%597058VW ID.3930.6%– 35.4%671690.5%– 14.2%604259Mercedes GLE930.6%– 23.1%491920.6%– 10.7%545260Citroen C3930.6%+ 9.4%521900.6%– 12.4%556361Ford Custom920.6%+ 338.1%681670.5%+ 475.9%6316562Seat Ibiza910.6%– 35.9%122820.9%+ 14.6%242763Porsche 911900.6%– 34.8%431960.6%– 31.9%526164BMW 5 Series900.6%+ 100.0%292180.7%+ 62.7%437465Hyundai i10890.5%– 4.3%731600.5%+ 28.0%679566Volvo XC90880.5%+ 2.3%641660.5%– 5.7%647367Cupra Tavascan880.5%new1191240.4%new8612768Hyundai i20870.5%+ 0.0%781530.5%+ 27.5%698869Renault Rafale870.5%new811520.5%new7115870VW Passat860.5%– 15.7%591690.5%+ 3.0%617171Cupra Formentor830.5%– 63.8%721550.5%– 48.8%683772Mercedes E Class820.5%+ 78.3%861410.5%+ 93.2%798073Volvo XC40810.5%– 35.7%611620.5%– 39.6%655174Suzuki Ignis780.5%+ 25.8%901320.4%+ 10.0%847275Tesla Model 3770.5%– 64.7%791430.5%– 47.2%773376Range Rover Sport760.5%+ 5.6%801410.5%+ 30.6%789677Audi A6740.5%+ 174.1%661500.5%+ 87.5%7411478Audi A5730.5%+ 231.8%621510.5%+ 268.3%7216479Opel Corsa690.4%– 15.9%361840.6%+ 5.7%579880BMW X5680.4%– 43.8%252040.7%– 37.2%473681Audi Q2670.4%– 36.2%1051100.4%– 61.7%955582Toyota Land Cruiser650.4%+ 1.6%701390.4%+ 44.8%8112183Nissan Juke650.4%+ 91.2%167870.3%+ 81.3%11613584Alfa Romeo Junior640.4%new891180.4%new9025085Kia EV3640.4%new911170.4%new9123886Toyota RAV4630.4%– 50.8%581480.5%– 29.9%755687Renault Espace630.4%– 4.5%160880.3%+ 2.3%11110888Suzuki Vitara620.4%– 23.5%921150.4%– 20.7%939189VW Polo600.4%– 60.3%481600.5%– 38.7%661590Seat Leon600.4%– 34.8%651370.4%– 25.9%826291Kia Cee’d600.4%+ 39.5%146880.3%+ 20.5%11210692BMW 4 Series590.4%– 13.2%1101000.3%+ 2.0%1019793Hyundai Inster590.4%new263640.2%new144 –94Mazda2580.4%+ 1.8%851190.4%+ 1.7%896995Toyota Proace580.4%+ 20.8%931110.4%+ 35.4%9410996Mercedes C Class570.4%– 45.2%751270.4%– 30.2%855497Hyundai i30570.4%+ 67.6%1001040.3%+ 67.7%9810398Honda HR-V560.3%+ 24.4%113960.3%– 40.0%1069299Nissan X-Trail550.3%+ 27.9%1021010.3%+ 77.2%100122100VW Touran530.3%– 32.1%104970.3%– 44.3%10367101Kia Niro530.3%+ 8.2%129860.3%– 31.7%11994102Subaru Forester530.3%+ 278.6%151800.3%+ 233.3%123162103Peugeot 308520.3%– 71.4%601330.4%– 59.0%8349104VW T7520.3%– 48.5%103970.3%– 53.8%10283105Kia Picanto520.3%+ 40.5%106940.3%+ 42.4%108110106VW ID.4520.3%+ 48.6%172730.2%+ 23.7%12979107Peugeot 3008510.3%+ 18.6%551470.5%+ 12.2%76126108BMW ix2510.3%+ 183.3%871060.3%+ 341.7%97133109Mercedes CLE510.3%+ 410.0%114910.3%+ 550.0%109144110Renault Austral490.3%– 60.5%101960.3%– 34.7%10493111Toyota C-HR490.3%– 58.8%118870.3%– 51.9%11559112Ford Focus490.3%– 45.6%741190.4%– 44.1%8877113Suzuki SX4 S-Cross480.3%– 25.0%123830.3%– 23.1%121101114Honda Jazz480.3%– 9.4%115860.3%– 4.4%118119115Polestar 4480.3%new134800.3%new124211116Toyota Aygo470.3%– 50.5%108890.3%– 45.1%110115117Jeep Avenger470.3%– 30.9%116850.3%– 35.1%12099118BMW X2470.3%+ 840.0%881020.3%+ 1033.3%99100119Skoda Superb460.3%– 8.0%761160.4%+ 22.1%9287120Mazda CX-30460.3%– 6.1%96960.3%+ 5.5%105104121MG ZS450.3%new177630.2%new147220122VW T-Cross440.3%– 67.9%109860.3%– 43.4%11764123VW T6430.3%– 6.5%145720.2%– 33.9%13175124Kia Sorento430.3%+ 0.0%821060.3%+ 45.2%96151125Mitsubishi Space Star420.3%– 48.8%141710.2%– 50.7%13266126Leapmotor T03420.3%new133740.2%new128405127Volvo V60410.3%+ 20.6%155670.2%+ 13.6%138107128MG HS410.3%new148680.2%new137268129Audi Q8400.2%– 43.7%125740.2%– 49.0%12785130MG 3400.2%new117780.3%new125195131Opel Astra390.2%– 27.8%142680.2%– 63.2%13658132Kia Stonic390.2%+ 56.0%131710.2%+ 73.2%134128133Polestar 2390.2%+ 95.0%198520.2%+ 2.0%160168134VW ID.Buzz390.2%+ 143.8%98880.3%+ 125.6%114196135Mercedes GLB370.2%– 48.6%122720.2%– 40.0%130102136Mercedes EQA370.2%– 43.1%127710.2%– 32.4%13381137Opel Mokka370.2%+ 60.9%169590.2%– 9.2%151173138Peugeot 5008360.2%+ 260.0%178540.2%+ 25.6%157197139Mercedes CLA350.2%+ 66.7%221440.1%– 6.4%172132140Dacia Spring340.2%– 22.7%84960.3%+ 45.5%107180141Mercedes G Class340.2%– 2.9%171550.2%– 16.7%155149142Mini Aceman340.2%new138640.2%new145267143Fiat 600330.2%+ 43.5%126670.2%+ 28.8%139169144Ford Explorer330.2%+ 312.5%164560.2%+ 80.6%153159145Renault Scenic330.2%+ 1000.0%97820.3%+ 1071.4%122112146BMW i4300.2%– 28.6%128630.2%– 30.8%146139147BMW X7300.2%+ 3.4%152560.2%– 11.1%152140148Ford Courier300.2%+ 400.0%170510.2%+ 750.0%163232149VW ID.7300.2%+ 650.0%124650.2%+ 828.6%141163150Fiat 500290.2%– 90.3%136600.2%– 85.5%15039151Skoda Scala290.2%+ 31.8%107710.2%+ 47.9%135116152Hyundai Santa Fe290.2%+ 93.3%121640.2%+ 137.0%143181153Lamborghini Urus290.2%+ 107.1%174490.2%+ 75.0%166243154Audi Q5270.2%– 69.0%99740.2%– 57.5%12647155Range Rover Evoque270.2%– 20.6%184430.1%– 20.4%173171156BMW i5270.2%+ 50.0%120620.2%+ 55.0%148170157Honda CR-V260.2%– 31.6%204370.1%– 57.5%182148158Toyota bZ4X250.2%– 65.8%112660.2%– 45.0%140166159Honda Civic250.2%– 40.5%182410.1%– 34.9%176161160Range Rover 250.2%– 37.5%163490.2%– 37.2%165124161Subaru Crosstrek250.2%+ 316.7%144540.2%– 53.4%158113162Volvo EX90250.2%new137560.2%new154277163Renault Kangoo240.1%– 7.7%143530.2%– 10.2%159157164Mitsubishi ASX230.1%– 77.7%180400.1%– 73.9%177123165Mercedes Vito230.1%– 67.1%111640.2%– 41.3%14290166Smart #1220.1%– 52.2%150490.2%– 51.5%164141167Land Rover Defender220.1%– 31.3%132540.2%– 21.7%156150168Porsche Taycan220.1%+ 15.8%140520.2%+ 33.3%161177169Lexus RX210.1%+ 200.0%279250.1%+ 0.0%201240170Volvo EX40210.1%new181380.1%new181185171Ford Connect200.1%– 64.3%154460.1%– 44.6%168129172Opel Grandland X200.1%– 28.6%159450.1%– 74.4%170153173Kia EV9200.1%– 4.8%162440.1%– 33.3%171167174Nissan Townstar200.1%+ 185.7%230280.1%+ 180.0%191293175Mitsubishi Colt190.1%– 62.7%166410.1%– 59.0%175125176Mazda CX-60190.1%– 58.7%175390.1%– 47.3%178134177Kia EV6190.1%– 50.0%77880.3%+ 10.0%113145178Smart #3190.1%– 26.9%135510.2%+ 10.9%162152179Lexus LBX190.1%new176380.1%new180179180Audi Q7180.1%– 56.1%147450.1%– 38.4%169155181Cupra Born180.1%– 5.3%161420.1%+ 16.7%17486182Citroen Berlingo180.1%+ 5.9%242240.1%– 48.9%202187183Porsche Panamera180.1%+ 350.0%139480.2%+ 182.4%167231184Toyota Prius170.1%– 69.1%214270.1%– 69.0%192192185Subaru Outback170.1%+ 0.0%255230.1%– 25.8%206189186Alfa Romeo Stelvio170.1%+ 30.8%224250.1%– 24.2%199213187Hyundai Ioniq 6160.1%– 57.9%188310.1%– 42.6%189191188Peugeot Traveller160.1%– 40.7%223250.1%– 66.2%196217189Lexus NX160.1%– 38.5%220250.1%– 34.2%197182190Opel Combo160.1%+ 166.7%206270.1%+ 58.8%193223191Mercedes EQE150.1%– 70.6%183310.1%– 58.1%188136192VW Touareg140.1%– 36.4%208250.1%– 34.2%198172193Hyundai Bayon130.1%– 18.8%165350.1%+ 52.2%185233194BMW X6130.1%– 18.8%173330.1%– 25.0%186178195Mercedes B Class130.1%+ 0.0%201250.1%– 26.5%200194196Citroen Jumpy130.1%+ 85.7%196260.1%+ 160.0%195275197Alpine A290130.1%new209230.1%new208380198Citroen C5 Aircross120.1%– 66.7%179290.1%– 53.2%190154199Renault Arkana120.1%– 63.6%207230.1%– 58.2%205131200Seat Arona120.1%– 33.3%232200.1%– 37.5%215138201Mercedes GLS120.1%– 20.0%193260.1%+ 0.0%194216202VW Taigo120.1%– 7.7%156380.1%+ 22.6%179137203Kia Xceed110.1%– 42.1%219200.1%– 28.6%214210204Jeep Wrangler110.1%– 8.3%248170.1%– 19.0%226221205Nissan Primastar110.1%+ 120.0%252170.1%+ 54.5%227298206Mazda MX-5110.1%+ 175.0%238180.1%+ 20.0%222236207Lucid Air110.1%+ 1000.0%331120.0%+ 1100.0%254334208Mazda CX-80110.1%new158360.1%new184259209Mitsubishi Eclipse Cross100.1%– 81.8%268150.0%– 81.7%233188210Mazda3100.1%– 54.5%249160.1%– 55.6%228184211Land Rover Discovery Sport100.1%– 28.6%205210.1%+ 10.5%212229212BMW Z4100.1%– 28.6%260150.0%– 16.7%235248213BMW XM100.1%– 23.1%153360.1%+ 50.0%183206214Citroen C4 100.1%+ 0.0%94610.2%+ 144.0%149245215VW ID.5100.1%+ 11.1%215200.1%– 4.8%217241216MG 4100.1%new194240.1%new204258217MG Cyberster100.1%new213200.1%new219359218Fiat Tipo90.1%– 83.3%246150.0%– 81.0%234207219Jaguar E-Pace90.1%+ 12.5%211190.1%+ 0.0%220246220Ferrari SF9090.1%+ 28.6%275130.0%+ 18.2%247301221Ferrari 29690.1%+ 50.0%244150.0%– 11.8%237239222BMW X480.0%– 71.4%192220.1%– 55.1%209174223Peugeot Rifter80.0%– 66.7%222170.1%– 63.8%224215224Ford Mustang Mach-E80.0%– 42.9%187230.1%– 56.6%207143225Mercedes AMG GT80.0%– 42.9%200200.1%– 4.8%216244226BMW 7 Series80.0%– 38.5%32190.0%– 43.8%267270227Genesis GV7080.0%– 20.0%234150.0%– 53.1%236222228Lexus UX80.0%+ 33.3%265130.0%– 23.5%248252229Tesla Model X80.0%+ 166.7%186240.1%+ 33.3%203202230BMW IX70.0%– 85.1%157320.1%– 68.6%187156231Mercedes S Class70.0%– 63.2%239140.0%– 60.0%239208232Porsche Boxster70.0%– 58.8%191220.1%– 12.0%210200233Mercedes EQB70.0%– 58.8%250130.0%– 48.0%244176234Jeep Renegade70.0%– 46.2%218160.1%– 54.3%230219235Maserati Grecale70.0%– 36.4%36870.0%– 78.1%285183236Mercedes Sprinter70.0%– 12.5%197200.1%+ 11.1%218226237Ferrari Roma70.0%– 12.5%245130.0%– 7.1%246272238Ssangyong Torres70.0%+ 16.7%240140.0%+ 16.7%241242239Kia Pro Cee’d70.0%+ 16.7%32980.0%– 33.3%278237240Hyundai Staria70.0%+ 75.0%189220.1%+ 100.0%211247241Jaguar F-Pace70.0%+ 133.3%217160.1%+ 77.8%231262242Alpine A11070.0%+ 133.3%225150.0%+ 66.7%238249243BMW 8 Series70.0%+ 133.3%30190.0%+ 28.6%270290244Volvo EC4070.0%new256130.0%new250278245Audi A460.0%– 89.7%216150.0%– 87.9%232118246Renault Twingo60.0%– 76.0%253120.0%– 55.6%252228247Renault Trafic60.0%– 75.0%31080.0%– 80.0%275193248DS 760.0%– 64.7%203170.1%– 51.4%225230249Genesis GV6060.0%– 14.3%228140.0%– 39.1%240251250DS 360.0%+ 20.0%274100.0%– 9.1%263304251Ford Mustang60.0%+ 200.0%247120.0%+ 200.0%253253252Tesla Model S60.0%+ 200.0%269110.0%+ 0.0%258201253BYD Seal60.0%new28890.0%new272328254Fiat Panda50.0%– 95.4%226130.0%– 92.4%243105255Fiat 500X50.0%– 92.8%32660.0%– 93.4%291199256Honda e:Ny150.0%– 64.3%27690.0%– 59.1%266190257Opel Zafira50.0%– 50.0%231130.0%– 51.9%245265258Range Rover Velar50.0%– 37.5%195190.1%– 5.0%221227259Mercedes EQS50.0%– 37.5%29280.0%– 61.9%277205260Bentley Continental GT50.0%– 16.7%27390.0%– 18.2%269285261Lexus RZ50.0%+ 66.7%229130.0%+ 0.0%249297262Subaru Soltera50.0%+ 150.0%29580.0%+ 300.0%281289263Aston Martin DB1250.0%+ 150.0%31860.0%+ 200.0%293295264Ford Bronco50.0%+ 400.0%262100.0%+ 900.0%264329265Subaru Impreza50.0%+ 400.0%33660.0%+ 50.0%296235266Cadillac Lyriq50.0%n/a233120.0%+ 500.0%255255267Polestar 350.0%new28390.0%new273280268Renault Mégane40.0%– 96.2%185200.1%– 87.3%21389269Alfa Romeo Tonale40.0%– 94.8%27080.0%– 93.7%274142270Honda ZR-V40.0%– 86.7%29070.0%– 85.7%284120271Jeep Compass40.0%– 85.7%235110.0%– 84.1%257212272Porsche Cayman40.0%– 75.0%202160.1%– 42.9%229224273Ssangyong Tivoli40.0%– 63.6%254100.0%– 66.7%260269274Ferrari Purosangue40.0%– 60.0%26190.0%– 50.0%268254275Mercedes T Class40.0%– 42.9%251100.0%– 16.7%262287276DS 440.0%– 20.0%210140.0%+ 55.6%242279277Bentley Bentayga40.0%– 20.0%29960.0%– 33.3%292312278Aston Martin DBX40.0%+ 300.0%25790.0%+ 200.0%271303279Lamborghini Revuelto40.0%new27880.0%new283318280MG Marvel40.0%new30860.0%new297315281Lamborghini Huracan30.0%– 76.9%237100.0%– 47.4%259273282Jeep Grand Cherokee30.0%– 57.1%236100.0%– 50.0%261281283Ssangyong Rexton30.0%– 40.0%28470.0%– 53.3%287234284Volvo V9030.0%– 40.0%31550.0%– 50.0%301286285Lotus Eletre30.0%– 25.0%26680.0%– 11.1%279299286Opel Vivaro30.0%+ 0.0%190180.1%+ 125.0%223309287Audi A730.0%+ 0.0%32040.0%– 33.3%305308288Land Rover Discovery30.0%+ 50.0%26480.0%+ 14.3%280314289BMW i730.0%+ 50.0%28660.0%+ 50.0%294305290Alpina B3 Biturbo30.0%+ 200.0%27170.0%+ 133.3%288326291Rolls-Royce Ghost30.0%+ 200.0%33440.0%+ 33.3%307385292VW Crafter30.0%+ 200.0%38830.0%– 40.0%318338293McLaren 750S30.0%n/a37230.0%+ 200.0%319349294Dongfeng Box30.0%new –30.0%new321 –295Voyah Free30.0%new38630.0%new322331296Citroen C3 Aircross20.0%– 93.5%30240.0%– 96.1%303130297Toyota GR8620.0%– 91.7%38320.0%– 95.6%327175298Ssangyong Korando20.0%– 90.0%29450.0%– 80.0%299257299Mercedes EQV20.0%– 80.0%26770.0%– 46.2%286291300Fiat Ulysse20.0%– 77.8%39220.0%– 91.7%329302301Mercedes EQC20.0%– 71.4%37520.0%– 80.0%331225302Suzuki Swace20.0%– 66.7%38220.0%– 83.3%332276303Mercedes SL Class20.0%+ 0.0%30740.0%– 20.0%306266304Aston Martin V8 Vantage20.0%+ 100.0%25870.0%+ 250.0%289342305Man TGE20.0%+ 100.0%28060.0%+ 500.0%295356306Aston Martin Vanquish20.0%n/a25970.0%n/a290 –307Citroen SpaceTourer20.0%n/a28950.0%n/a302392308Alpina XD3 Biturbo20.0%n/a33920.0%+ 0.0%334346309DS 920.0%n/a42420.0%+ 100.0%335412310Lotus Emira20.0%n/a36620.0%+ 100.0%337336311Leapmotor C1020.0%new212120.0%new256426312Ford Capri20.0%new227100.0%new265313313Ferrari 12Cilidri20.0%new24380.0%new282442314BYD Sealion 720.0%new32230.0%new320 –315Fiat Pandina20.0%new –20.0%new338 –316Toyota Highlander10.0%– 96.4%28550.0%– 86.5%298204317Volvo C4010.0%– 95.7%24180.0%– 81.4%276203318Renault Zoe10.0%– 92.9%31130.0%– 90.9%311218319Mercedes Citan10.0%– 90.0%28250.0%– 66.7%300264320Aiways U510.0%– 90.0%31620.0%– 83.3%328294321Ford Transit10.0%– 88.9%35310.0%– 93.3%343323322Alfa Romeo Giulia10.0%– 87.5%31720.0%– 88.9%330256323Peugeot 40810.0%– 85.7%30930.0%– 72.7%312261324Audi e-tron GT10.0%– 83.3%29830.0%– 50.0%313296325Peugeot 50810.0%– 83.3%37710.0%– 87.5%344292326Toyota Camry10.0%– 80.0%29640.0%– 42.9%304283327Mazda610.0%– 66.7%30630.0%– 76.9%314310328Toyota Supra10.0%– 66.7%31430.0%– 50.0%315311329Subaru BRZ10.0%– 66.7%3791 0.0%– 66.7%345345330Volvo S6010.0%– 66.7%38510.0%– 75.0%346324331Bentley Flying Spur10.0%– 50.0%30030.0%– 25.0%316350332Suzuki Across10.0%– 50.0%31330.0%– 25.0%317263333Cadillac Escalade10.0%– 50.0%34210.0%– 50.0%347357334Toyota Mirai10.0%+ 0.0%33720.0%+ 100.0%333395335Cadillac XT410.0%+ 0.0%41110.0%+ 0.0%348394336Morgan Plus 610.0%+ 0.0%40610.0%– 50.0%349386337Lexus LM10.0%new33020.0%new336375338Alpina B4 Biturbo10.0%n/a41810.0%n/a350406339Citroen Jumper10.0%n/a46510.0%n/a351 –340Fiat Ducato10.0%n/a45110.0%n/a352447341Genesis GV8010.0%n/a39510.0%– 87.5%353327342Jaguar XF10.0%n/a35810.0%+ 0.0%354337343Maserati Ghibli10.0%n/a36710.0%+ 0.0%355335344Mitsubishi Outlander10.0%n/a42610.0%n/a356415345Suzuki Jimny10.0%n/a38110.0%n/a357300346JAC E30X10.0%new –10.0%new358 –347McLaren GTS10.0%new37310.0%new359419348VW Tayron10.0%new –10.0%new360 –
Source: Auto Suisse


More Stories
Reasons The Audi Concept C Marks An Exciting New Era For Electric Sports Cars
Audi has taken a confident step back into the spotlight. The Concept C is not another cautious design study or...
Lexus ES by Modellista Gets Modest Exterior Tweaks
Even if Lexus is considered the luxury arm of Toyota, the company tried to invest money and dedication into creating...
The 2027 Chevy Silverado Leaks Early, and It Feels Exactly Like That Kind of Update
I wasn’t really expecting to see the 2027 Chevy Silverado this way, but here we are. Leaked images tend to...
The ‘Always Ready’ Angel BS200 Super Starter
Today I’m bringing you an exclusive review for My Car Heaven. If you’ve ever faced the frustration of a car...
BSCB needs your help!
BSCB needs your help today. In particular for two markets whose data source has gone silent in recent months: the...
Explore: The cars of Morocco
Dacia Logan taxi in Chefchaouen, Morocco In December and January I was lucky enough to visit Fès and Chefchaouen in...