
Netherlands February 2025: Kia monopolises podium, EV3 repeats at #1
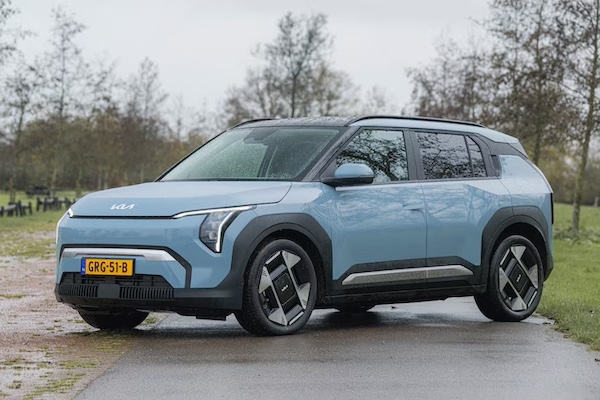
The new Kia EV3 is the best-selling vehicle in the Netherlands once again.
27,820 new cars found a Dutch home in February, that’s a -8.3% year-on-year decline, bringing the year-to-date tally down -3.7% to 60,431. Hybrids hold 44.9% of the market, BEVs are at 36.6%, petrol at 17.2% and diesel at 1.1%. Kia (-3.7%) continues to dominate the charts head and shoulders with 12.6% share, identical to last month. Far below is a struggling Toyota (-27.7%) at 6.9% while BMW (+13.4%) advances to #3 with 6.3%. Hyundai (-13.6%) is having a hard time year-on-year but is up to #4 overall. Ford (+60.3%) scores the largest uptick in the Top 15 and ranks #6 vs. #13 over the Full Year 2024. Mitsubishi (+64.3%), Mini (+62.8%) and Audi (+40.4%) are also strong below.
Model-wise, the new Kia EV3 brilliantly repeats at #1, and with a large margin at that: 4.4% share vs. 2.5% for the #2, the Kia Picanto (-28.2%). Kia monopolises the podium this month with the Niro (-2%) up four spots on January to #3. The Citroen C3 (+283.8%) is the best of the rest at #4, up a fantastic 34 ranks on last month. The Ford Kuga (+93.9%) also surges ahead to #5, with the Volvo EX30 (+50.6%), Opel Corsa (+46%) and Hyundai Kona (+38.7%) standing out further down.
Previous month: Netherlands January 2025: Kia EV3 storms into pole position
One year ago: Netherlands February 2024: Volvo XC40 distant leader, sales up 8.9%
Full February 2025 Top 55 All brands and Top 320 All models below.
Netherlands February 2025 – brands:
PosBrandFeb-25%/24Jan2025%/24PosFY241Kia3,51712.6%– 3.7%17,61612.6%+ 32.9%112Toyota1,9296.9%– 27.7%63,7246.2%– 33.1%433BMW1,7406.3%+ 13.4%43,7696.2%+ 7.5%374Hyundai1,6295.9%– 13.6%53,3965.6%– 25.2%685Renault1,5375.5%+ 4.8%112,7434.5%– 1.1%996Ford1,4975.4%+ 60.3%102,9554.9%+ 65.7%8137Volkswagen1,4105.1%+ 8.0%24,2267.0%+ 10.3%258Volvo1,3524.9%– 49.3%33,4875.8%– 30.0%529Peugeot1,2774.6%– 9.6%72,9754.9%+ 5.2%71010Skoda1,0003.6%– 47.9%92,5024.1%– 44.9%10611Mercedes9953.6%– 12.7%122,1343.5%– 9.5%121212Audi9843.5%+ 40.4%82,4954.1%+ 11.0%111113Tesla9833.5%– 23.6%151,9083.2%– 34.1%13414Opel9353.4%+ 16.3%141,8623.1%+ 8.7%141415Mazda7912.8%+ 11.7%221,2432.1%– 11.4%161716Citroen7352.6%+ 31.5%211,1882.0%+ 21.5%172117Mini7082.5%+ 62.8%191,1651.9%+ 27.2%181818Mitsubishi5672.0%+ 64.3%231,0101.7%+ 16.4%192219Suzuki4691.7%– 29.8%131,4672.4%– 21.3%151520Dacia3641.3%– 30.0%246921.1%– 35.2%241621Land Rover3631.3%+ 22.2%188541.4%+ 7.0%212522Nissan3631.3%– 34.2%207841.3%– 22.5%222023Seat3451.2%– 16.1%169031.5%– 24.8%201924Cupra3031.1%+ 191.3%265410.9%+ 127.3%252825BYD2510.9%+ 34.2%254900.8%+ 29.3%262426Porsche2340.8%– 24.0%177371.2%+ 25.8%232727Jeep1790.6%– 46.4%273930.7%– 52.9%272628Polestar1570.6%+ 76.4%342740.5%+ 35.6%313029MG1370.5%– 26.7%332500.4%– 24.9%322930Fiat1250.4%– 66.0%283090.5%– 55.8%282331Dongfeng1170.4%new302810.5%new304232Lexus1080.4%+ 86.2%292890.5%+ 122.3%293433Honda910.3%– 21.6%312230.4%– 17.7%333334Lynk & Co750.3%– 73.2%321980.3%– 62.8%343135Alfa Romeo720.3%+ 148.3%371550.3%+ 162.7%363836Xpeng670.2%+ 39.6%361590.3%+ 1.9%353237Zeekr500.2%+ 13.6%39970.2%– 18.5%373638Smart350.1%– 31.4%38940.2%– 29.9%393539DS210.1%– 48.8%42500.1%– 40.5%413740Bentley180.1%+ 125.0%40510.1%+ 112.5%404541Subaru150.1%+ 114.3%43270.0%+ 12.5%434942Lancia140.1%new41440.1%new424643NIO120.0%– 40.0%44260.0%– 56.7%443944Ferrari110.0%– 31.3%49210.0%– 4.5%454345Leapmotor60.0%new35960.2%new385046Lamborghini60.0%+ 0.0%50150.0%+ 36.4%475347Alpine60.0%+ 500.0%52110.0%+ 266.7%515848Jaguar50.0%– 37.5%47160.0%– 51.5%464449SsangYong30.0%+ 200.0%46150.0%+ 650.0%484750Aston Martin30.0%– 50.0%5380.0%+ 0.0%525551Maserati30.0%n/a5560.0%+ 20.0%545752Abarth30.0%– 50.0%5750.0%– 50.0%555153Vinfast20.0%new5650.0%new565654Lotus10.0%– 93.8%48120.0%– 61.3%504155Lucid10.0%new –10.0%new5954 –Others1990.7%+ 14.4% –4090.7%+ 21.4% – –
Netherlands February 2025 – models:
PosModelFeb-25%/24Pos2025%/24PosFY241Kia EV31,2264.4%new12,9834.9%new12352Kia Picanto6912.5%– 28.2%21,5442.6%+ 1.5%263Kia Niro6812.4%– 2.0%71,2392.1%+ 20.8%324Citroen C36142.2%+ 283.8%388651.4%+ 129.4%16605Ford Kuga5992.2%+ 93.9%151,0561.7%+ 56.7%6186Tesla Model Y5371.9%– 11.7%121,0191.7%– 41.7%917Toyota Aygo X5011.8%– 23.6%101,0251.7%– 16.9%878Toyota Yaris Cross4801.7%– 19.7%179151.5%– 31.3%12109Volvo EX304761.7%+ 50.6%41,2002.0%+ 187.8%4310Opel Corsa4511.6%+ 46.0%61,0501.7%+ 48.1%71611Hyundai Kona4481.6%+ 38.7%139011.5%– 24.7%13812Tesla Model 34371.6%– 34.9%198681.4%– 23.1%14413Peugeot 2084111.5%– 29.3%31,1872.0%+ 20.0%51114Hyundai Inster4061.5%new237361.2%new2029815Skoda Kodiaq4001.4%+ 440.5%89531.6%+ 261.0%112516BMW iX13991.4%+ 155.8%316761.1%+ 69.4%212117Mazda CX-53941.4%+ 25.5%894980.8%– 3.7%336618Hyundai i103881.4%– 52.3%188201.4%– 45.3%171319Toyota Yaris3871.4%– 13.0%207491.2%– 28.8%191220Renault 53801.4%new755060.8%new3217721Mini3241.2%+ 18.7%485240.9%– 15.9%302722Renault Clio3171.1%– 19.5%246241.0%– 29.7%241423Suzuki Swift3161.1%+ 129.0%98661.4%+ 111.7%154624Volvo XC40/EX403131.1%– 78.3%167571.3%– 70.6%18525Ford Puma2941.1%+ 28.4%226361.1%+ 76.7%233526VW Tiguan2871.0%+ 106.5%365490.9%+ 77.1%282827VW Polo2771.0%+ 45.0%59731.6%+ 5.1%10928Opel Astra2761.0%+ 58.6%654280.7%+ 9.2%405929Audi Q6 e-Tron2691.0%new255761.0%new2612430Kia Ceed2510.9%– 51.6%534290.7%– 44.2%392631Kia Sportage2420.9%– 60.5%265420.9%– 44.0%292032Ford Explorer EV2420.9%new394930.8%new34 –33Mitsubishi Colt2310.8%+ 250.0%544090.7%+ 86.8%4311834Peugeot 20082280.8%– 36.7%285130.8%– 36.1%311935Ford Focus2160.8%+ 40.3%354780.8%+ 37.0%373036Kia Stonic2120.8%– 3.6%334810.8%+ 22.4%354237Audi Q42120.8%+ 59.4%215670.9%+ 82.3%271738Mini Countryman2080.7%+ 87.4%923080.5%+ 93.7%606439Peugeot 30082040.7%+ 102.0%454160.7%+ 97.2%416740Volvo XC602000.7%– 39.0%146631.1%– 4.6%222341VW Golf1960.7%– 30.2%324640.8%– 22.1%383942BMW 5-Series1940.7%+ 65.8%304800.8%+ 114.3%367043Peugeot 3081910.7%+ 6.1%434150.7%– 4.2%425044Mitsubishi Space Star1830.7%+ 9.6%1442360.4%– 29.3%768145BMW 1-Series1830.7%+ 177.3%503760.6%+ 66.4%517946Peugeot 50081810.7%+ 41.4%703190.5%+ 29.7%5811747BMW 3-Series1790.6%– 46.9%593370.6%– 44.1%544848Toyota C-HR1780.6%– 13.2%872820.5%– 9.9%643649Nissan Qashqai1760.6%– 44.7%463840.6%– 27.1%494050Mini Aceman1760.6%new613330.6%new5518951Seat Ibiza1730.6%– 8.5%423980.7%– 24.5%464952Audi A31710.6%+ 23.9%414030.7%– 24.1%455253Skoda Octavia1690.6%– 73.6%404070.7%– 71.4%441554Toyota Corolla Cross1660.6%– 26.2%573310.5%– 49.5%563155Renault Captur1620.6%– 44.7%493620.6%– 31.6%532956Renault Scenic E-Tech1570.6%new1042470.4%new745157Renault Symbioz1520.5%new952470.4%new7514758Opel Mokka1480.5%– 32.7%862560.4%– 28.7%729759Mazda21470.5%– 10.4%842600.4%– 15.9%705760BMW X11410.5%– 35.0%563090.5%– 13.7%594461Volvo XC901360.5%+ 41.7%792550.4%+ 0.8%739562Hyundai Tucson1310.5%– 57.7%343870.6%– 47.5%483363Renault Austral1300.5%– 21.7%602880.5%– 12.2%625564Jeep Avenger1280.5%– 59.0%622830.5%– 62.6%634565Range Rover Sport1280.5%+ 32.0%712610.4%+ 10.6%6910766Dongfeng Box1170.4%new582810.5%new6524567BMW i41160.4%– 39.6%632710.4%– 37.3%675468VW T-Cross1140.4%+ 123.5%662630.4%+ 44.5%685669Mercedes A-Class1100.4%– 20.3%1121910.3%– 26.5%897570Volvo V601090.4%– 65.0%373630.6%– 32.7%522471Skoda Enyaq1090.4%– 60.5%832230.4%– 64.4%812272Mitsubishi ASX1070.4%+ 78.3%762310.4%+ 28.3%7911373Mazda CX-301050.4%+ 43.8%971990.3%+ 4.2%8510174BYD Atto 31040.4%– 16.1%1551490.2%– 43.8%1089175Mercedes EQA1040.4%+ 7.2%1031940.3%+ 20.5%878076VW T-Roc1030.4%– 56.5%473010.5%– 52.1%613277Dacia Spring1010.4%+ 20.2%1391590.3%+ 8.2%1029678Toyota Corolla1000.4%– 65.6%1051890.3%– 55.7%925379Seat Leon990.4%– 13.9%443210.5%+ 0.0%579280VW ID.4990.4%+ 125.0%273910.6%+ 551.7%477481Audi A1970.3%+ 54.0%981900.3%+ 42.9%9011182Suzuki Vitara960.3%– 51.0%293840.6%– 27.8%505883Porsche Macan940.3%+ 3033.3%512800.5%+ 2445.5%6614684Polestar 2930.3%+ 4.5%1461450.2%– 28.2%1117385Mercedes GLC-Class920.3%– 22.7%692340.4%– 31.0%778986Dacia Sandero910.3%– 39.7%1311540.3%– 61.7%1054387Dacia Duster910.3%– 5.2%802090.3%+ 25.1%836888Mercedes E-Class880.3%+ 22.2%722160.4%+ 72.8%8211689VW ID.7850.3%+ 193.1%672300.4%+ 248.5%809390Mercedes EQB840.3%– 10.6%881890.3%– 0.5%916991Dacia Jogger810.3%– 57.1%1061700.3%– 51.7%996292Mercedes C-Class790.3%– 12.2%941770.3%+ 4.7%9610993Cupra Terramar790.3%new1251470.2%new10926994Land Rover Defender780.3%+ 11.4%821930.3%+ 22.9%8814295Cupra Tavascan780.3%new1581230.2%new12820596Nissan Juke770.3%– 44.6%742030.3%– 24.8%847797Skoda Kamiq770.3%– 34.7%522600.4%– 33.7%714198Hyundai Ioniq5770.3%– 16.3%1141560.3%– 27.4%10412699Renault Arkana760.3%– 61.8%1261430.2%– 48.2%11283100VW ID.3760.3%– 2.6%115961.0%+ 457.0%2563101Kia EV6750.3%– 74.2%1351360.2%– 70.4%11738102Mercedes CLA-Class750.3%– 27.9%1271400.2%– 33.0%11690103BMW IX2730.3%+ 1360.0%1231460.2%+ 2820.0%110122104Renault Megane E-Tech700.3%– 69.2%1321330.2%– 67.4%11865105BMW X3700.3%+ 105.9%1021600.3%+ 49.5%100162106Ford Tourneo/Transit Custom690.2%n/a1401260.2%+ 6200.0%126247107Lynk & Co 01680.2%– 75.7%811820.3%– 65.8%9571108BMW i5670.2%+ 8.1%851760.3%+ 4.8%9782109Range Rover Evoque660.2%+ 230.0%1101520.3%+ 85.4%107167110BYD Seal U660.2%n/a1001600.3%+ 540.0%101127111Hyundai i20650.2%– 58.3%1301280.2%– 69.4%12387112Fiat 600650.2%+ 242.1%1181400.2%+ 311.8%115139113Skoda Fabia620.2%– 82.9%731880.3%– 66.0%9347114Toyota RAV4610.2%– 54.5%1621040.2%– 66.6%14098115Cupra Born590.2%– 14.5%176930.2%– 42.6%14778116Polestar 4590.2%new1421150.2%new131190117Nissan Ariya580.2%+ 41.5%1561030.2%+ 9.6%141144118Audi A6 E-tron580.2%new196810.1%new163 –119Porsche Cayenne560.2%– 75.0%552330.4%– 28.5%7884120Mercedes Sprinter560.2%+ 3.7%197780.1%– 25.0%166131121Skoda Elroq560.2%new219690.1%new175 –122Volvo C40/EC40550.2%– 57.0%1151320.2%– 65.5%12085123Alfa Romeo Junior 550.2%new1241270.2%new125238124Suzuki SX4 S-Cross540.2%– 66.7%681980.3%– 47.1%86108125Mazda CX-60530.2%+ 26.2%202730.1%– 42.1%173141126Renault Rafale 520.2%new174880.1%new155186127Kia EV9500.2%– 64.5%1431050.2%– 61.3%138102128Kia Proceed500.2%– 45.1%182810.1%– 42.6%165128129BMW X5500.2%+ 28.2%771710.3%– 31.3%9888130Ford Mustang Mach-E500.2%+ 85.2%165920.2%+ 35.3%149125131BMW 2-Series Gran Coupe500.2%+ 150.0%1281150.2%+ 22.3%130174132VW Passat490.2%+ 88.5%1011410.2%+ 235.7%114130133Cupra Leon490.2%+ 226.7%153970.2%+ 185.3%143182134Lexus LBX490.2%new901530.3%new106134135Skoda Karoq480.2%– 75.8%1131280.2%– 78.8%12472136BMW iX3480.2%– 40.0%1291120.2%– 25.8%133121137Toyota bZ4X460.2%– 37.0%150940.2%– 34.7%146103138Porsche 911/Carrera460.2%– 23.3%1331090.2%– 24.8%135181139Volvo EX90460.2%new167870.1%new158273140Mercedes EQE SUV450.2%+ 2.3%1341080.2%+ 3.8%136151141MG ZS450.2%+ 15.4%183740.1%+ 10.4%170180142BYD Dolphin440.2%– 2.2%179770.1%+ 37.5%168136143Mercedes GLA-Class440.2%+ 0.0%151920.2%– 7.1%153150144BMW 2-Series Tourer430.2%– 6.5%159870.1%– 29.3%157163145Honda HR-V430.2%+ 19.4%148920.2%– 8.0%150185146Mercedes GLE-Class430.2%+ 43.3%1111290.2%+ 92.5%122166147Mazda3420.2%– 6.7%147940.2%– 14.5%145135148Skoda Superb410.1%– 37.9%911420.2%– 34.9%11394149Range Rover 400.1%– 38.5%1191140.2%– 38.7%132129150Citroen C5 Aircross390.1%– 62.1%187670.1%– 57.1%178132151Renault Espace390.1%– 53.6%137970.2%– 38.2%144110152Skoda Scala380.1%– 79.1%961320.2%– 71.1%11986153Cupra Formentor380.1%+ 90.0%164810.1%+ 92.9%164170154MG 3380.1%new168780.1%new167159155Opel Grandland X370.1%– 9.8%154830.1%– 29.1%161161156Seat Ateca370.1%+ 270.0%171740.1%+ 8.8%171156157Audi Q2360.1%+ 12.5%781560.3%+ 16.4%103119158Seat Arona360.1%+ 125.0%1201100.2%+ 52.8%134114159Audi A5350.1%+ 75.0%991290.2%+ 115.0%121168160Fiat Panda350.1%+ 337.5%172720.1%+ 71.4%174176161Mercedes Vito340.1%+ 70.0%152820.1%+ 49.1%162192162BYD Seal340.1%+ 183.3%149830.1%+ 219.2%160148163Zeekr X340.1%+ 750.0%175680.1%+ 300.0%177172164Xpeng G6340.1%new138930.2%new148154165Hyundai Bayon330.1%– 64.1%107920.2%– 55.8%151112166Land Rover Discovery Sport330.1%+ 43.5%141890.1%+ 29.0%154201167Citroen C4 320.1%– 76.6%641860.3%– 21.5%94115168MG 4320.1%– 62.8%201490.1%– 74.1%188100169BMW 4-Series320.1%+ 0.0%1171070.2%+ 17.6%137157170Mazda CX-80320.1%new166740.1%new169248171Mitsubishi Eclipse Cross310.1%– 40.4%1081190.2%– 11.9%129104172Xpeng G9310.1%– 32.6%186590.1%– 58.2%182123173Kia Sorento310.1%– 18.4%190580.1%+ 18.4%183155174Hyundai Santa Fe300.1%+ 76.5%1211040.2%+ 60.0%139199175Hyundai Ioniq 6290.1%– 47.3%255350.1%– 78.1%207137176Peugeot Expert290.1%+ 625.0%240380.1%+ 153.3%203268177Audi Q8280.1%+ 100.0%157730.1%+ 102.8%172165178Nissan X-Trail270.1%+ 92.9%193510.1%+ 59.4%187194179VW ID.BUZZ270.1%+ 440.0%204460.1%+ 119.0%193229180Mercedes B-Class260.1%– 53.6%225370.1%– 62.6%205145181VW Taigo260.1%– 31.6%931250.2%– 48.3%12761182Lexus NX260.1%+ 0.0%177600.1%+ 46.3%181220183Fiat 500240.1%– 92.9%136840.1%– 85.9%15937184Nissan Leaf240.1%– 40.0%145420.1%– 51.7%199171185Peugeot 408240.1%– 36.8%160680.1%– 29.2%176153186Audi Q3230.1%– 51.1%116980.2%– 45.6%142106187Jeep Compass230.1%+ 109.1%198440.1%+ 46.7%197191188Opel Vivaro230.1%+ 109.1%216360.1%+ 33.3%206187189Audi Q7230.1%+ 475.0%184530.1%+ 341.7%185207190Porsche Panamera230.1%+ 666.7%169620.1%+ 226.3%180210191Hyundai i30220.1%– 18.5%210370.1%– 14.0%204208192Jeep Renegade220.1%+ 144.4%192480.1%+ 17.1%189226193Citroen Jumpy220.1%+ 450.0%249300.0%+ 500.0%210173194Smart #1210.1%– 19.2%188480.1%– 51.5%190143195Ford Capri210.1%new195460.1%new191246196Honda CR-V200.1%– 25.9%215330.1%– 48.4%208213197BMW X2200.1%+ 185.7%194450.1%+ 462.5%194184198VW Tayron200.1%new –200.0%new231 –199BMW XM190.1%+ 26.7%163620.1%+ 31.9%179196200Range Rover Velar180.1%– 18.2%189450.1%– 33.8%196214201Citroen C5 X180.1%+ 50.0%256240.0%– 20.0%220243202Mercedes G-Class180.1%+ 800.0%170570.1%+ 714.3%184275203Zeekr 001160.1%– 60.0%212290.0%– 71.6%212138204Mercedes CLE-Class160.1%– 11.1%208330.1%+ 13.8%209222205Mercedes EQE150.1%– 73.2%213290.0%– 72.9%211158206Audi A6150.1%– 31.8%122870.1%– 1.1%156152207Honda ZR-V150.1%+ 275.0%221270.0%+ 92.9%214270208Mitsubishi Outlander150.1%n/a –150.0%n/a243 –209Alfa Romeo Tonale140.1%– 51.7%235240.0%– 57.9%219203210Smart #3140.1%– 44.0%180460.1%+ 31.4%192164211Porsche Taycan140.1%+ 75.0%181450.1%– 28.6%195198212Lancia Ypsilon140.1%new185440.1%new198255213Mercedes GLB130.0%– 31.6%217260.0%– 21.2%217227214Lexus RX130.0%– 13.3%244210.0%– 46.2%227233215DS 7 Crossback120.0%– 33.3%263170.0%– 57.5%234223216Mazda MX-5120.0%+ 9.1%246200.0%– 9.1%229251217Lexus RZ120.0%+ 100.0%220240.0%+ 41.2%221256218Bentley Continental120.0%+ 200.0%191390.1%+ 290.0%202291219MG HS120.0%new211270.0%new215303220BMW iX110.0%– 65.6%233210.0%– 70.0%226197221Subaru Forester110.0%+ 1000.0%241160.0%+ 433.3%239335222BMW 2-Series100.0%– 67.7%206280.0%– 45.1%213230223BMW i7100.0%– 16.7%229210.0%– 8.7%225232224Honda Jazz90.0%– 52.6%161530.1%– 8.6%186204225Mercedes EQS SUV90.0%– 25.0%239180.0%– 62.5%233224226Volvo V9090.0%– 10.0%245170.0%– 50.0%236200227Kia Xceed80.0%– 88.9%234180.0%– 83.6%232188228MG 580.0%– 78.9%258140.0%– 72.5%246193229Mercedes S-Class80.0%– 52.9%214220.0%– 48.8%224221230BMW 7-Series80.0%– 50.0%280120.0%– 53.8%253241231VW California80.0%+ 100.0%304100.0%+ 11.1%268263232Mercedes EQV70.0%– 65.0%205250.0%– 43.2%218240233Citroen C4 X70.0%– 36.4%270120.0%– 14.3%255225234Mercedes EQS70.0%– 22.2%251140.0%– 22.2%245254235NIO ET770.0%+ 40.0%259130.0%– 13.3%251236236Lynk & Co 0270.0%new243160.0%new238 –237Volvo S6060.0%– 79.3%262110.0%– 84.5%261175238Peugeot 50860.0%– 66.7%252130.0%– 50.0%252215239VW ID.560.0%– 62.5%178400.1%+ 73.9%201216240DS 460.0%+ 0.0%203260.0%+ 13.0%216219241Tesla Model S60.0%+ 0.0%285100.0%+ 0.0%266231242BMW 8-Series60.0%+ 200.0%236160.0%+ 60.0%237289243BMW X660.0%+ 500.0%281100.0%+ 11.1%264281244Leapmotor T0360.0%new109920.2%new152285245VW Touran60.0%n/a261120.0%n/a258272246VW Multivan50.0%– 93.0%31460.0%– 95.8%281140247Mazda MX-3050.0%– 82.8%209210.0%– 68.2%228178248Toyota Prius50.0%– 82.1%227160.0%– 69.2%240218249Ferrari 29650.0%+ 0.0%29780.0%+ 60.0%270301250Jeep Wrangler50.0%+ 150.0%248130.0%+ 85.7%250294251Audi e-Tron GT50.0%+ 150.0%272100.0%+ 233.3%263299252Polestar 350.0%new242140.0%new247211253Alpine A29050.0%new273100.0%new262393254Audi Q540.0%– 84.6%173400.1%– 51.8%200183255Honda Civic 40.0%– 81.8%218170.0%– 34.6%235206256Mercedes SL-Class40.0%– 20.0%32050.0%– 28.6%291321257Lexus UX40.0%+ 0.0%207220.0%+ 100.0%223253258BMW X440.0%+ 33.3%26790.0%+ 0.0%269279259Audi Q8 e-Tron30.0%– 97.9%27670.0%– 98.6%27699260VW Touareg30.0%– 80.0%226140.0%– 68.2%249209261DS 3 Crossback30.0%– 76.9%28470.0%– 58.8%278195262Ford Explorer30.0%– 72.7%230140.0%– 22.2%24476263Lexus ES30.0%– 50.0%26480.0%– 60.0%272280264Abarth 50030.0%– 50.0%30550.0%– 50.0%282274265Suzuki Swace30.0%– 40.0%228140.0%– 30.0%248250266Bentley Bentayga30.0%+ 0.0%30350.0%– 37.5%283305267Citroen Berlingo30.0%+ 0.0%33140.0%+ 33.3%300312268Tesla Model X30.0%+ 50.0%247110.0%+ 22.2%260239269VW Crafter30.0%+ 50.0%31940.0%– 20.0%310258270Audi A830.0%+ 50.0% –30.0%– 75.0%312284271BYD Tang30.0%+ 200.0%222150.0%+ 1400.0%241293272Toyota Proace City Verso30.0%+ 200.0%254100.0%+ 233.3%267329273Bentley Flying Spur30.0%+ 200.0%28370.0%+ 16.7%277344274Peugeot Rifter30.0%+ 200.0%30750.0%+ 150.0%295308275Ssangyong Torres30.0%n/a223150.0%+ 1400.0%242267276Alfa Romeo Giulia30.0%n/a32140.0%+ 300.0%299315277Mercedes Citan30.0%n/a –30.0%n/a316282278Audi A420.0%– 96.4%200220.0%– 87.8%222105279Ford Tourneo/Transit Connect20.0%– 75.0% –20.0%– 77.8%323390280Jaguar E-Pace20.0%– 60.0%26870.0%– 36.4%279288281Ferrari SF9020.0%– 60.0%29350.0%– 37.5%285313282Aston Martin DB1220.0%– 60.0%33030.0%– 40.0%311306283Subaru Crosstrek20.0%– 60.0%28220.0%– 84.6%325310284Volvo S9020.0%– 60.0% –20.0%– 77.8%330266285Mercedes V-Class20.0%– 50.0%26080.0%+ 0.0%274286286Lamborghini Urus20.0%– 50.0%29250.0%– 37.5%288300287Mercedes AMG GT20.0%– 50.0%29650.0%+ 0.0%289319288Nio EL620.0%– 50.0%31730.0%– 78.6%317271289Jaguar F-Pace20.0%+ 0.0%25780.0%– 50.0%271295290Xpeng P720.0%+ 0.0%26570.0%– 53.3%280264291Ferrari Purosangue20.0%+ 0.0%32430.0%+ 0.0%313337292Subaru Legacy/Outback20.0%+ 100.0%30240.0%– 42.9%308341293Maserati Grecale20.0%n/a –40.0%+ 0.0%303333294Lamborghini Revuelto20.0%new29850.0%new287352295NIO EL820.0%new30050.0%new292355296Vinfast VF820.0%new –20.0%new329311297Renault Megane10.0%– 98.4%27850.0%– 94.8%296149298Mazda610.0%– 96.7%28940.0%– 93.5%304252299Lotus Eletre10.0%– 93.3%29040.0%– 86.7%302234300MG eHS10.0%– 90.9%29540.0%– 69.2%306228301BMW Z410.0%– 88.9%231120.0%– 14.3%254244302Toyota Highlander10.0%– 88.9%31620.0%– 90.5%327265303Nio ET510.0%– 83.3%27950.0%– 77.3%293262304Porsche 718 Cayman10.0%– 75.0%25380.0%+ 14.3%275296305Toyota Proace10.0%– 66.7%29140.0%– 69.2%309242306VW Transporter10.0%– 66.7% –10.0%– 85.7%355322307Lamborghini Huracan10.0%– 50.0%32620.0%– 33.3%324336308Alpine A11010.0%+ 0.0% –10.0%– 66.7%331316309Jaguar i-Pace10.0%+ 0.0% –10.0%– 66.7%338350310Lexus LC10.0%+ 0.0% –10.0%+ 0.0%339367311Jeep Grand Cherokee10.0%n/a28650.0%+ 400.0%286331312Lucid Air10.0%new –10.0%new340278313Renault Kangoo10.0%n/a –10.0%+ 0.0%347375314Fiat Scudo10.0%n/a232120.0%n/a256307315Ford Transit Tourneo10.0%n/a238110.0%n/a259259316MG Cyberster10.0%new29940.0%new305359317Lamborghini Aventador10.0%n/a31230.0%n/a315 –318Aston Martin Vanquish10.0%n/a34020.0%n/a320 –319Maserati Grancabrio10.0%n/a31010.0%n/a342394320Nissan Townstar10.0%n/a –10.0%n/a346360
Source: BOVAG


More Stories
2027 Ram Power Wagon Finally Gets the Diesel It Deserves
Ram has been on a bit of a listening tour lately, and the 2027 Power Wagon feels like the loudest...
2027 Ram 1500 SRT TRX Roars Back with 777 HP and a Price Punch
Ram didn’t just bring the TRX back, it brought it back with a point to prove. After the supertruck bowed...
Saudi Arabia November 2025: Hyundai places Accent at #1 and i10 at #4
This content is for members only. Visit the site and log in/register to read.
United Arab Emirates November 2025: Mitsubishi Outlander and Tesla Model Y inside Top 5
This content is for members only. Visit the site and log in/register to read.
How Small Upgrades Can Make a Big Difference Off Road
When people think about improving off-road performance, they often picture major upgrades like suspension lifts or oversized tires. While those...
2026 Chrysler Pacifica Pinnacle AWD Review & Test Drive
The Chrysler Pacifica minivan continues to be a force to reckon with when it comes to an affordable transportation appliance...